

Optical tweezers-controlled hotspot for sensitive and reproducible surface-enhanced Raman spectroscopy characterization of native protein structures
- PMID: 33637710
- PMCID: PMC7910584
- DOI: 10.1038/s41467-021-21543-3
Optical tweezers-controlled hotspot for sensitive and reproducible surface-enhanced Raman spectroscopy characterization of native protein structures
Abstract
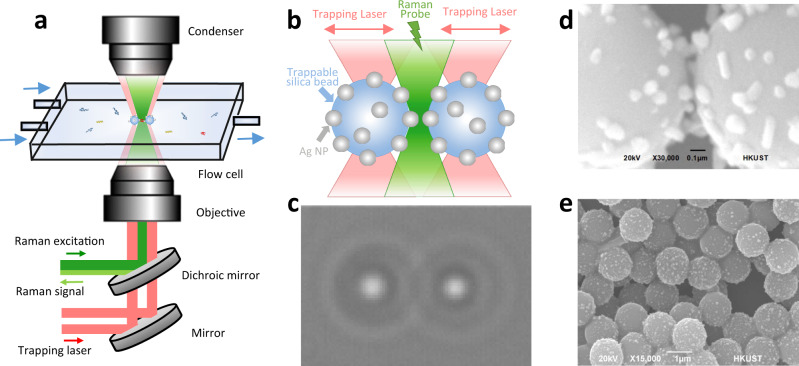
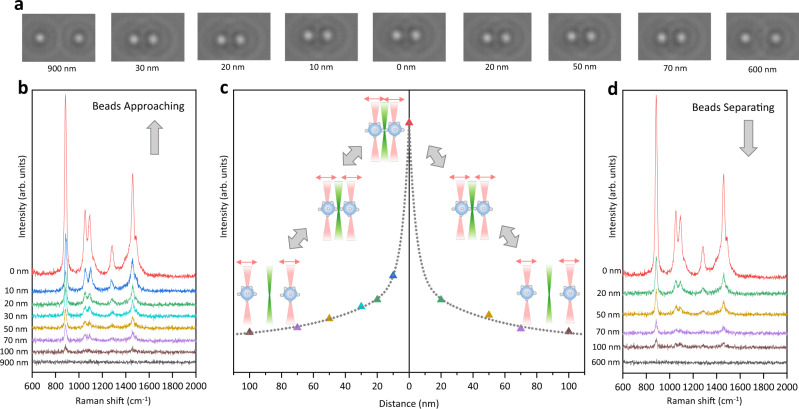
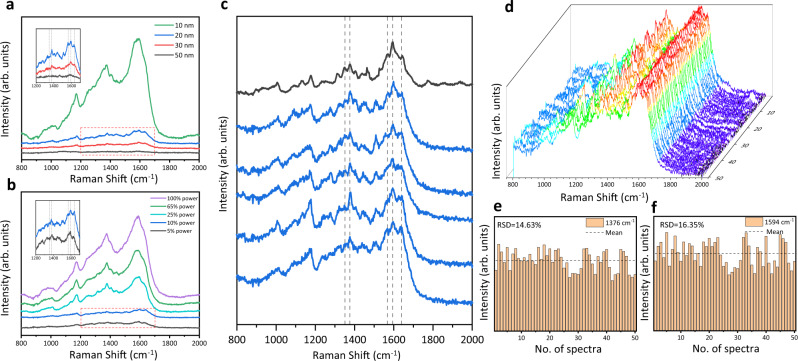
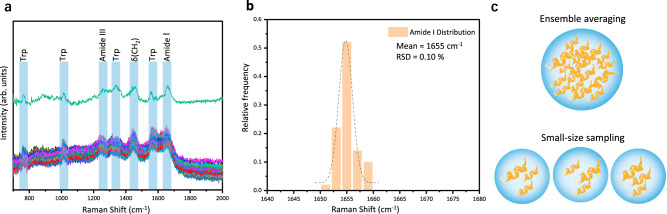
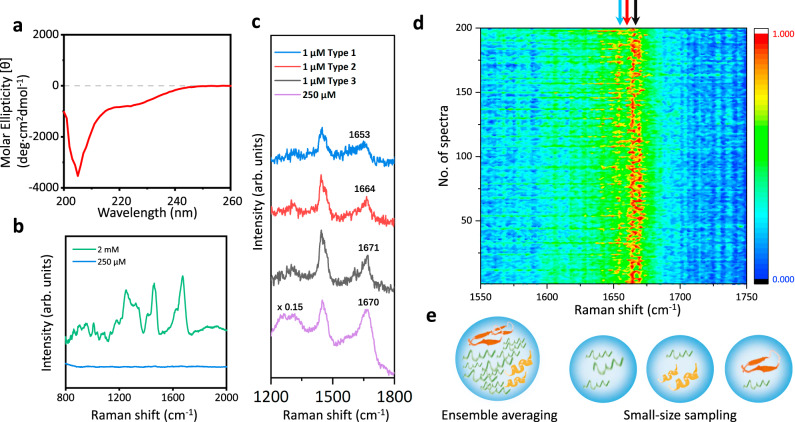
Surface-enhanced Raman spectroscopy (SERS) has emerged as a powerful tool to detect biomolecules in aqueous environments. However, it is challenging to identify protein structures at low concentrations, especially for the proteins existing in an equilibrium mixture of various conformations. Here, we develop an in situ optical tweezers-coupled Raman spectroscopy to visualize and control the hotspot between two Ag nanoparticle-coated silica beads, generating tunable and reproducible SERS enhancements with single-molecule level sensitivity. This dynamic SERS detection window is placed in a microfluidic flow chamber to detect the passing-by proteins, which precisely characterizes the structures of three globular proteins without perturbation to their native states. Moreover, it directly identifies the structural features of the transient species of alpha-synuclein among its predominant monomers at physiological concentration of 1 μM by reducing the ensemble averaging. Hence, this SERS platform holds the promise to resolve the structural details of dynamic, heterogeneous, and complex biological systems.
Conflict of interest statement
The authors declare no competing interests.
Figures
Similar articles
-
Optical Trapping of Plasmonic Nanoparticles for In Situ Surface-Enhanced Raman Spectroscopy Characterizations.J Vis Exp. 2022 Jun 23;(184). doi: 10.3791/63862. J Vis Exp. 2022. PMID: 35815975
-
Creating hot nanoparticle pairs for surface-enhanced Raman spectroscopy through optical manipulation.Nano Lett. 2006 Dec;6(12):2639-41. doi: 10.1021/nl062101m. Nano Lett. 2006. PMID: 17163680
-
In situ fabrication of 3D Ag@ZnO nanostructures for microfluidic surface-enhanced Raman scattering systems.ACS Nano. 2014 Dec 23;8(12):12175-84. doi: 10.1021/nn503826r. Epub 2014 Nov 17. ACS Nano. 2014. PMID: 25402207 Free PMC article.
-
Recent strategies toward microfluidic-based surface-enhanced Raman spectroscopy.Electrophoresis. 2017 Aug;38(16):1977-1987. doi: 10.1002/elps.201700046. Epub 2017 May 12. Electrophoresis. 2017. PMID: 28432695 Review.
-
Surface-enhanced Raman scattering imaging using noble metal nanoparticles.Wiley Interdiscip Rev Nanomed Nanobiotechnol. 2013 Mar-Apr;5(2):180-9. doi: 10.1002/wnan.1208. Epub 2013 Jan 17. Wiley Interdiscip Rev Nanomed Nanobiotechnol. 2013. PMID: 23335562 Review.
Cited by
-
Einstein Model of a Graph to Characterize Protein Folded/Unfolded States.Molecules. 2023 Sep 16;28(18):6659. doi: 10.3390/molecules28186659. Molecules. 2023. PMID: 37764437 Free PMC article.
-
Looking at Biomolecular Interactions through the Lens of Correlated Fluorescence Microscopy and Optical Tweezers.Int J Mol Sci. 2023 Jan 31;24(3):2668. doi: 10.3390/ijms24032668. Int J Mol Sci. 2023. PMID: 36768987 Free PMC article. Review.
-
Real-time SERS monitoring anticancer drug release along with SERS/MR imaging for pH-sensitive chemo-phototherapy.Acta Pharm Sin B. 2023 Mar;13(3):1303-1317. doi: 10.1016/j.apsb.2022.08.024. Epub 2022 Sep 5. Acta Pharm Sin B. 2023. PMID: 36970207 Free PMC article.
-
Efficient optical plasmonic tweezer-controlled single-molecule SERS characterization of pH-dependent amylin species in aqueous milieus.Nat Commun. 2023 Nov 2;14(1):6996. doi: 10.1038/s41467-023-42812-3. Nat Commun. 2023. PMID: 37914718 Free PMC article.
-
Single-cell stable isotope probing in microbial ecology.ISME Commun. 2022 Jul 6;2(1):55. doi: 10.1038/s43705-022-00142-3. ISME Commun. 2022. PMID: 37938753 Free PMC article. Review.
References
-
- Kneipp K, Kneipp H, Itzkan I, Dasari RR, Feld MS. Ultrasensitive chemical analysis by Raman spectroscopy. Chem. Rev. 1999;99:2957–2976. - PubMed
-
- Rygula A, et al. Raman spectroscopy of proteins: a review. J. Raman Spectrosc. 2013;44:1061–1076.
-
- Xu L-J, et al. Label-free detection of native proteins by surface-enhanced Raman spectroscopy using iodide-modified nanoparticles. Anal. Chem. 2014;86:2238–2245. - PubMed
-
- Han XX, Zhao B, Ozaki Y. Surface-enhanced Raman scattering for protein detection. Anal. Bioanal. Chem. 2009;394:1719–1727. - PubMed
-
- Feliu N, et al. SERS Quantification and characterization of proteins and other biomolecules. Langmuir. 2017;33:9711–9730. - PubMed
Publication types
MeSH terms
Substances
LinkOut - more resources
Full Text Sources
Other Literature Sources
Miscellaneous
