. 2021 Feb 26;12(2):216.
doi: 10.1038/s41419-021-03502-4.

High glucose induces Drp1-mediated mitochondrial fission via the Orai1 calcium channel to participate in diabetic cardiomyocyte hypertrophy

Affiliations

High glucose induces Drp1-mediated mitochondrial fission via the Orai1 calcium channel to participate in diabetic cardiomyocyte hypertrophy

Qing-Rui Wu et al. Cell Death Dis. .

Abstract

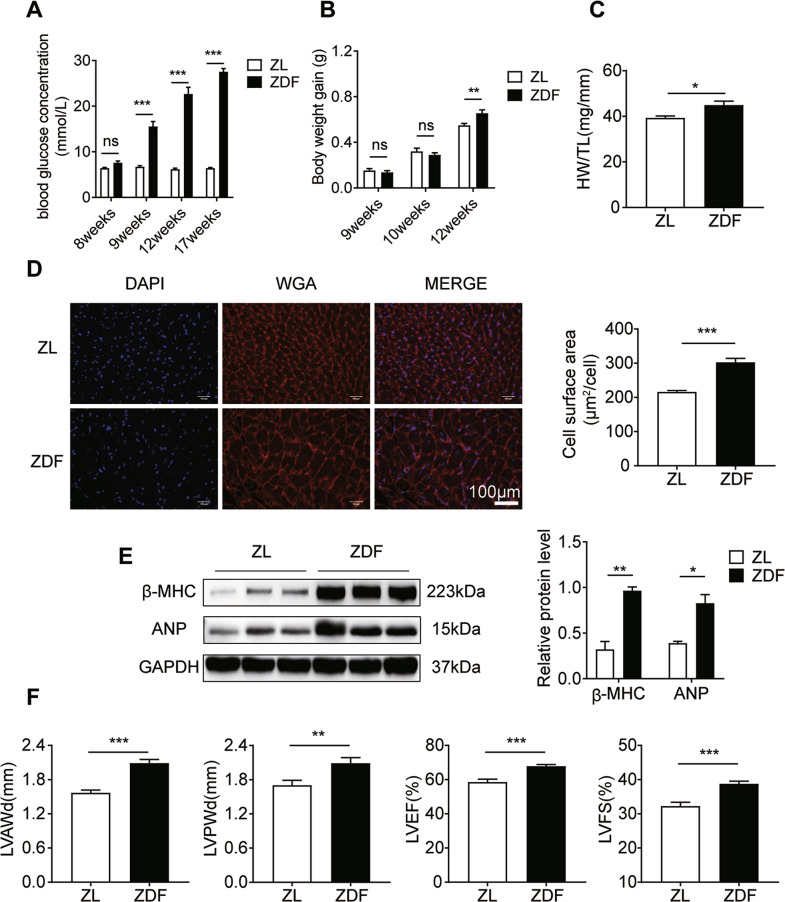
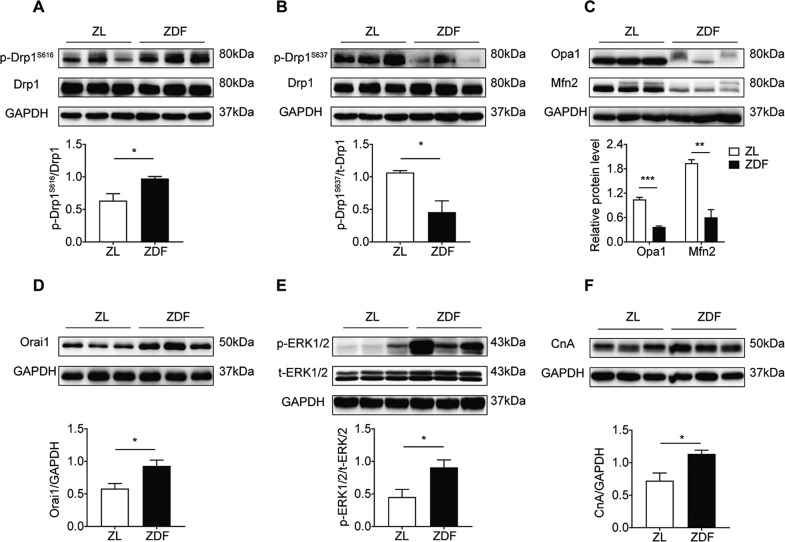
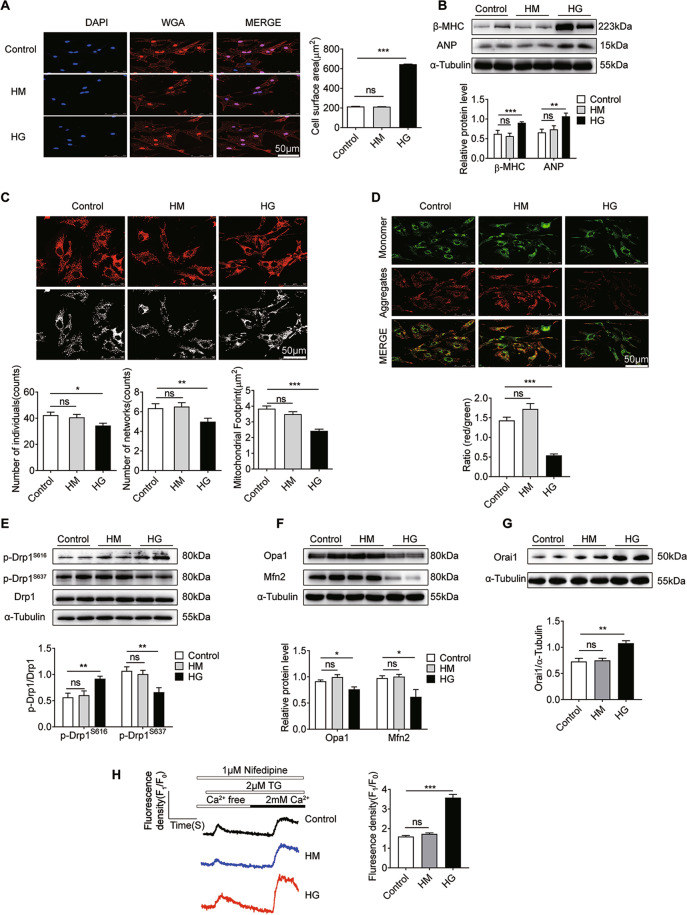
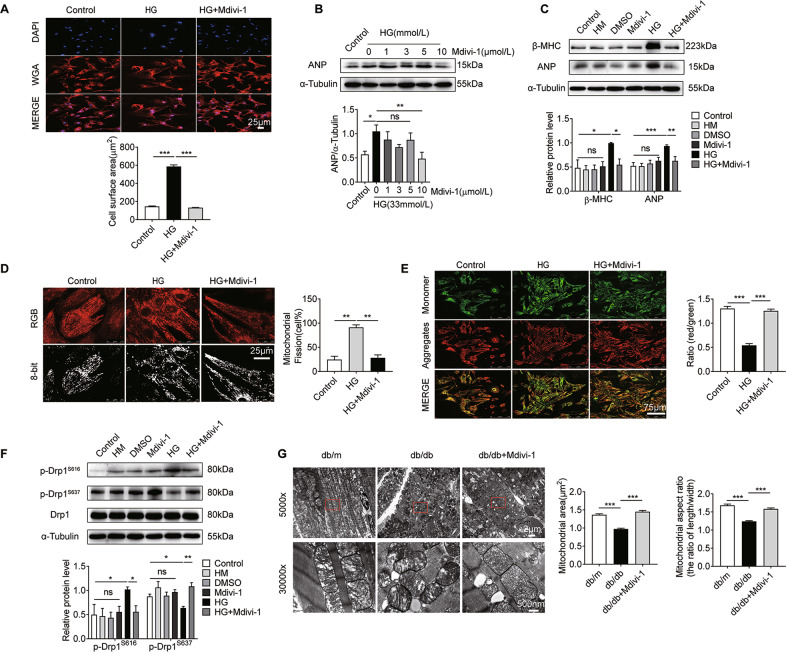
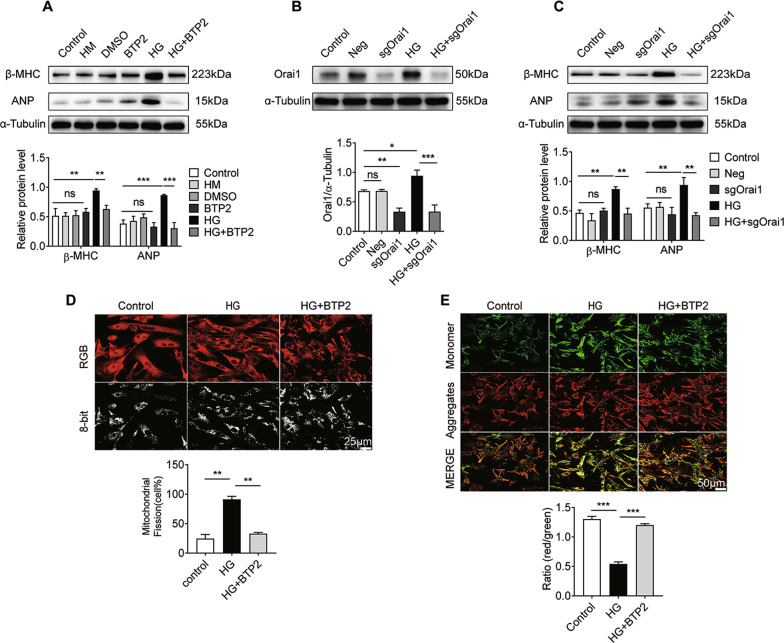
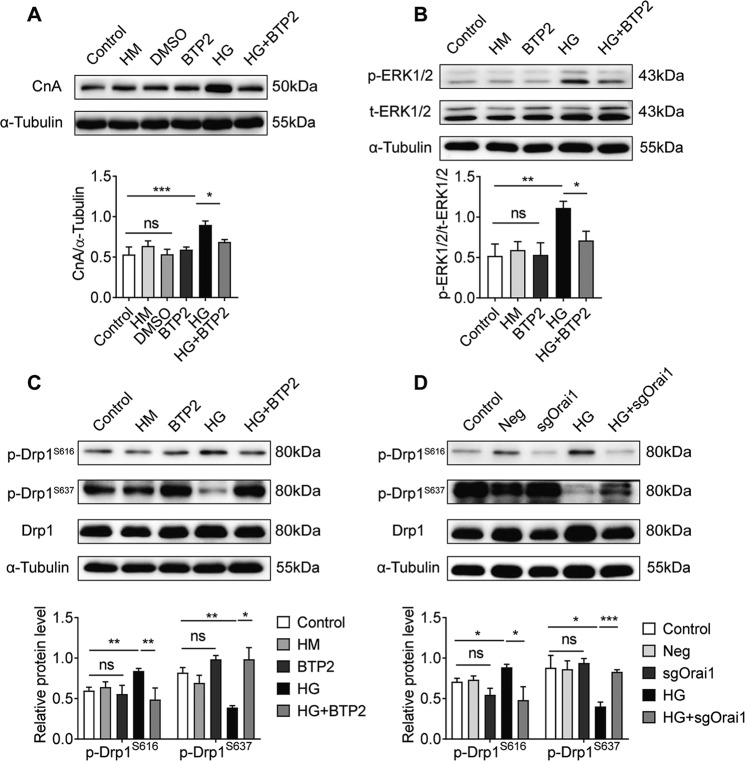
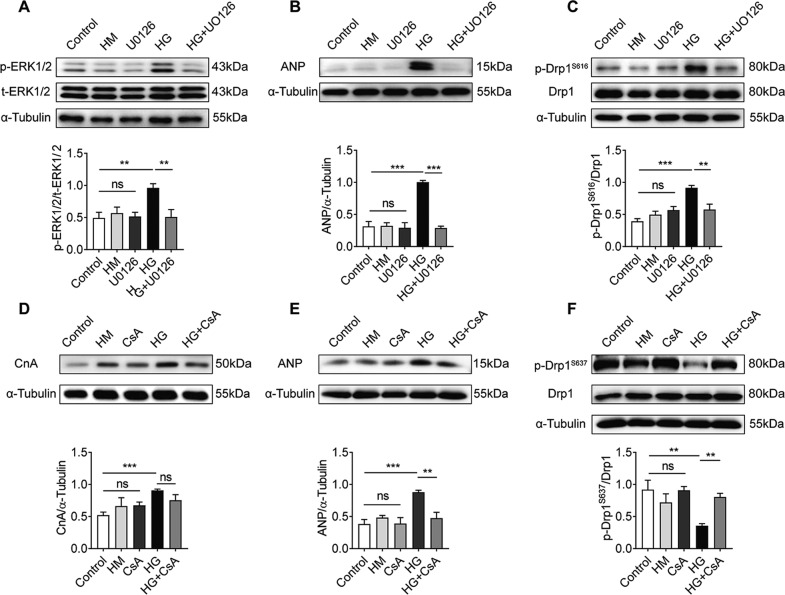
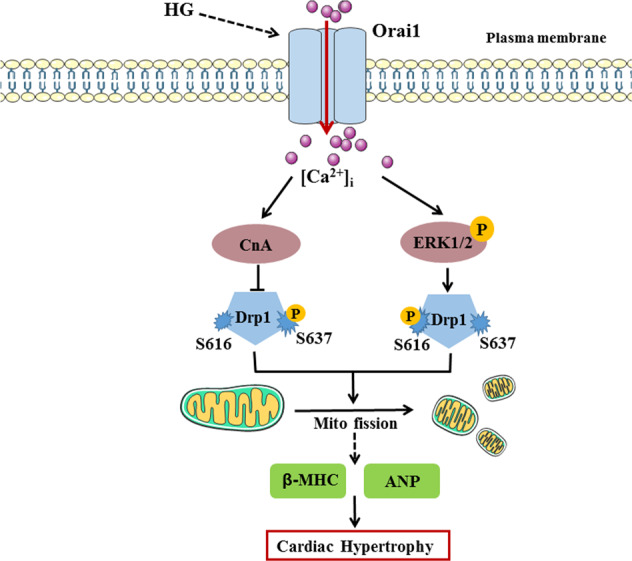
Mitochondrial dysfunction and impaired Ca2+ handling are involved in the development of diabetic cardiomyopathy (DCM). Dynamic relative protein 1 (Drp1) regulates mitochondrial fission by changing its level of phosphorylation, and the Orai1 (Ca2+ release-activated calcium channel protein 1) calcium channel is important for the increase in Ca2+ entry into cardiomyocytes. We aimed to explore the mechanism of Drp1 and Orai1 in cardiomyocyte hypertrophy caused by high glucose (HG). We found that Zucker diabetic fat rats induced by administration of a high-fat diet develop cardiac hypertrophy and impaired cardiac function, accompanied by the activation of mitochondrial dynamics and calcium handling pathway-related proteins. Moreover, HG induces cardiomyocyte hypertrophy, accompanied by abnormal mitochondrial morphology and function, and increased Orai1-mediated Ca2+ influx. Mechanistically, the Drp1 inhibitor mitochondrial division inhibitor 1 (Mdivi-1) prevents cardiomyocyte hypertrophy induced by HG by reducing phosphorylation of Drp1 at serine 616 (S616) and increasing phosphorylation at S637. Inhibition of Orai1 with single guide RNA (sgOrai1) or an inhibitor (BTP2) not only suppressed Drp1 activity and calmodulin-binding catalytic subunit A (CnA) and phosphorylated-extracellular signal-regulated kinase (p-ERK1/2) expression but also alleviated mitochondrial dysfunction and cardiomyocyte hypertrophy caused by HG. In addition, the CnA inhibitor cyclosporin A and p-ERK1/2 inhibitor U0126 improved HG-induced cardiomyocyte hypertrophy by promoting and inhibiting phosphorylation of Drp1 at S637 and S616, respectively. In summary, we identified Drp1 as a downstream target of Orai1-mediated Ca2+ entry, via activation by p-ERK1/2-mediated phosphorylation at S616 or CnA-mediated dephosphorylation at S637 in DCM. Thus, the Orai1-Drp1 axis is a novel target for treating DCM.


Conflict of interest statement

The authors declare no competing interests.

Figures

Fig. 1
Fig. 1. ZDF rats develop cardiac hypertrophy and exhibit impaired cardiac function.
A Blood glucose at various time points (n = 10). B Body weight gain (g) = (final body weight − initial body weight)/initial body weight (n = 10). C Heart weight/tibia length (HW/TL, g/mm) ratio (n = 9). D WGA staining (red) of the surface membrane of cardiomyocytes, and DAPI staining (blue) of nuclei, scale bars = 100 μm. Quantification of the surface area of cardiomyocytes by WGA staining (n = 10). E Western blotting images and summarized data showing ANP and β-MHC levels in the ventricular tissue of ZL and ZDF rats (n = 6). F Echocardiographic parameters of each group of rats (n = 10). Data are shown as mean ± SEM. *P < 0.05, **P < 0.01, and ***P < 0.001 vs ZL group.
Fig. 2
Fig. 2. Expression levels of mitochondrial dynamics and calcium handling pathway-related proteins in a hypertrophic hearts of ZDF rats.
A Western blotting images and summarized data showing phospho-Drp1 (S616) and total Drp1 protein levels in the ventricular tissue of ZL and ZDF rats (n = 6). B Western blotting images and summarized data showing phospho-Drp1 (S637) and total Drp1 protein levels in the ventricular tissue of ZL and ZDF rats (n = 6). C Western blotting images and summarized data showing Mfn2 and Opa1 protein levels in the ventricular tissue of ZL and ZDF rats (n = 6). DF Western blotting images and summarized data showing Orai1, phospho-ERK1/2, total ERK1/2, and CnA protein levels in the ventricular tissue of ZL and ZDF rats (n = 6). Data are shown as mean ± SEM. *P < 0.05, **P < 0.01, and ***P < 0.001 vs ZL group.
Fig. 3
Fig. 3. HG induces cardiomyocyte hypertrophy with abnormalities in mitochondrial dynamics and calcium handling.
A WGA staining (red) of the surface membrane of cardiomyocytes, and DAPI staining (blue) of nuclei. Scale bars = 50 μm. To quantify cardiomyocyte size, HG induced an increase in cardiomyocyte size (n = 45 cells). B Western blotting images and summarized data showing β-MHC (n = 5) and ANP (n = 11) levels in NRCMs. C Confocal images of mitochondrial morphology in NRCMs. RGB color, scale bars = 50 μm; 8-bit color, scale bars = 3 μm. There was a main effect of HG on the number of individuals and networks, and the size of the mitochondrial footprint. Overall, HG decreased all mitochondrial network parameters (n = 140 cells). D JC-1 staining of NRCMs. Red fluorescence is from JC-1 aggregates in healthy mitochondria with polarized inner mitochondrial membranes, while green fluorescence is emitted by cytosolic JC-1 monomers and indicates MMP dissipation. Merged images indicate the co-localization of JC-1 aggregates and monomers. Scale bar = 50 μm. MMP of cardiomyocytes for each group was calculated as the fluorescence ratio of red to green. HG decreased the MMP (n = 390 cells). E Western blotting images and summarized data showing Drp1 protein level and phosphorylation at S616 (n = 6) or S637 (n = 8) in NRCMs. F Western blotting images and summarized data showing Opa1 (n = 4) and Mfn2 (n = 3) protein levels in NRCMs. G Western blotting images and summarized data showing Orai1 protein levels in NRCMs (n = 4). H Representative traces of Ca2+ influx in NRCMs are shown. Fluorescence intensity measurements of Fluo4-AM revealed the intracellular Ca2+ concentration in NRCMs following CaCl2 stimulation (n = 76 cells). F1 fluorescence intensity, F0 baseline fluorescence. Data are shown as mean ± SEM. *P < 0.05, **P < 0.01, and ***P < 0.001; n.s. no significant statistical difference.
Fig. 4
Fig. 4. Mdivi-1 alleviates cardiomyocyte hypertrophy induced by HG by decreasing Drp1-dependent mitochondrial fission.
A WGA staining (red) of the surface membrane of cardiomyocytes, and DAPI staining (blue) of nuclei. Scale bars = 25 μm. To quantify cardiomyocyte size, HG induced an increase in cardiomyocyte size (n = 104 cells). B Changes in ANP expression in NRCMs treated with different concentrations of Mdivi-1 (n = 4). C Changes in β-MHC (n = 4) and ANP (n = 6) levels in NRCMs treated with 10 μM Mdivi-1. D Mitochondrial fission was detected by Mito-Tracker Red staining. Mitochondrial fission was quantified by counting the proportion of cells with fragmented mitochondria (n = 138 cells). Scale bar = 25 μm. E MMP of NRCMs was detected by JC-1 staining (10 μg/ml) using confocal microscopy. Scale bar = 75 μm. MMP of cardiomyocytes for each group was calculated as the fluorescence ratio of red to green. HG decreased the MMP (n = 290 cells). F Western blotting images and summarized data showing phospho-Drp1 (S616/S637) and total Drp1 protein levels in NRCMs (n = 3). G Representative transmission electron microscopy images of mitochondria and sarcomere ultrastructure. Scale bars = 2 μm (×5000) or 500 nm (×30,000). Mean area of mitochondria and mitochondrial aspect ratio. At least 100 randomly selected mitochondria were analyzed for each group. Data are shown as mean ± SEM. *P < 0.05, **P < 0.01, and ***P < 0.001; n.s. no significant statistical difference.
Fig. 5
Fig. 5. Orai1 inhibition prevents HG-induced cardiomyocyte hypertrophy and mitochondrial dysfunction in NRCMs.
A Changes of β-MHC (n = 4) and ANP (n = 5) levels in NRCMs treated with BTP2 at 10 μM. B, C Changes in Orai1 (n = 4), β-MHC (n = 4), and ANP (n = 5) levels in NRCMs infected with sgOrai1 at 80 MOI for 72 h. D Mitochondrial fission was detected by Mito-Tracker Red staining. Scale bar = 25 μm. Mitochondrial fission was quantified by counting the proportion of cells with fragmented mitochondria (n = 137 cells). E MMP of NRCMs was detected by JC-1 staining (10 μg/ml) using confocal microscopy. Scale bar = 50 μm. MMP of cardiomyocytes for each group was calculated as the fluorescence ratio of red to green. HG decreased the MMP (n = 180 cells). Data are shown as mean ± SEM. *P < 0.05, **P < 0.01, and ***P < 0.001; n.s. no significant statistical difference.
Fig. 6
Fig. 6. Orai1 might contribute to HG-induced cardiomyocyte hypertrophy via activation of CnA, ERK-Drp1 pathways.
A Changes in CnA levels in NRCMs treated with 10 μM BTP2 (n = 4). B Changes of p-ERK1/2 and total ERK1/2 protein levels in NRCMs treated with BTP2 10 μM (n = 3). C Western blotting images and summarized data showing p-Drp1S616 (n = 4) and p-Drp1S637 (n = 3) protein levels in NRCMs treated with 10 μM BTP2. D Changes of p-Drp1S616 (n = 4) and p-Drp1S637 (n = 4) levels in NRCMs infected with sgOrai1 at 80 MOI for 72 h. The protein levels of phospho-Drp1 (S616/S637) were normalized by total Drp1. Data are shown as mean ± SEM. *P < 0.05, **P < 0.01, and ***P < 0.001; n.s: no significant statistical difference.
Fig. 7
Fig. 7. CnA and p-ERK1/2 contribute to HG-induced cardiomyocyte hypertrophy by regulating Drp1 phosphorylation.
A Changes in p-ERK1/2 levels in NRCMs treated with U0126 at 10 μΜ. Protein levels of p-ERK1/2 were normalized by total ERK1/2 (n = 4). B Changes in ANP levels in NRCMs treated with U0126 at 10 μM (n = 7). C Changes in p-Drp1S616 levels in NRCMs treated with 10 μΜ U0126. The protein level of p-Drp1S616 was normalized by total ERK1/2 (n = 6). D Changes in CnA levels in NRCMs treated with 10 μΜ CsA (n = 3). E Changes of ANP level in NRCMs treated with CsA at 10 μM (n = 5). F Changes in p-Drp1S637 levels in NRCMs treated with 10 μΜ CsA. Quantification of Drp1 phosphorylation at S637 corrected for total Drp1 (n = 4). Data are shown as mean ± SEM. *P < 0.05, **P < 0.01, and ***P < 0.001; n.s. no significant statistical difference.
Fig. 8
Fig. 8. Schematic diagram depicting proposed Orai1–Drp1 signaling pathway in cardiomyocyte hypertrophy induced by HG.
HG stimulation induces upregulation of Orai1. Then, Orai1-mediated Ca2+ entry targets CnA to inhibit Drp1 phosphorylation at S637, inducing cardiac hypertrophy. Orai1-mediated Ca2+ entry also targets p-ERK1/2 to induce Drp1 phosphorylation at S616. Phosphorylation of Drp1 at S616 is increased, while phosphorylation of Drp1 at S637 is decreased, promoting mitochondrial fission and accelerating HG-induced cardiac hypertrophy. Inhibition of the Orai1–Drp1 signaling pathway could prevent cardiac hypertrophy induced by HG.

Similar articles

Cited by

References

    1. Parim B, Sathibabu Uddandrao VV, Saravanan G. Diabetic cardiomyopathy: molecular mechanisms, detrimental effects of conventional treatment, and beneficial effects of natural therapy. Heart Fail. Rev. 2019;24:279–299. doi: 10.1007/s10741-018-9749-1. - DOI - PubMed
    1. Jia G, Hill MA, Sowers JR. Diabetic cardiomyopathy: an update of mechanisms contributing to this clinical entity. Circ. Res. 2018;122:624–638. doi: 10.1161/CIRCRESAHA.117.311586. - DOI - PMC - PubMed
    1. Galloway CA, Yoon Y. Mitochondrial dynamics in diabetic cardiomyopathy. Antioxid. Redox Signal. 2015;22:1545–1562. doi: 10.1089/ars.2015.6293. - DOI - PMC - PubMed
    1. Yan K, Wang K, Li P. The role of post-translational modifications in cardiac hypertrophy. J. Cell. Mol. Med. 2019;23:3795–3807. doi: 10.1111/jcmm.14330. - DOI - PMC - PubMed
    1. Kashatus JA, et al. Erk2 phosphorylation of Drp1 promotes mitochondrial fission and MAPK-driven tumor growth. Mol. Cell. 2015;57:537–551. doi: 10.1016/j.molcel.2015.01.002. - DOI - PMC - PubMed

Publication types

MeSH terms