. 2021 Feb 26;12(1):1298.
doi: 10.1038/s41467-021-21382-2.

The TUTase URT1 connects decapping activators and prevents the accumulation of excessively deadenylated mRNAs to avoid siRNA biogenesis

Affiliations

The TUTase URT1 connects decapping activators and prevents the accumulation of excessively deadenylated mRNAs to avoid siRNA biogenesis

Hélène Scheer et al. Nat Commun. .

Abstract

Uridylation is a widespread modification destabilizing eukaryotic mRNAs. Yet, molecular mechanisms underlying TUTase-mediated mRNA degradation remain mostly unresolved. Here, we report that the Arabidopsis TUTase URT1 participates in a molecular network connecting several translational repressors/decapping activators. URT1 directly interacts with DECAPPING 5 (DCP5), the Arabidopsis ortholog of human LSM14 and yeast Scd6, and this interaction connects URT1 to additional decay factors like DDX6/Dhh1-like RNA helicases. Nanopore direct RNA sequencing reveals a global role of URT1 in shaping poly(A) tail length, notably by preventing the accumulation of excessively deadenylated mRNAs. Based on in vitro and in planta data, we propose a model that explains how URT1 could reduce the accumulation of oligo(A)-tailed mRNAs both by favoring their degradation and because 3' terminal uridines intrinsically hinder deadenylation. Importantly, preventing the accumulation of excessively deadenylated mRNAs avoids the biogenesis of illegitimate siRNAs that silence endogenous mRNAs and perturb Arabidopsis growth and development.


Conflict of interest statement

The authors declare no competing interests.

Figures
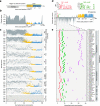
Fig. 1
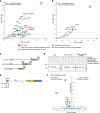
Fig. 1. Short linear motifs are conserved in plant URT1 orthologs.
a Domain organization of URT1. CCD catalytic core domain, Ntrf polymerase β-like nucleotidyltransferase domain, PAP-assoc Poly(A) polymerase-associated domain. The region of P/Q/N/G enrichment is indicated. Numbers refer to amino acid positions in URT1. b Disorder propensity of URT1 predicted by ESpritz-NMR and aggregated by FELLS. c Disorder propensity of URT1 orthologs in Archaeplastida. The length of URT1 sequences was normalized to 100. The number of sequences considered are indicated for each group. d Sequence conservation of URT1 orthologs among land plants. The conservation score was calculated with ConSurf from an alignment of 247 sequence homologs of URT1 in land plants (see Supplementary Data 1) and using URT1 sequence as a reference. Consensus logos for M1 and M2 motifs are displayed in bits and were calculated from the alignment. e Occurrence of M1 (red), M2 (green), and PPGF (purple) motifs among URT1 orthologs of land plants. The slightly divergent M1 motif of URT1B in Poales is in light red. The length of 74 URT1 sequences was normalized to 100. The source data are available in Supplementary Data 1.
Fig. 2
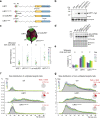
Fig. 2. URT1 co-purifies with translational repressors/decapping activators.
Enrichment of proteins co-purified with myc and YFP-tagged URT1 with formaldehyde crosslink (a) or without (b). The dashed line indicates the threshold above which proteins are significantly enriched (adjusted p value < 0.05, quasi-likelihood negative binomial generalized log-linear model). c Common domain organization of Arabidopsis (At) DCP5 and its human (Hs) and yeast (Sc) orthologs LSM14A and Scd6, respectively. d In vitro GST pull-down assay showing a direct URT1-DCP5 interaction. Pull-downs were performed in presence of RNase A with the recombinant proteins 6His-GST, 6His-GST-URT1, 6His-MBP-DCP5, 6His-GST-m1URT1, and 6His-MBP-∆LSmDCP5. Pull-down and input fractions were analyzed by SDS-PAGE and SYPRO Ruby staining. e Diagram illustrating the point mutations in m1URT1 construct. f Volcano plot showing proteins differentially enriched (log2 fold change > 0) or depleted (log2 fold change < 0) in myc-tagged m1URT1 versus myc-tagged URT1 IPs. The dashed line indicates the significant threshold (adjusted p value < 0.05, quasi-likelihood negative binomial generalized log-linear model). Dot color code is as in a. The source data are available in Supplementary Data 2, at [https://www.ebi.ac.uk/pride/archive/projects/PXD018672] and at [10.17632/ybcvvmtcn9.3].
Fig. 3
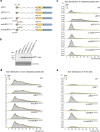
Fig. 3. Ectopic expression of URT1 remodels poly(A) tail profiles.
a Domain organization and mutations of different URT1-myc versions transiently expressed in N. benthamiana leaf patches. Legend as in Fig. 1a. b Western blot analysis of URT1-myc expression. c Representative N. benthamiana leaf under UV light to detect the expression of the GFP reporter co-expressed with the different URT1-myc versions (top). Quantification of GFP fluorescence of the different patches relative to control (ctrl) for 11 independent replicates (bottom). d Northern blot analysis of the steady-state level of GFP mRNAs. The arrows indicate unspliced and mature forms of GFP mRNAs. e Uridylation percentage of GFP reporter mRNAs for six biological replicates. f, g Distribution profiles of GFP mRNA poly(A) tail sizes. The percentages of sequences were calculated for six biological replicates for uridylated (f) and homopolymeric poly(A) tails (non-uridylated) (g) tails from 1 to 90 nucleotides. The percentages were calculated using the total number of sequences with tails from 1 to 90 nucleotides. Individual points are color-coded for each replicate and the average of all replicates is indicated as a gray area. The pie charts represent the average proportion of tails longer than 90 nucleotides. Letters in (c, eg) represent significant statistical p value (two-tailed Wilcoxon rank-sum test, n = 11 (c) and n = 6 (eg)). Exact p values are indicated in Supplementary Data 3e. The source data are available in Supplementary Data 3, at [https://www.ncbi.nlm.nih.gov/geo/query/acc.cgi?acc=GSE148409] and at [10.17632/ybcvvmtcn9.3].
Fig. 4
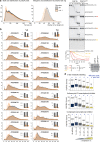
Fig. 4. Accumulation of oligo(A) uridylated and A-rich-tailed GFP mRNAs upon overexpression of URT1D491/3A requires the M1 motif.
a Domain organization and mutations of URT1-myc versions. b Western blot analysis of URT1-myc expression. ce Distribution profiles of GFP mRNA poly(A) tail sizes. The percentages of sequences were calculated for three biological replicates for uridylated (c), non-uridylated (d) and A-rich (e) tails from 1 to 90 nucleotides. The percentages were calculated using the total number of sequences with tails from 1 to 90 nucleotides. Individual points are color-coded for each replicate and the average of all replicates is indicated as a gray area. The source data are available in Supplementary Data 3, at [https://www.ncbi.nlm.nih.gov/geo/query/acc.cgi?acc=GSE148409] and at [10.17632/ybcvvmtcn9.3].
Fig. 5
Fig. 5. URT1-mediated uridylation shapes poly(A) tails in Arabidopsis.
a Global mRNA poly(A) profiles determined by nanopore DRS for WT and urt1-1 plants. Individual points are shown for three biological replicates for WT (gray) and urt1-1 (orange) and the respective average is indicated as a colored area, both for bulk (right) and intergenic (left) poly(A) size distribution. b Distribution profiles of poly(A) tail sizes determined by 3′RACE-seq for 22 mRNAs in WT (gray) and urt1-1 (orange). The panels for the 22 mRNAs were ranked according to their uridylation levels in wild-type plants. The percentages of sequences were calculated for tails from 1 to 90 nt for two biological replicates. Tail length includes poly(A) stretches and eventual 3′ terminal uridines. Dashed lines indicate the 10 and 25 nt tail sizes. Small bar plots display the uridylation percentage in WT and urt1-1 for each mRNA. c Deadenylation assay. Wild-type and mutated 6His-GST-CAF1b proteins (indicated by an arrow on the Sypro Ruby stained SDS-PAGE gel shown at the bottom of c) were incubated with 5′-labeled RNA substrates containing either an oligo(A) stretch and 0, 1, or 2 uridines, or 14 terminal uridines as indicated on the top right of each panel. The graph represents the disappearance of intact RNA substrates. Half-lives (±SD) are indicated for each RNA substrate in minutes (see Supplementary Fig. 5b). d Boxplot analysis comparing mRNA half-lives as determined by 5-EU metabolic labeling, transcription inhibition by actinomycin D or cordycepin vs. the percentage of mRNA uridylation in WT. Boxplot displays the median, first and third quartiles (lower and upper hinges), the largest value smaller and the smallest value larger than 1.5 interquartile (upper and lower whiskers). Uridylation percentages were measured by TAIL-seq. Datasets from three biological replicates were pooled. Numbers and letters above the boxplot represent the number of mRNAs for each category and significant statistical p values (two-tailed Wilcoxon rank-sum test), respectively. Exact p values are indicated in Supplementary Data 5b. The source data are available in Supplementary Data 3–5 and at [https://www.ncbi.nlm.nih.gov/geo/query/acc.cgi?acc=GSE148406].
Fig. 6
Fig. 6. URT1-mediated uridylation prevents the production of spurious siRNAs targeting mRNAs.
a Rosettes of WT, urt1-1, xrn4-3, and urt1-1 xrn4-3 plants. Numbers below the enlarged images of the rosette center indicate the ratio of normally developed shoot apical meristem to total numbers of plants. b Flowering time of WT, urt1-1, xrn4-3, and urt1-1 xrn4-3 defined as the number of days from seed sowing until the opening of the first flower. Bar plots show the mean (±SD) of the flowering time measured for twelve plants of two biological replicates. Individual points are shown for each plants. Numbers of flowering plants/total number of plants are indicated above each bar plot. Plants in (a, b) were grown in 12-h light/12-h darkness photoperiod. c, d Small RNA-seq analyses performed for two biological replicates from 24-day-old seedlings grown in vitro in 12-h light/12-h darkness photoperiod. c Bars plot show the number of 21–25-nt reads as counts per million (CPM) that map to mRNAs in WT, urt1-1, xrn4-3, and urt1-1 xrn4-3. d Venn diagrams show the number of mRNAs for which siRNA levels differentially increased or decreased in urt1-1 (orange), xrn4-3 (blue), and urt1-1 xrn4-3 (green) when compared to WT. e Rosettes of WT, dcl2-1 dcl4-1, urt1-1 xrn4-3, and dcl2-1 dcl4-1 urt1-1 xrn4-3 plants grown in 12-h light/12-h darkness photoperiod. f Boxplot analysis comparing the percentage of mRNA uridylation in WT vs. the accumulation of siRNAs in urt1-1 xrn4-3. Boxplot displays the median, first and third quartiles (lower and upper hinges), the largest value smaller and the smallest value larger than 1.5 interquartile (upper and lower whiskers). Uridylation percentages were measured by TAIL-seq. Datasets from three biological replicates were pooled. Numbers and letters above the boxplot represent the number of mRNAs for each category and significant statistical p values (two-tailed Wilcoxon rank-sum test), respectively. Exact p values are indicated in Supplementary Data 5b. The source data are available in Supplementary Data 5 and 6, and at [https://www.ncbi.nlm.nih.gov/geo/query/acc.cgi?acc=GSE148449] and [10.17632/ybcvvmtcn9.3].
Fig. 7
Fig. 7. Model of URT1 mode of action.
The name correspondence of RNA decay factors conserved between Arabidopsis and humans is indicated at the bottom.

Similar articles

Cited by

References

    1. De Almeida C, et al. RNA uridylation and decay in plants. Philos. Trans. R. Soc. Lond. B. Biol. Sci. 2018;373:20180163. doi: 10.1098/rstb.2018.0163. - DOI - PMC - PubMed
    1. Zigáčková D, Vaňáčová Š. The role of 3’ end uridylation in RNA metabolism and cellular physiology. Philos. Trans. R. Soc. Lond. B. Biol. Sci. 2018;373:20180171. doi: 10.1098/rstb.2018.0171. - DOI - PMC - PubMed
    1. Scheer H, Zuber H, De Almeida C, Gagliardi D. Uridylation earmarks mRNAs for degradation… and more. Trends Genet. 2016;32:607–619. doi: 10.1016/j.tig.2016.08.003. - DOI - PubMed
    1. De Almeida, C., Scheer, H., Zuber, H. & Gagliardi, D. RNA uridylation: a key post-transcriptional modification shaping the coding and non-coding transcriptome. WIREs RNA e1440 10.1002/wrna.1440 (2018). - PubMed
    1. Rissland OS, Norbury CJ. Decapping is preceded by 3’ uridylation in a novel pathway of bulk mRNA turnover. Nat. Struct. Mol. Biol. 2009;16:616–623. doi: 10.1038/nsmb.1601. - DOI - PMC - PubMed

Publication types

MeSH terms