. 2021 Feb 26;7(1):13.
doi: 10.1038/s41540-021-00173-x.

Cell polarisation in a bulk-surface model can be driven by both classic and non-classic Turing instability

Affiliations

Cell polarisation in a bulk-surface model can be driven by both classic and non-classic Turing instability

Johannes Borgqvist et al. NPJ Syst Biol Appl. .

Abstract

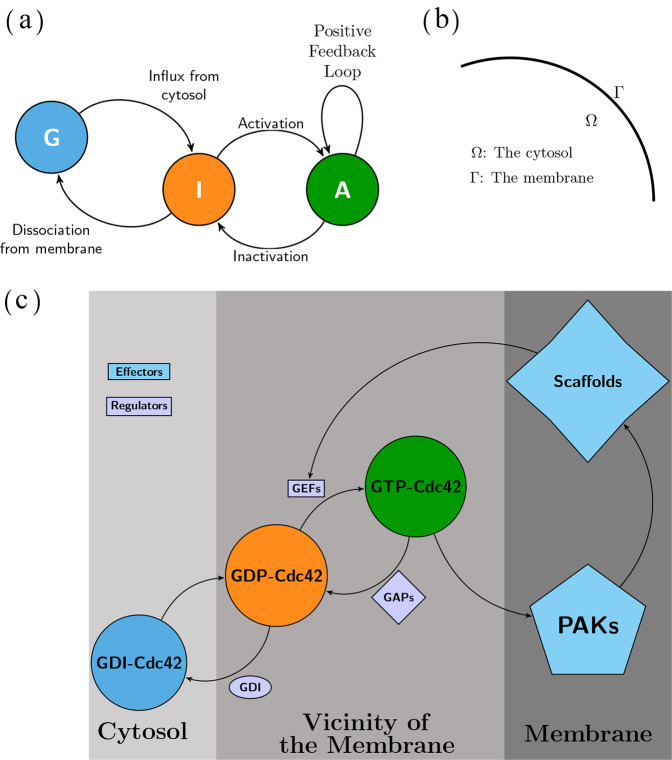
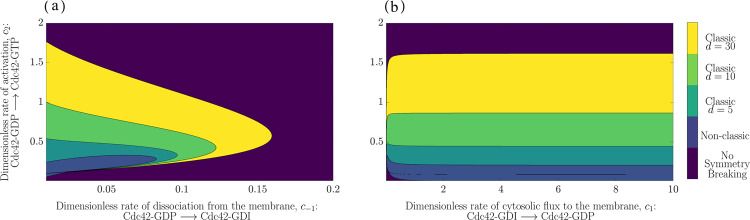
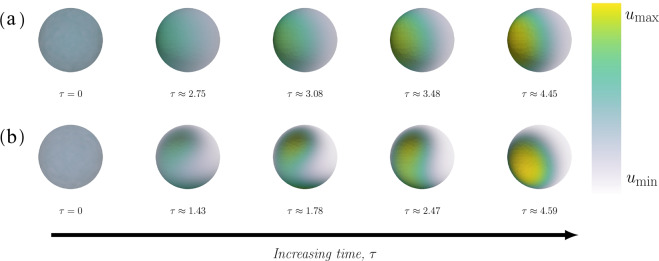
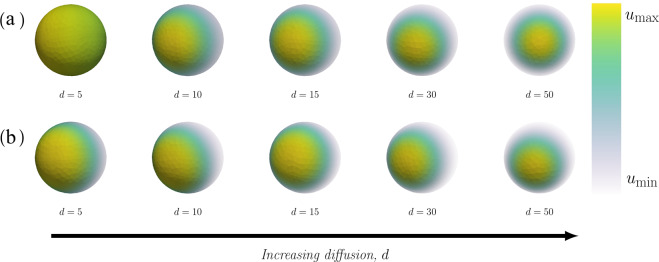
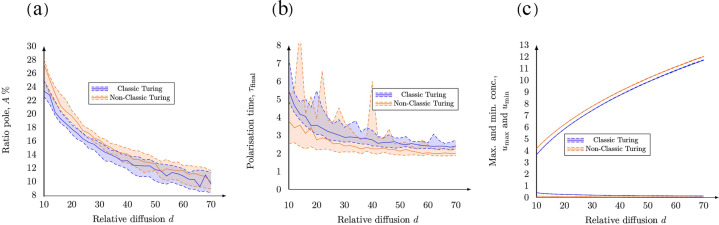
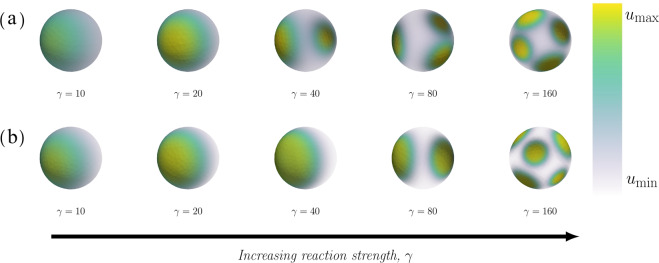
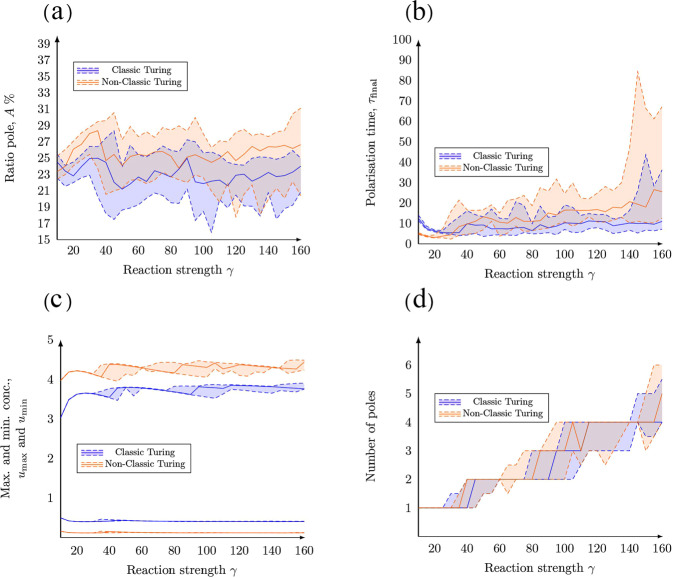
The GTPase Cdc42 is the master regulator of eukaryotic cell polarisation. During this process, the active form of Cdc42 is accumulated at a particular site on the cell membrane called the pole. It is believed that the accumulation of the active Cdc42 resulting in a pole is driven by a combination of activation-inactivation reactions and diffusion. It has been proposed using mathematical modelling that this is the result of diffusion-driven instability, originally proposed by Alan Turing. In this study, we developed, analysed and validated a 3D bulk-surface model of the dynamics of Cdc42. We show that the model can undergo both classic and non-classic Turing instability by deriving necessary conditions for which this occurs and conclude that the non-classic case can be viewed as a limit case of the classic case of diffusion-driven instability. Using three-dimensional Spatio-temporal simulation we predicted pole size and time to polarisation, suggesting that cell polarisation is mainly driven by the reaction strength parameter and that the size of the pole is determined by the relative diffusion.


Conflict of interest statement

The authors declare no competing interests.

Figures

Fig. 1
Fig. 1. The model of Cdc42-activation.
(a) The mechanism described as an expanded activator–inhibitor system. The GTPase Cdc42 is shuffled between its active state A (green) corresponding to the GTP-bound form and its inactive state I (orange) corresponding to the GDP-bound form. Also, the GDI-bound form G (blue) is restricted to the cytosol and is transported to the membrane which corresponds to the influx of inactive form I. The reaction mechanism is determined by three classes of reactions: (1) Flux of inactive Cdc42 over the membrane, (2) Activation and inactivation reactions restricted to the membrane determined by GEFs and GAPs respectively and (3) The positive feedback loop mediated by PAKs and Scaffolds also restricted to the membrane. (b) Geometric domain. By letting the membrane thickness shrink to zero, the geometric description is simplified to one domain Ω corresponding to the cytosol and one boundary Γ corresponding to the membrane. (c) Biological details of Cdc42 activation. Cdc42 has an inhibited GDI-bound form (blue), an inactive GDP-bound form (orange) and an active GTP-bound form (green). The shuffling between these forms is determined by the three regulators namely GDI, GEFs and GAPs. The active form of Cdc42, unlike the inactive, can bind to various effector molecules such as PAKs and Scaffolds which can further bind to GEFs which enhances the activation reaction through a positive feedback loop. This sub panel is re-drawn based on schematic representations in,.
Fig. 2
Fig. 2. The parameter space for classic and non-classic diffusion-driven instability.
The parameter space is divided into five regions indicated by the colour bar: Classic Turing instability with d = 30 (yellow), Classic Turing instability with d = 10 (light green), Classic Turing instability with d = 5 (green blue), Non-classic Turing instability (light blue) and No Symmetry Breaking (dark blue). (a) the (c−1, c2)—plane with a fixed value of c1 = 0.05. (b) the (c1, c2)—plane with a fixed value of c−1 = 0.05. The overall parameters in both cases are V0 = 6.0 and cmax=3.0 (note that the non-classic case is independent of d).
Fig. 3
Fig. 3. The time evolution of a pattern.
The time evolution of the concentration profiles for two sets of parameters corresponding to classic and non-classic, respectively. (a) Classic: The parameters are (c−1, c2) = (0.02, 0.45) where the time points, from left to right, are τ = 0, τ ≈ 2.75, τ ≈ 3.08, τ ≈ 3.48 and τ ≈ 4.45. The maximal and minimal concentration defining the bounds on the colour bar is given by (umin,umax)=(0.38,3.77) in the classic case. (b) Non-classic: The parameters are (c−1, c2) = (0.01, 0.20) where the time points, from left to right, are τ = 0, τ ≈ 1.43, τ ≈ 1.78, τ ≈ 2.47 and τ ≈ 4.59. The maximal and minimal concentration defining the bounds on the colour bar is given by (umin,umax)=(0.15,4.26) in the non-classic case. In both cases, the overall parameters are: c1 = 0.05, V0 = 6.0, cmax=3.0, a = 3, d = 10 and γ = 25.
Fig. 4
Fig. 4. Final patterns for increasing relative diffusion with a relative scale.
The final patterns for increasing relative diffusion d are displayed in two cases, namely classic and non-classic diffusion-driven instability. In both cases, the final time when the pattern is formed τfinal and the maximum and minimum concentrations of active Cdc42 umax and umin are calculated as functions of the kinetic rate parameters. (a) Classic: The overall parameters are (c1, c−1, c2) = (0.05, 0.04, 0.45) with specific parameters (from left to right): no pattern is formed for (d,τfinal,umax,umin)=(5,15,20.89,1.34,1.11), (d,τfinal,umax,umin)=(10,4.44,3.65,0.40), (d,τfinal,umax,umin)=(15,3.65,4.85,0.30), (d,τfinal,umax,umin)=(30,2.65,7.42,0.20) and (d,τfinal,umax,umin)=(50,2.17,9.83,0.15). (b) Non-classic: The overall parameters are (c1, c−1, c2) = (0.05, 0.03, 0.15) with specific parameters (from left to right): (d,τfinal,umax,umin)=(5,4.0,2.77,0.17), (d,τfinal,umax,umin)=(10,4.38,4.18,0.11), (d,τfinal,umax,umin)=(15,2.87,5.29,0.09), (d,τfinal,umax,umin)=(30,1.95,7.77,0.06) and (d,τfinal,umax,umin)=(50,1.96,10.166,0.04). In both cases, the overall parameters are: V0 = 6.0, cmax=3.0, a = 3 and γ = 25.
Fig. 5
Fig. 5. Quantitative measures as functions of an increasing relative diffusion d.
The figure illustrates how the relative diffusion d influences (a) the size of the pole, (b) the time to polarisation and (c) the maximal and minimal values of u on the cell membrane. Due to the randomness in the initial conditions, the simulations have been run multiple times. Each data point on the curves corresponds to 20 realisations where the 95% (upper dashed line), 50% (full line) and 5% (lower dashed line) quantiles are plotted for each case, i.e. Classic and Non-classic Turing instability.
Fig. 6
Fig. 6. Final patterns for increasing relative reaction strength.
The final patterns for increasing relative reaction strength γ are displayed in two cases, namely classic and non-classic diffusion-driven instability. In both cases, the maximum and minimum concentrations of active Cdc42 umax and umin are calculated as functions of the kinetic rate parameters. (a) Classic: The overall parameters are (c1, c−1, c2) = (0.05, 0.04, 0.45) with specific parameters (from left to right): (γ,τfinal,umax,umin)=(10,10.81,3.02,0.49), (γ,τfinal,umax,umin)=(20,5.06,3.62,0.40), (γ,τfinal,umax,umin)=(40,5.86,3.75,0.44), (γ,τfinal,umax,umin)=(80,4.63,3.80,0.40) and (γ,τfinal,umax,umin)=(160,8.92,3.74,0.40). (b) Non-classic: The overall parameters are (c1, c−1, c2) = (0.05, 0.03, 0.15) with specific parameters (from left to right): (γ,τfinal,umax,umin)=(10,4.66,3.96,0.15), (γ,τfinal,umax,umin)=(20,2.77,4.21,0.11), (γ,τfinal,umax,umin)=(40,4.41,4.00,0.11), (γ,τfinal,umax,umin)=(80,11.28,4.15,0.12) and (γ,τfinal,umax,umin)=(160,44,4.48,0.11). In both cases, the overall parameters are: V0 = 6.0, cmax=3.0, a = 3 and d = 10.
Fig. 7
Fig. 7. Quantitative measures as functions of increasing γ.
The figure illustrates how the relative reaction strength γ influences (a) the size of the pole, (b) the time to polarisation, (c) the maximal and minimal values of u on the cell membrane, as well as (d) the number of poles. Due to the randomness in the initial conditions, the simulations have been run multiple times. Each data point on the curves corresponds to 20 realisations where the 95% (upper dashed line), 50% (full line) and 5% (lower dashed line) quantiles are plotted for each case, i.e. Classic and Non-classic Turing instability.

Similar articles

Cited by

References

    1. Bi E, Park H-O. Cell polarization and cytokinesis in budding yeast. Genetics. 2012;191:347–387. doi: 10.1534/genetics.111.132886. - DOI - PMC - PubMed
    1. Lew DJ, Reed SI. Morphogenesis in the yeast cell cycle: regulation by cdc28 and cyclins. J. Cell Biol. 1993;120:1305–1320. doi: 10.1083/jcb.120.6.1305. - DOI - PMC - PubMed
    1. Johnson DI, Pringle JR. Molecular characterization of cdc42, a saccharomyces cerevisiae gene involved in the development of cell polarity. J. Cell Biol. 1990;111:143–152. doi: 10.1083/jcb.111.1.143. - DOI - PMC - PubMed
    1. Bradshaw, R. A. & Dennis, E. A. Handbook of Cell Signaling (Academic press, 2009).
    1. Chiou J-G, et al. Principles that govern competition or co-existence in rho-gtpase driven polarization. PLoS Comput. Biol. 2018;14:e1006095. doi: 10.1371/journal.pcbi.1006095. - DOI - PMC - PubMed

Publication types

Substances

LinkOut - more resources