. 2021 Feb 26;12(1):1334.
doi: 10.1038/s41467-021-21588-4.

Distinct genetic pathways define pre-malignant versus compensatory clonal hematopoiesis in Shwachman-Diamond syndrome

Affiliations

Distinct genetic pathways define pre-malignant versus compensatory clonal hematopoiesis in Shwachman-Diamond syndrome

Alyssa L Kennedy et al. Nat Commun. .

Abstract

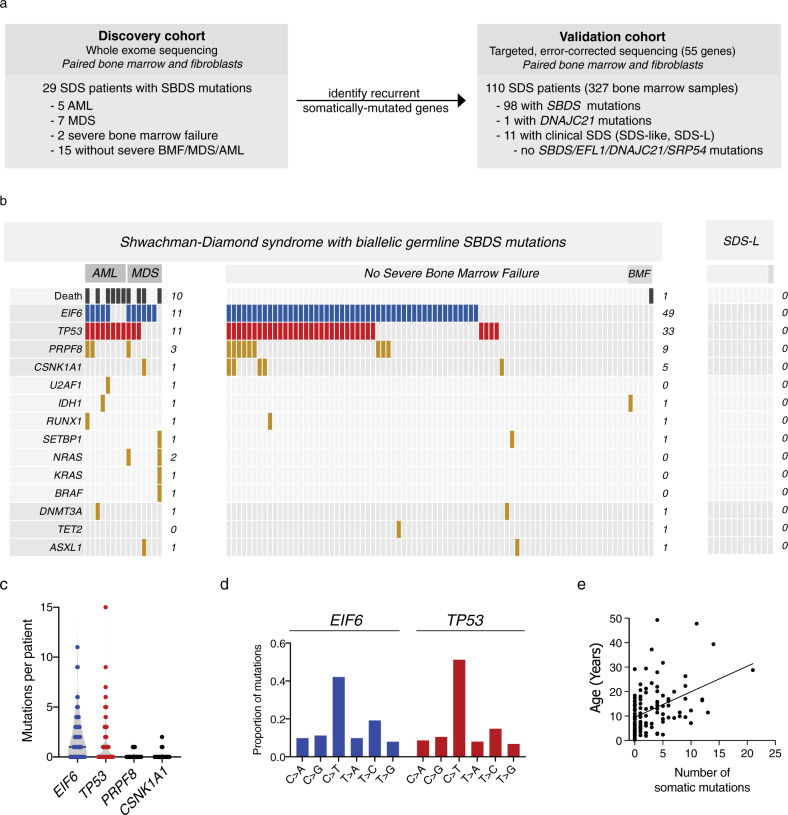
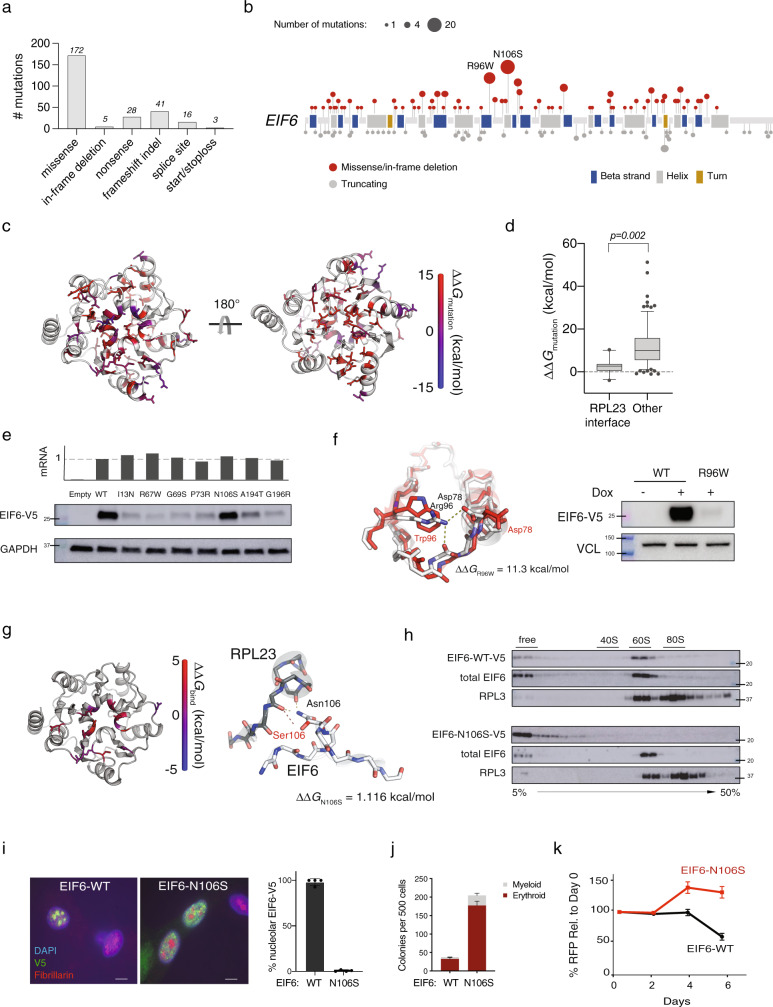
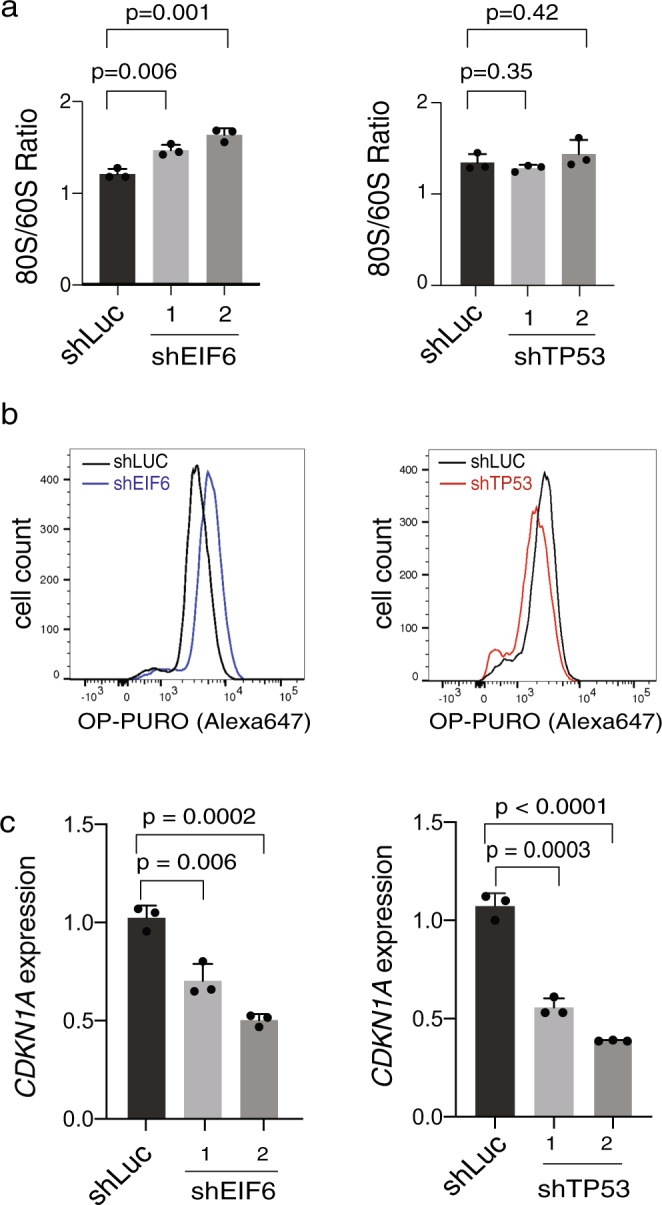
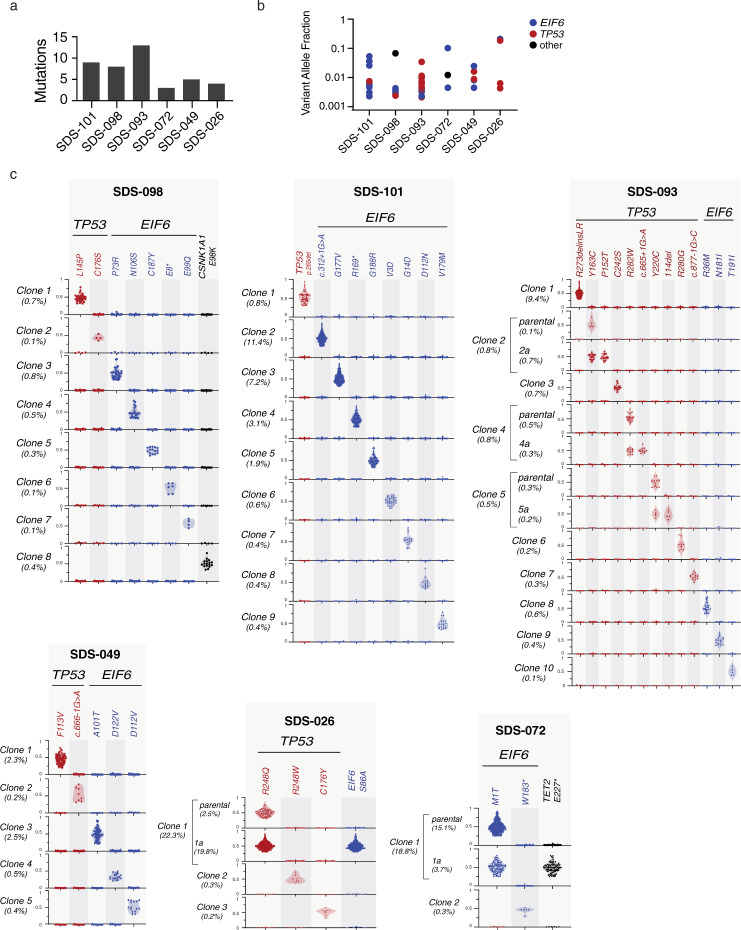
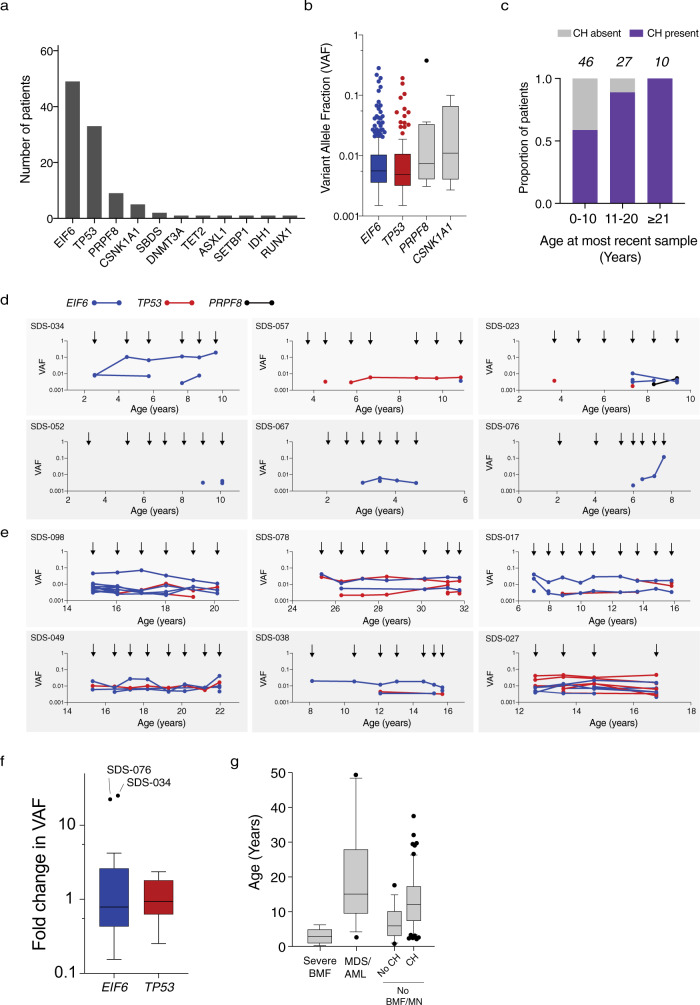
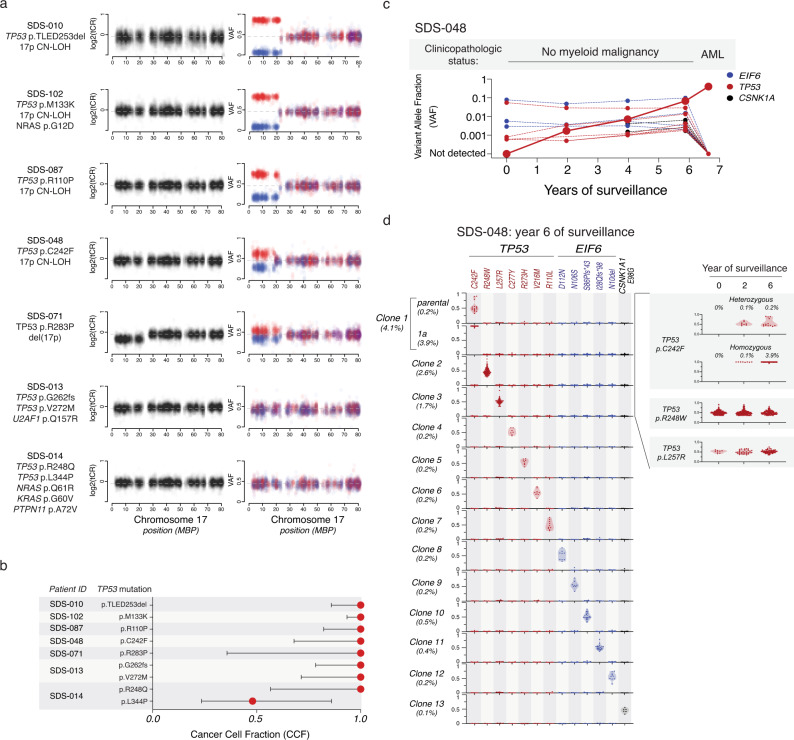
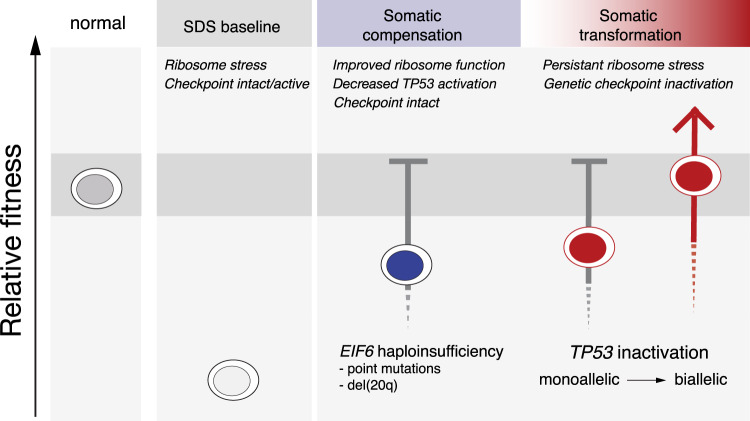
To understand the mechanisms that mediate germline genetic leukemia predisposition, we studied the inherited ribosomopathy Shwachman-Diamond syndrome (SDS), a bone marrow failure disorder with high risk of myeloid malignancies at an early age. To define the mechanistic basis of clonal hematopoiesis in SDS, we investigate somatic mutations acquired by patients with SDS followed longitudinally. Here we report that multiple independent somatic hematopoietic clones arise early in life, most commonly harboring heterozygous mutations in EIF6 or TP53. We show that germline SBDS deficiency establishes a fitness constraint that drives selection of somatic clones via two distinct mechanisms with different clinical consequences. EIF6 inactivation mediates a compensatory pathway with limited leukemic potential by ameliorating the underlying SDS ribosome defect and enhancing clone fitness. TP53 mutations define a maladaptive pathway with enhanced leukemic potential by inactivating tumor suppressor checkpoints without correcting the ribosome defect. Subsequent development of leukemia was associated with acquisition of biallelic TP53 alterations. These results mechanistically link leukemia predisposition to germline genetic constraints on cellular fitness, and provide a rational framework for clinical surveillance strategies.


Conflict of interest statement

J.R.E. is a part of the speakers’ Bureau: Jazz Pharmaceuticals; Astellas, Consultant: Jazz Pharmaceuticals. N.H. is a consultant for Novartis and Incyte. S.M.D. is a consultant for Alexion and Novartis. R.C.L. has received research funding from Jazz Pharmaceuticals, and consulting fees from Takeda Pharmaceuticals and bluebird bio. Other authors have no competing interests to declare.

Figures

Fig. 1
Fig. 1. Clinical factors associated with CH in SDS patients.
a Schema of genomic analysis. b A co-mutation plot showing somatic mutations in individual genes as labeled on the left. Mutations are depicted by colored bars and each column represents an individual patient in the indicated study cohort. The sum total of each event or mutation are tabulated to the right of each plot. c Number of mutations per patient in each of the four most frequently mutated genes:TP53, EIF6, PRPF8, and CSNK1A. d Base pair substitutions of somatic mutations in TP53 and EIF6. e Total number of somatic mutations by age in patients with biallelic germline SBDS mutations, based on targeted deep sequencing.
Fig. 2
Fig. 2. EIF6 somatic missense mutations alter EIF6 protein stability or function to improve cell fitness.
a Types of somatic EIF6 mutations. b Number and location of EIF6 mutations according to variant type. c Impact on the calculated energy of the folded state (ΔΔGmutation) of EIF6 missense mutations. Mutant residue colored according to ΔΔG value. d ΔΔGmutation of 12 EIF6 missense mutations located at the RPL23-binding interface versus 85 other EIF6 missense mutations located in the remainder of EIF6. Boxes center around the median and span the 25th and 75th percentiles, whiskers extend to the 10th and 90th percentiles. p value calculated using unpaired two tailed t-test. e Relative levels of EIF6 mRNA using a V5-specific qPCR primer (top panel) and V5 immunoblot from K562 cells 48 h after doxycycline treatment (bottom panel). Data shown is representative of three independent experiments. f Left panel: In silico modeling of EIF6-R96W. Right panel: V5 and VCL immunoblots of K562 cells with inducible EIF6-R96W versus V5-wild type EIF6 48 h after doxycycline treatment. Data shown is representative of three independent experiments. g Left panel: Change in the energy of binding (ΔΔGbind) of missense mutations at RPL23 interface. Mutant residues are colored according to ΔΔGbind. Right panel: In silico modeling of EIF6 N106S mutation. h V5, EIF6, and RPL3 immunoblots of sucrose gradient fractions from polysome profiles of doxycycline-treated K562 cells expressing V5-EIF6-WT or V5-EIF6-N106S. Data shown is representative of three independent experiments. i Immunofluorescence of V5-EIF-WT or V5-N106S-EIF6 protein in SDS patient-derived fibroblasts, V5 (green), fibrillarin (red), and DAPI (blue). Right panel: quantification of V5 nucleolar signal from four independent experiments. Error bars represent the mean ± standard deviation. Scale bar = 10 μm. j Quantification of colony forming units from sorted CD34+ transduced with shSBDS-GFP and either EIF6-WT-RFP or EIF6-N106S-RFP plated in triplicate. Data shown are representative of three independent experiments. Error bars represent the mean ± standard deviation. k Competitive growth of doxycycline inducible-shSBDS in K562 cells (Supplementary Fig. 3D) transduced with either EIF6-WT-RFP or EIF6-N106S-RFP after indicated time from doxycycline treatment (n = 3 technical replicates, representative of three biological replicates). Error bars represent mean ± standard deviation.
Fig. 3
Fig. 3. EIF6 and TP53 mutations attenuate p53 activation via different mechanisms.
a Quantification of 80S:60S ratio from polysome profiles in SDS patient-derived primary fibroblasts transduced with shRNAs targeting luciferase, EIF6 (left panel) or TP53 (right panel). b OP-Puro incorporation in primary SDS patient-derived fibroblasts transduced with shRNAs targeting luciferase, EIF6 (left panel) or TP53 (right panel). c Relative CDKN1A expression in SDS patient-derived fibroblasts transduced with either shLUC control or shEIF6 (left panel) and shTP53 (right panel). Error bars represent mean ± standard deviation of three technical replicates representative of two to three independent experiments. p value calculated using unpaired two-tailed t-test.
Fig. 4
Fig. 4. Independence of TP53 and EIF6 mutated clones in SDS patients.
a Number of somatic mutations detected in each patient by bulk DNA sequencing. b corresponding VAF of TP53 (red), EIF6 (blue) or other (black) mutation. c Clonal hierarchy of mutations determined by single cell sequencing amongst six patients with SDS. Each row represents a unique clone or subclone and the frequency of each clone is indicated to the left. Columns reflect the genotype status of each mutation in each clone, and all depicted clones have complete genotyping at all loci. The y-axis indicates single cell VAF from 0 to 1, where 0 is absent, 0.5 is heterozygous mutation, and 1 is homo/hemizygous. Each dot reflects a single cell, colored according to gene mutation, TP53 (red), EIF6 (blue), CSNK1A1 (black) and the frequency distribution of the data points reflected by shaded violin plots.
Fig. 5
Fig. 5. CH in SDS patients.
a Frequency of mutations in the indicated genes among the 58 SDS patients with CH. b VAFs in the indicated genes among 378 samples from SDS patients with clonal hematopoiesis. Horizontal lines within boxes indicate median VAF. Boxes center around the median and span the 25th and 75th percentiles with whiskers and outliers defined by the Tukey method. c Proportion of patients in the study cohort per decade of age with detectable CH, where CH was defined as the presence of a recurrent somatic clonal genetic alteration. d, e Shown is the VAF of each somatic EIF6 (blue), TP53 (red) or CSNK1A mutation (black) from d six patients who developed clonal hematopoiesis in the first decade of life and e six patients who were found to have clonal hematopoiesis in their second or third decade of life. Arrows indicate timing of sample acquisition. Points represent the VAF for detected mutations f, Fold change in VAF of all somatic EIF6 (blue) and TP53 (red) mutations from time of first detection to time of most recent detection in 23 patients with CH. Boxes center around the median and span 25th and 75th percentiles with whiskers and outliers defined by the Tukey method. g Ages of patients at diagnosis of six patients with severe bone marrow failure (BMF), 15 patients with myeloid neoplasm (MN), or no BMF/MDS with (59 patients) or without CH (19 patients) at last follow up. Boxes center around the median and span the 25th and 75th percentiles, whiskers extend to the 10th and 90th percentiles.
Fig. 6
Fig. 6. Biallelic TP53 inactivation and myeloid neoplasia in patients with SDS.
a Total copy ratio (tCR, denoted in black) and phased SNP-VAF (denoted in red/blue) across chromosome 17. b Cancer cell fraction of somatic TP53 mutations in seven patient samples analyzed in panel a. c Shown are the clinicopathologic status and VAF of somatic TP53 (red), EIF6 (blue), and CSNK1A (black) mutations from bulk sequencing of serial samples from SDS-048, a patient with SDS who progressed to AML. d Single cell sequencing demonstrating clonal hierarchy from SDS-048 during serial surveillance prior to development of AML. Each row represents a unique clone or subclone and the frequency of each clone is indicated to the left. Columns reflect the genotype status of each mutation in each clone, and all depicted clones have complete genotyping at all loci. Y-axis indicates single cell VAF from 0 to 1, where 0 is absent, 0.5 is heterozygous mutation, and 1 is homo/hemizygous. Each dot reflects a single cell, colored according to gene mutation, TP53 (red), EIF6 (blue), CSNK1A1 (black) and the frequency distribution of the data points reflected by shaded violin plots. Shown on the right is a time course indicating dynamics of the pre-leukemic p.C242F mutated clone and two independent TP53-mutated clones that did not transform.
Fig. 7
Fig. 7. TP53 and EIF6 mutations define distinct pathways of somatic clonal progression and distinguish leukemia predisposition in SDS.
Germline context drives separate compensatory and maladaptive somatic pathways of clonal evolution in patients with SDS. Germline SBDS mutations result in ribosomal stress which activate TP53 checkpoint pathways and promote bone marrow failure. EIF6 mutations alleviate the underlying ribosome maturation defects which reduces p53 checkpoint activation and improves cell fitness. TP53 mutations eliminate checkpoint pathways to improve relative fitness without improving the underlying ribosomal abnormalities, and promote the development of myeloid malignancies.

References

    1. Arber DA, et al. The 2016 revision to the World Health Organization classification of myeloid neoplasms and acute leukemia. Blood. 2016;127(20):2391–2405. Blood. 2016;128:462–463. - PubMed
    1. Nelson AS, Myers KC. Diagnosis, Treatment, and Molecular Pathology of Shwachman-Diamond Syndrome. Hematol. Oncol. Clin. North Am. 2018;32:687–700. doi: 10.1016/j.hoc.2018.04.006. - DOI - PubMed
    1. Dror Y, et al. Clonal evolution in marrows of patients with Shwachman-Diamond syndrome: a prospective 5-year follow-up study. Exp. Hematol. 2002;30:659–669. doi: 10.1016/S0301-472X(02)00815-9. - DOI - PubMed
    1. Donadieu J, et al. Classification of and risk factors for hematologic complications in a French national cohort of 102 patients with Shwachman-Diamond syndrome. Haematologica. 2012;97:1312–1319. doi: 10.3324/haematol.2011.057489. - DOI - PMC - PubMed
    1. Boocock GRB, et al. Mutations in SBDS are associated with Shwachman–Diamond syndrome. Nat. Genet. 2003;33:97–101. doi: 10.1038/ng1062. - DOI - PubMed

Publication types

MeSH terms

Substances