. 2021 Feb 26;12(1):1294.
doi: 10.1038/s41467-021-21621-6.

Maintenance of type 2 glycolytic myofibers with age by Mib1-Actn3 axis

Affiliations

Maintenance of type 2 glycolytic myofibers with age by Mib1-Actn3 axis

Ji-Yun Seo et al. Nat Commun. .

Abstract

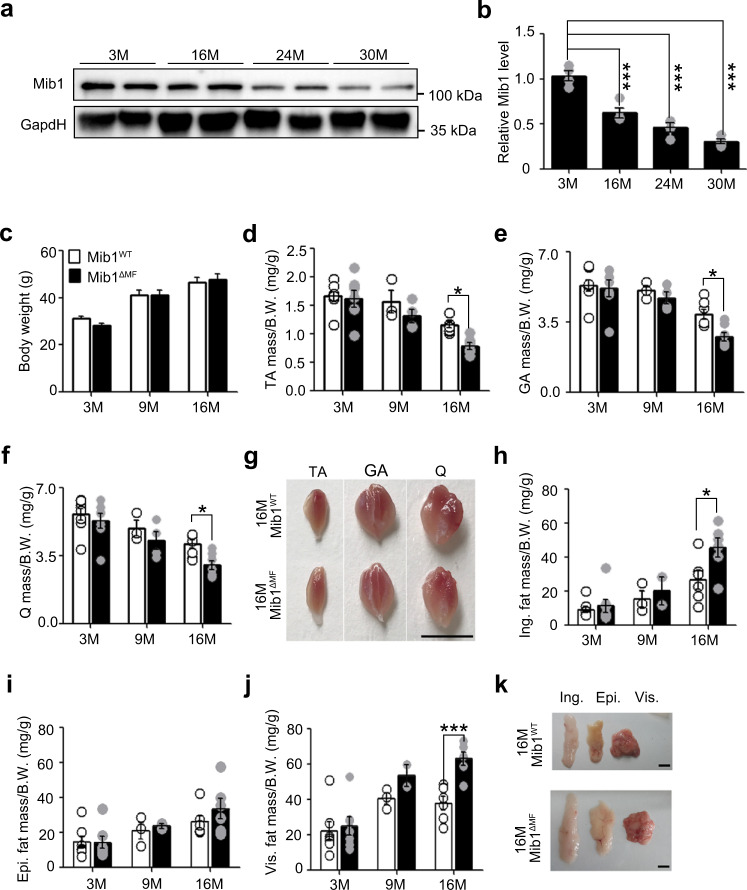
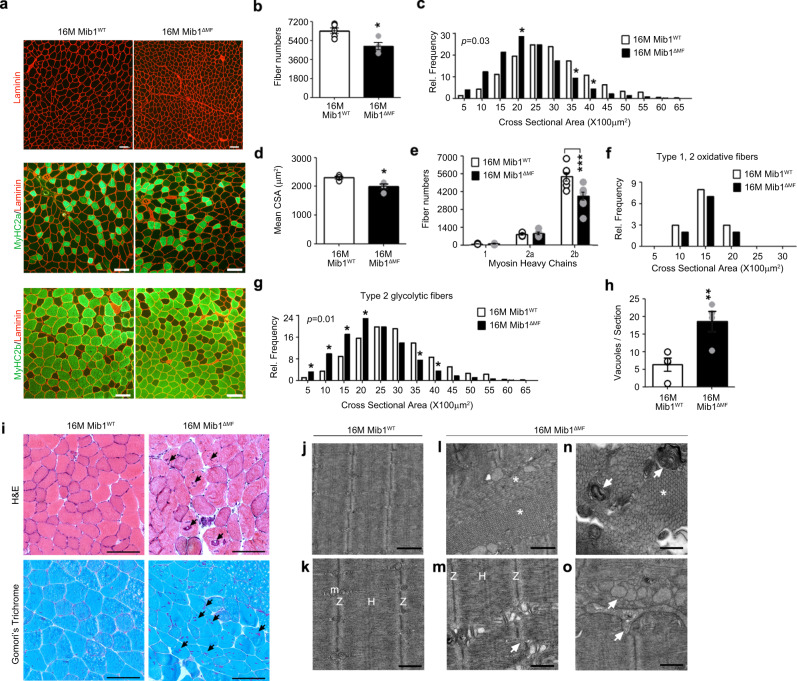
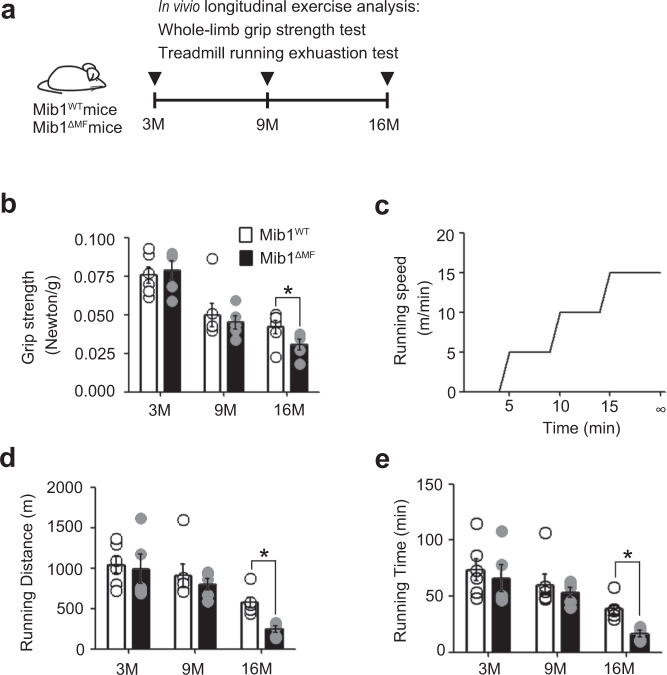
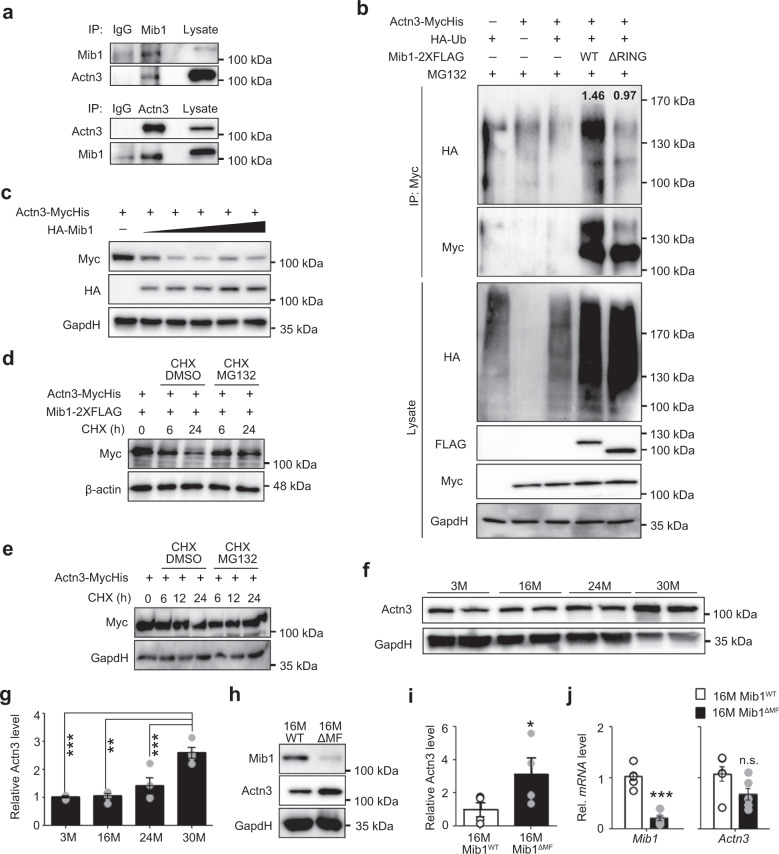
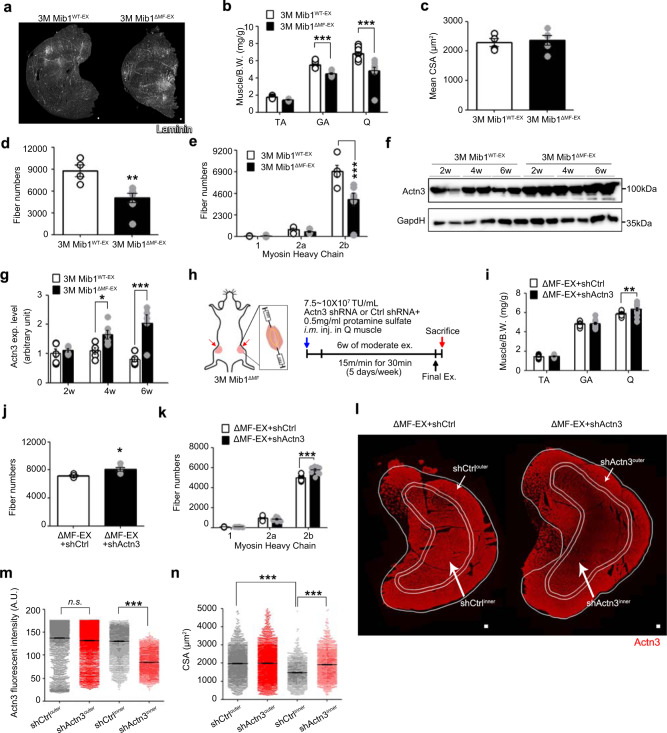
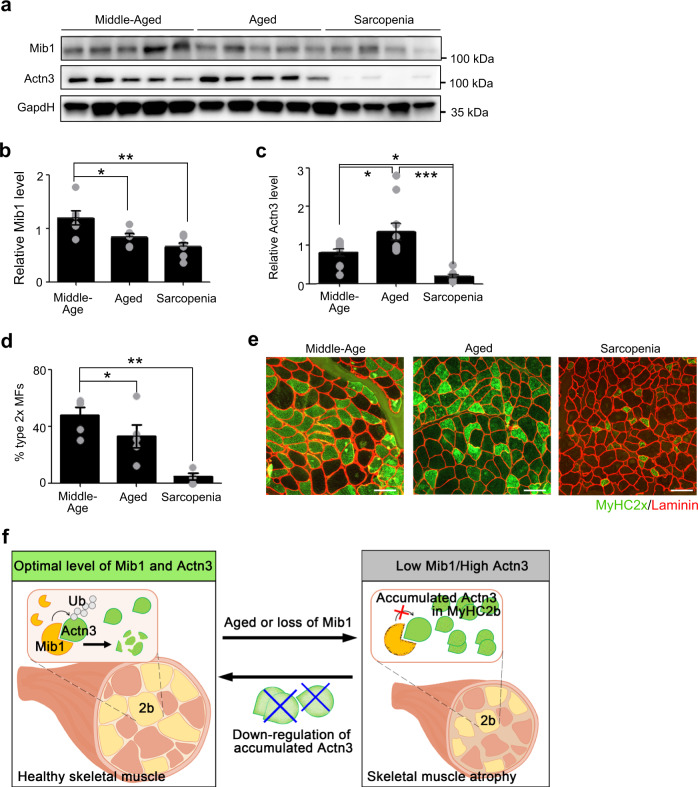
Age-associated muscle atrophy is a debilitating condition associated with loss of muscle mass and function with age that contributes to limitation of mobility and locomotion. However, the underlying mechanisms of how intrinsic muscle changes with age are largely unknown. Here we report that, with age, Mind bomb-1 (Mib1) plays important role in skeletal muscle maintenance via proteasomal degradation-dependent regulation of α-actinin 3 (Actn3). The disruption of Mib1 in myofibers (Mib1ΔMF) results in alteration of type 2 glycolytic myofibers, muscle atrophy, impaired muscle function, and Actn3 accumulation. After chronic exercise, Mib1ΔMF mice show muscle atrophy even at young age. However, when Actn3 level is downregulated, chronic exercise-induced muscle atrophy is ameliorated. Importantly, the Mib1 and Actn3 levels show clinical relevance in human skeletal muscles accompanied by decrease in skeletal muscle function with age. Together, these findings reveal the significance of the Mib1-Actn3 axis in skeletal muscle maintenance with age and suggest the therapeutic potential for the treatment or amelioration of age-related muscle atrophy.


Conflict of interest statement

The authors declare no competing interests.

Figures

Fig. 1
Fig. 1. Age-associated muscle atrophy in Mib1ΔMF mice.
a, b Immunoblotting (IB) of Mindbomb-1 (Mib1) from wild-type (WT) gastrocnemius (GA) muscles at indicated ages (a) and quantification of western blot analysis (b). The intensity of Mib1 expression at indicated ages (M; month) was quantified by densitometry. cf Body weights (c) and relative tibialis anterior (TA) (d), GA (e), and quadricep (Q) (f) muscle masses to body weights of Mib1f/f (Mib1WT) and MCK-Cre;Mib1f/f (Mib1ΔMF) at indicated ages. g Gross morphology of hindlimb muscles (TA, GA, and Q muscles) from 16-month-old Mib1WT and Mib1ΔMF mice. Scale bars, 0.5 cm. hj Inguinal (Ing) fat (h), epididymal (Epi) fat (i), and visceral (Vis) fat (j) masses to body weights of Mib1WT and Mib1ΔMF at indicated ages. k Gross morphology of fat (Ing, Epi, and Vis fats) from 16-month-old Mib1WT and Mib1ΔMF mice. Scale bars, 1 cm. Data are presented as means ± s.e.m. Data are shown as representatives of at least three independent experiments. n = 4 (b), n = 11, 18, and 17 for 3-, 9-, and 16-month-old Mib1WT mice and 16, 18, and 16 for 3-, 9-, and 16-month-old Mib1 ΔMF mice, respectively (c); n = 8, 3, and 7 for 3-, 9-, and 16-month-old Mib1WT mice and 7 for 3-, 9-, and 16-month-old Mib1 ΔMF mice, respectively (df, hj); n = 7, 3, and 6 for 3-, 9-, and 16-month-old Mib1WT mice and n = 7, 4, and 6 for 3-, 9-, and 16-month-old Mib1 ΔMF mice, respectively (df, hj). One-way ANOVA for (b). Two-way ANOVA for (cf, hj). *P < 0.05; ***p < 0.001.
Fig. 2
Fig. 2. Selective alteration of type 2 glycolytic myofiber and abnormal skeletal muscle characteristics in Mib1ΔMF mice.
Cross-sections of 16-month-old Mib1WT and Mib1ΔMF hindlimb muscles (TA (a, c, d, f, g) and GA (b, e) muscles) were subjected to immunohistochemistry (IHC) staining and analyzed. a Representative images of IHC staining for MyHC2a (green; type 2 oxidative myofibers), MyHC2b (green; type 2 glycolytic myofibers), and laminin (red). b Quantification of whole myofiber numbers (p = 0.014). c, d Morphometric quantification of cross-sectional area (CSA) (c) and mean CSA (d) of whole myofibers (p = 0.0214 for d). e Quantification of myofiber numbers by fiber types. MyHC1 (type 1 oxidative myofibers), MyHC2a, MyHC2b indicate type 1, type 2 oxidative (2a), and type 2 glycolytic (2b) myofibers, respectively. f, g Morphometric quantification of CSA of type 1 and 2 oxidative myofibers (f) and type 2 glycolytic myofibers (g). h, i Hematoxylin and eosin (upper panel) and Gomori’s trichrome (lower panel) of GA muscles (i) and quantification of vacuoles per sections (h) (p = 0.0058 for h). Arrows indicate vacuoles. jo Ultrastructural analysis of Q muscles of 16-month-old Mib1WT (j, k) and Mib1ΔMF (lo). m, Z, and H indicate mitochondria, Z-disk, and H-band, respectively. Arrows indicate Z-disk misalignment for m, abnormal membrane structure for n, and irregularly shaped and dilated sarcoplasmic reticulum (SR) tubules for o. Asterisk mark indicates accumulation of tubular aggregation (l, n). j, l Low; k, mo, high magnification. Scale bars, 100 μm (a, i), 1 μm (j, l), and 500 nm (k, mo). Data are presented as means ± s.e.m. Data shown are representatives of at least three independent experiments. n = 5 and 4 for Mib1WT and Mib1ΔMF mice (b); n = 5 (cg), n = 54, 48, 43, and 68 sections for four mice for Mib1WT mice and 59, 42, 37, and 62 sections for four mice for Mib1ΔMF mice (h), and n = 4 and 6 for Mib1WT and Mib1ΔMF mice (il), respectively. χ2 test for trends for (c, g). Two-tailed Student’s t test for (b, d, h). Two-way ANOVA for (e, f). *P < 0.05; **p < 0.01; ***p < 0.001.
Fig. 3
Fig. 3. Age-associated impaired muscle function in Mib1ΔMF mice.
a To track changes in skeletal muscle function with age, the longitudinal in vivo muscle function analysis was performed. Mib1WT and Mib1ΔMF mice were subjected to exercise analysis (whole-limb grip strength test and treadmill running exhaustion test) at 3, 9, and 16 months. b Whole-limb grip strength at indicated ages. c Scheme of treadmill running. d, e Running distance (d) and time (e) to exhaustion at indicated ages. Data are presented as means ± s.e.m. Data are shown as representatives of at least three independent experiments. n = 6 and 5 for Mib1WT and Mib1ΔMF mice, respectively (b, d, e). Two-way ANOVA for (b, d, e). *p < 0.05.
Fig. 4
Fig. 4. Regulation of Actn3 via Mib1-mediated proteasomal degradation pathway in skeletal muscles.
a Endogenous interaction of Mib1 and α-Actn3 (Actn3) in GA muscle lysates. GA muscle lysates from 3-month-old WT mice were subjected to endogenous IP using anti-Mib1 and Actn3 antibody. Mouse and rabbit IgG were used as a nonspecific control. b IB analysis of ubiquitination and proteasomal degradation of Actn3 in 293T cells. The 293T cells were transfected with indicated plasmids and treated with 10 μM MG-132 for 6 h. Whole lysates were subjected to IP using anti-Myc, followed by IB analysis. The intensities of HA (Ub) protein of lanes 4 and 5 were 1.46 ± 0.12 and 0.97 ± 0.07, respectively (p = 0.03). c IB analysis of Mib1-dependent Actn3 protein levels. The 293T cells were transfected with 4 μg of MycHis-tagged Actn3 and 0.5, 2, 4, 8, and 16 μg of HA-tagged Mib1. d, e IB analysis of Actn3 protein degradation in 293T cells with (d) or without (e) Mib1-2× FLAG. 293T cells were transfected with MycHis-tagged Actn3 and/or HA-tagged Mib1 followed by treatment with cycloheximide (CHX) and MG-132 or 0.1% DMSO for the indicated times. f, g IB analysis (f) and the intensity (g) of Actn3 expression in GA muscles of WT mice with indicated ages. h, i IB analysis (h) and the intensity (i) of Mib1 and Actn3 expression in GA muscles of 16-month-old Mib1WT and Mib1ΔMF mice (p = 0.019 for i). j Mib1 and Actn3 mRNA levels in GA muscles (p = 2.06E−05 for Mib1 and 0.0519 for Actn3). The intensity of protein expression of IB was quantified by densitometry. Data are shown as representatives of at least three independent experiments. Data are presented as means ± s.e.m. n = 4 (f, g), n = 6 (hj) mice per genotypes. One-way ANOVA for (g). Two-tailed Student’s t test for (i, j). *P < 0.05; **p < 0.01; ***p < 0.001; n.s. not significant.
Fig. 5
Fig. 5. Induction or amelioration of chronic exercise-induced muscle atrophy of young Mib1ΔMF mice.
a Representative images of IHC staining for laminin (white). b Relative hindlimb muscles to body weights. c Mean CSA of Q muscles. d, e Quantification of whole myofiber numbers (d) and myofiber numbers by fiber types (e) (p = 0.0063 for d). f, g IB analysis of Actn3 from insoluble muscle lysates from GA muscles of exercised Mib1WT (Mib1WT-EX) and exercised Mib1ΔMF (Mib1ΔMF-EX) mice (f) and intensity of Actn3 (g) at indicated times. h Three-month-old Mib1ΔMF were i.m. injected with lentiviral shRNAs targeting control shRNA (shCtrl, hereafter ΔMF-EX + shCtrl) or Actn3 (shActn3, hereafter ΔMF-EX + shActn3) to both sides of Q muscles. The local injection of shRNA into Q muscle is shown in yellow dotted line. A week later, mice were subjected to chronic exercise. i Relative hindlimb muscles to body weights. j, k Quantification of whole myofiber numbers (j) and myofiber numbers by fiber types (k) (p = 0.0039 for j). l Representative images of IHC staining for Actn3. The IHC images were taken simultaneously with the same light setting, exposure time, and magnification. Actn3 intensity within shActn3-injected Q muscle was divided into high (outer part; area between single and double line) and low (inner part; surrounded by double line). Corresponding outer and inner parts were shown in shCtrl-injected Q muscles. m Actn3 fluorescent intensity of outer and inner part of ΔMF-EX + shCtrl and ΔMF-EX + shActn3. Note that Actn3 intensity of inner part of ΔMF-EX + shActn3 (ΔMF-EX + shActn3inner) is significantly lower than corresponding inner part of ΔMF-EX + shCtrl (ΔMF-EX + shCtrlinner). n CSA of outer and inner part of ΔMF-EX + shCtrl and ΔMF-EX + shActn3. Note that mean CSA of shActn3inner is larger than corresponding part of shCtrlinner. Please note that CSA of outer part of skeletal muscle is generally larger than inner part. Scale bars, 100 μm (a) and 125 μm (l). The intensity of protein expression of IB was quantified by densitometry. Data are presented as means ± s.e.m. Data are shown as representatives of at least three independent experiments. n = 6 and 5 for Mib1WT and Mib1ΔMF mice, respectively (b). n = 4 and 5 for Mib1WT and Mib1ΔMF mice, respectively (c, d, e, g, j). n = 8 and 7 for Mib1WT and Mib1ΔMF mice, respectively (i, k). n = 3169, 3749, 2662, and 2827 myofibers for shCtrlouter, shActn3outer, shCtrlinner, and shActn3inner, respectively (m). n = 2218, 2624, 1597, and 1696 myofibers for shCtrlouter, shActn3outer, shCtrlinner, and shActn3inner, respectively (n). One-way ANOVA for (m, n). Two-way ANOVA for (b, e, g, i, k). Two-tailed Student’s t test for (c, d, j). *P < 0.05; **p < 0.01; ***p < 0.001.
Fig. 6
Fig. 6. Disturbed Mib1–Actn3 axis in human skeletal muscle with age.
ac IB analysis (a) of Mib1 and Actn3 in vastus lateralis muscles of middle-aged (<60 years), aged (>60 years), and sarcopenia (>60 years and meet AGWS criteria), and quantification of Mib1 (b) and Actn3 (c). Please see Supplementary Fig. 7a for flow chart of selection of human subjects. The intensity of Mib1 and Actn3 expression at indicated group was quantified by densitometry. d, e Quantification of the percentage of type 2× glycolytic myofibers (d) and e representative images of IHC staining for MyHC2x (green; type 2× glycolytic myofibers) and laminin (red). Scale bars, 100 μm (e). Data are presented as means ± s.e.m. Data are shown as representatives of at least three independent experiments. n = 6 for middle-aged and aged group, and 8 for sarcopenic group (ac). n = 5 for the middle-aged and aged group, and 4 for sarcopenic group (d). One-way ANOVA for (bd). *P < 0.05; **p < 0.01; ***p < 0.001. f A proposed model. In healthy myofibers, Mib1 regulates Actn3, a Z-disk protein highly expressed in type 2 glycolytic myofibers, in a proteasome-dependent manner to maintain the optimal levels of Actn3. However, the age-associated changes in or loss of Mib1 in myofibers lead to the accumulation of Actn3 accompanied by the alteration of type 2 glycolytic myofibers, muscle atrophy, impaired muscle function, and, consequently, an acceleration of age-associated muscle atrophy. When the excessive accumulation of Actn3 is alleviated by the downregulation of Actn3 in myofibers, the muscle atrophy is ameliorated, suggesting that Actn3 can be a promising therapeutic target of age-associated muscle atrophy.

Similar articles

Cited by

References

    1. Cesari M, Landi F, Vellas B, Bernabei R, Marzetti E. Sarcopenia and physical frailty: two sides of the same coin. Front. Aging Neurosci. 2014;6:192. - PMC - PubMed
    1. Cruz-Jentoft AJ, Sayer AA. Sarcopenia. Lancet. 2019;393:2636–2646. doi: 10.1016/S0140-6736(19)31138-9. - DOI - PubMed
    1. Demontis F, Piccirillo R, Goldberg AL, Perrimon N. Mechanisms of skeletal muscle aging: insights from Drosophila and mammalian models. Dis. Model. Mech. 2013;6:1339–1352. doi: 10.1242/dmm.012559. - DOI - PMC - PubMed
    1. Fernando R, Drescher C, Nowotny K, Grune T, Castro JP. Impaired proteostasis during skeletal muscle aging. Free Radic. Biol. Med. 2019;132:58–66. doi: 10.1016/j.freeradbiomed.2018.08.037. - DOI - PubMed
    1. Batonnet-Pichon S, et al. Myofibrillar myopathies: new perspectives from animal models to potential therapeutic approaches. J. Neuromuscul. Dis. 2017;4:1–15. doi: 10.3233/JND-160203. - DOI - PMC - PubMed

Publication types