. 2021 Feb 26;11(1):4788.
doi: 10.1038/s41598-021-83525-1.

A plant plasma-membrane H+-ATPase promotes yeast TORC1 activation via its carboxy-terminal tail

Affiliations

A plant plasma-membrane H+-ATPase promotes yeast TORC1 activation via its carboxy-terminal tail

Elie Saliba et al. Sci Rep. .

Abstract

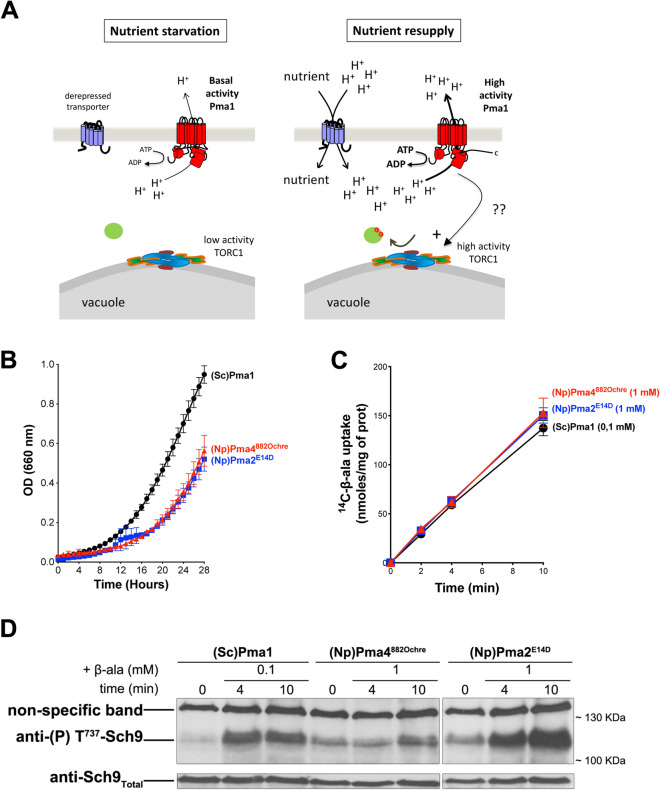
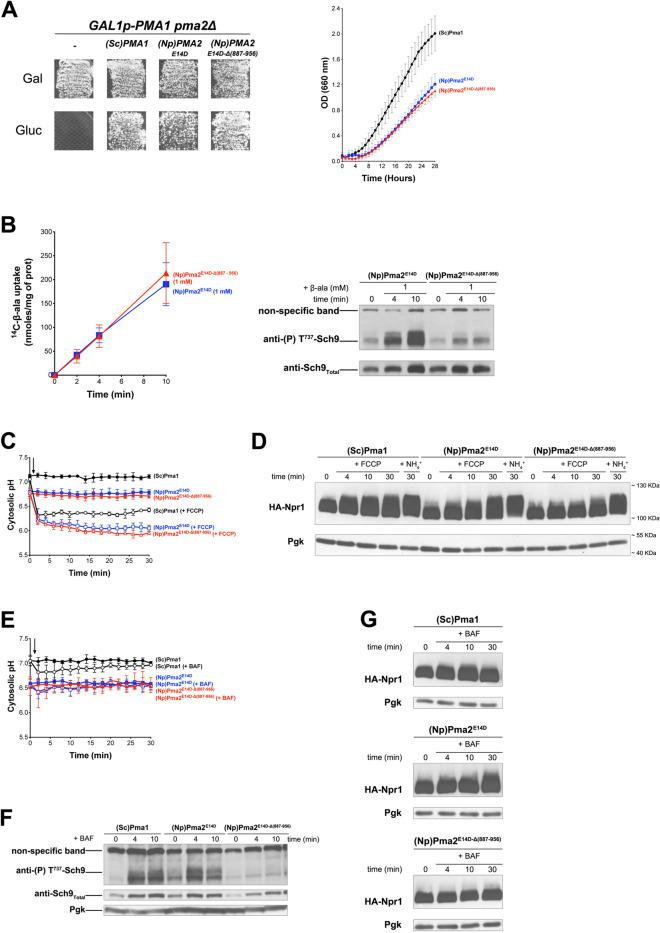
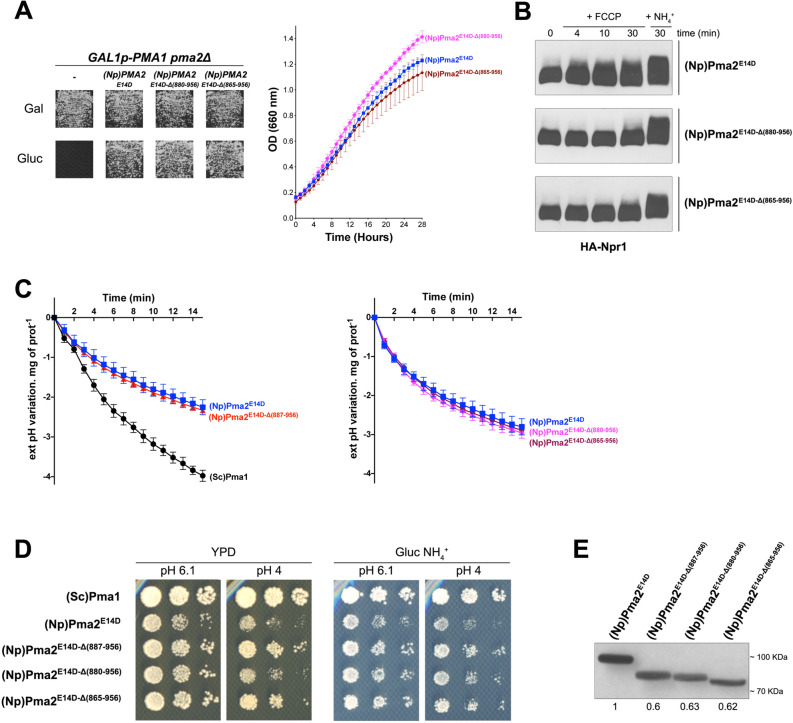
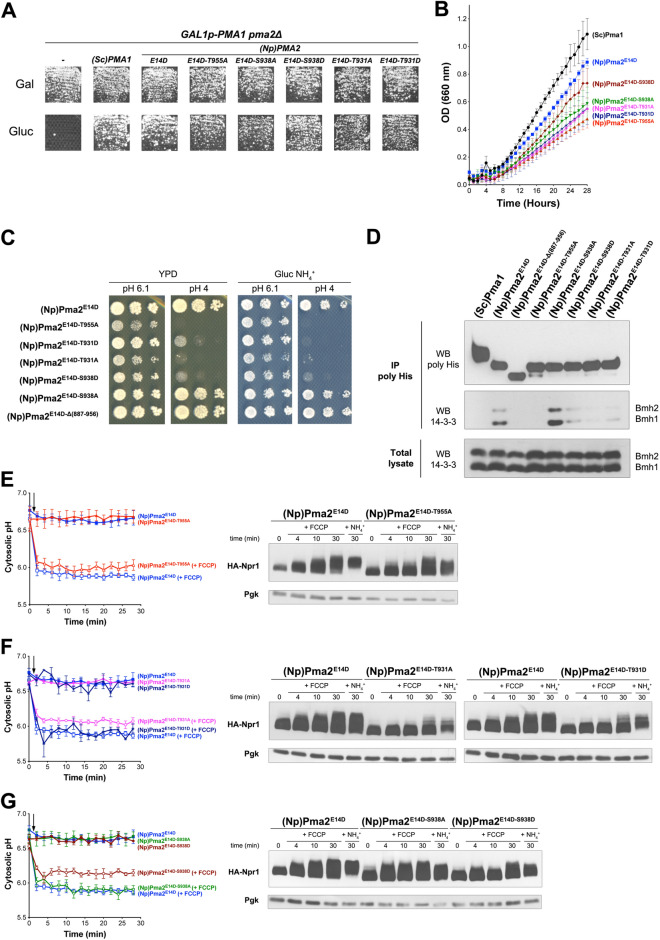
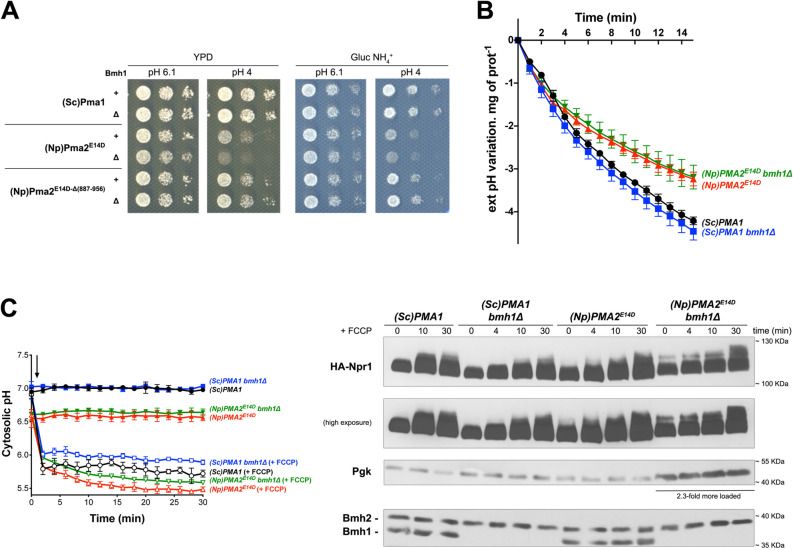
The Target of Rapamycin Complex 1 (TORC1) involved in coordination of cell growth and metabolism is highly conserved among eukaryotes. Yet the signals and mechanisms controlling its activity differ among taxa, according to their biological specificities. A common feature of fungal and plant cells, distinguishing them from animal cells, is that their plasma membrane contains a highly abundant H+-ATPase which establishes an electrochemical H+ gradient driving active nutrient transport. We have previously reported that in yeast, nutrient-uptake-coupled H+ influx elicits transient TORC1 activation and that the plasma-membrane H+-ATPase Pma1 plays an important role in this activation, involving more than just establishment of the H+ gradient. We show here that the PMA2 H+-ATPase from the plant Nicotiana plumbaginifolia can substitute for Pma1 in yeast, to promote H+-elicited TORC1 activation. This H+-ATPase is highly similar to Pma1 but has a longer carboxy-terminal tail binding 14-3-3 proteins. We report that a C-terminally truncated PMA2, which remains fully active, fails to promote H+-elicited TORC1 activation. Activation is also impaired when binding of PMA2 to 14-3-3 s is hindered. Our results show that at least some plant plasma-membrane H+-ATPases share with yeast Pma1 the ability to promote TORC1 activation in yeast upon H+-coupled nutrient uptake.


Conflict of interest statement

The authors declare no competing interests.

Figures

Figure 1
Figure 1
The plant H+-ATPase PMA2 promotes TORC1 activation in yeast. (A) Model of TORC1 activation upon H+ influx. Left. In cells starved of a specific nutrient, TORC1 activity is low and typically, a high-affinity H+ symporter of the limiting nutrient is strongly derepressed (e.g. Gap1, Pho84, or Sul1 in cells starved of nitrogen, phosphate, or sulfur, respectively). In these cells, the plasma-membrane Pma1 H+-ATPase displays basal activity. Right. When cells are resupplied with the limiting nutrient, a strong nutrient-uptake-coupled influx of H+ occurs. This rapidly stimulates the activity of Pma1, which extrudes excess H+. In this high-activity state, Pma1 also plays an active role in transient re-activation of TORC1, possibly via signaling. (B) GAL1p-PMA1 pma2Δ cells expressing, from two plasmids, either (Sc)Pma1, (Np)PMA4882Ochre, or (Np)PMA2E14D along with HA-NPR1, were grown on Gluc NH4+ medium in a microplate reader for 28 h. Data points represent averages of the OD at 660 nm of two biological replicates; error bars represent SD. (C) Strains as in B were grown on Gluc NH4+ medium. After a shift to Gluc proline medium for four hours, [14C]-β-alanine (0.1 or 1 mM) was added to the medium before measuring the incorporated radioactivity at various times. Average values of three biological replicates are shown, and error bars correspond to SD. (D) Strains and growth conditions as in C. Cells were collected before and 4 and 10 min after addition of β-alanine (0.1 or 1 mM). Crude extracts were prepared and immunoblotted with anti-(P) T737-Sch9 and anti-Sch9Total antibodies. The detected signals are from the same gel and exposure times were identical. Two parts of the gel were grouped for presentation convenience. The original blot is presented in Fig. S3.
Figure 2
Figure 2
The carboxy-terminal tail of plant PMA2 is required for TORC1 activation in yeast. (A) Left. GAL1p-PMA1 pma2Δ cells transformed with a plasmid expressing (Sc)PMA1, (Np)PMA2E14D, (Np)PMA2E14D-Δ(887-956), or no H+-ATPase (−) were grown for three days on solid medium with NH4+ as nitrogen source and Gal or Gluc as carbon source. Right. GAL1p-PMA1 pma2Δ cells expressing from plasmids either (Sc)Pma1, (Np)PMA2E14D, or (Np)PMA2E14D-Δ(887-956) along with HA-NPR1 were grown on Gluc NH4+ medium in a microplate reader for 28 h. Data points represent averages of the OD at 660 nm of three biological replicates; error bars represent SD. (B) Left. GAL1p-PMA1 pma2Δ cells expressing from plasmids (Np)PMA2E14D or (Np)PMA2E14D-Δ(887-956) along with HA-NPR1, were grown on Gluc NH4+ medium. After a shift to Gluc proline medium for four hours, [14C]-β-alanine (1 mM) was added to the medium before measuring the incorporated radioactivity at various times. Average values of three biological replicates are shown, and error bars correspond to SD. Right. Strains and growth conditions as in the left panel. Cells were collected before and 4 and 10 min after addition of β-alanine (1 mM). Crude extracts were prepared and immunoblotted with anti-(P) T737-Sch9 and anti-Sch9Total antibodies. (C) GAL1p-PMA1 pma2Δ cells expressing, from plasmids, either (Sc)Pma1, (Np)PMA2E14D, or (Np)PMA2E14D-Δ(887-956) along with pHluorin were grown on Gluc NH4+ medium. After a shift to Gluc proline medium for 4 h, the cytosolic pH was measured at various times during growth with (open symbols) or without (filled symbols) addition of FCCP (20 µM) starting at 1 min (indicated by an arrow on the graph). Average values of three biological replicates are shown, and error bars correspond to SD. (D) GAL1p-PMA1 pma2Δ cells expressing, from plasmids, either (Sc)Pma1, (Np)PMA2E14D, or (Np)PMA2E14D-Δ(887-956) along with HA-Npr1 were grown on Gluc NH4+ medium. After a shift to Gluc proline medium for four hours, cells were collected before and 4, 10, and 30 min after addition of FCCP (20 µM) or 30 min after addition of NH4+ (5 mM). Crude extracts were prepared and immunoblotted with anti-HA and anti-Pgk antibodies. (E) Strains and growth conditions as in D, except that cells were treated (open symbols) or not (filled symbols) with bafilomycin A (BAF) (1 µM). (F) Cell extracts analyzed in G (only those collected at 4 and 10 min) were migrated in a separate gel and immunoblotted with anti-(P) T737-Sch9, anti-Sch9Total and anti-Pgk antibodies. (G) Same strains and growth conditions as in D, except that cells were treated with bafilomycin A (BAF) (1 µM). The detected signals are from the same gel and exposure times were identical. Strains are presented in separate panels for convenience. Original blots of figure panels B, D, F and G are presented in Fig. S3.
Figure 3
Figure 3
The inability of C-terminally truncated PMA2 forms to activate TORC1 is not associated with reduced H+ pumping activity. (A) Left. GAL1p-PMA1 pma2Δ cells expressing, from a plasmid, either (Np)PMA2E14D, (Np)PMA2E14D-Δ(880-956), (Np)PMA2E14D-Δ(865-956), or no H+-ATPase (-) were grown for 3 days on solid medium with NH4+ as sole nitrogen source and Gal or Gluc as carbon source. Right. GAL1p-PMA1 pma2Δ cells expressing, from plasmids, either (Np)PMA2E14D, (Np)PMA2E14D-Δ(880-956), or (Np)PMA2E14D-Δ(865-956) along with HA-NPR1 were grown on Gluc NH4+ medium in a microplate reader for 28 h. Data points represent averages of the OD at 660 nm of two biological replicates; error bars represent SD. (B) The same cells as in panel A (right) were grown on Gluc NH4+ medium. After a shift to Gluc proline medium for four hours, culture samples were collected before and 4, 10, and 30 min after addition of FCCP (20 µM) or 30 min after addition of NH4+ (5 mM). Crude extracts were prepared and immunoblotted with the anti-HA antibody. The signals are from the same gel and exposure times were identical. Strains are presented in separate panels for convenience. (C) Left. GAL1p-PMA1 pma2Δ cells expressing, from plasmids, either (Sc)Pma1, (Np)PMA2E14D, or (Np)PMA2E14D-Δ(887-956) along with HA-NPR1 were grown on Gluc NH4+ medium. Acidification by these cells of the external medium was measured as described in Materials and Methods. Right. Same as in the left panel, except that cells expressing (Np)PMA2E14D, (Np)PMA2E14D-Δ(880-956), or (Np)PMA2E14D-Δ(865-956) were analyzed. Average values of three biological replicates are shown, and error bars correspond to SD. (D) GAL1p-PMA1 pma2Δ cells expressing, from plasmids, either (Sc)Pma1, (Np)PMA2E14D, (Np)PMA2E14D-Δ(887-956), (Np)PMA2E14D-Δ(880-956), or (Np)PMA2E14D-Δ(865-956) along with HA-NPR1 were spotted in two-fold serial dilutions on solid rich (YPD) or Gluc NH4+ (pH 6.1 or 4) medium and incubated for four days. (E) GAL1p-PMA1 pma2Δ cells expressing, from plasmids, either (Np)PMA2E14D, (Np)PMA2E14D-Δ(887-956), (Np)PMA2E14D-Δ(880-956) or (Np)PMA2E14D-Δ(865-956) along with HA-NPR1 were grown on Gluc NH4+ medium. After a shift to Gluc proline medium for four hours, the cells were collected. Crude extracts were prepared and immunoblotted with the anti-polyHis antibody. Direct Blue 71 staining (Sigma-Aldrich) was used for quantitative comparisons and signals were normalized to the signal of (Np)PMA2E14D-expressing cells. Original blots of figure panels B and E are presented in Fig. S3.
Figure 4
Figure 4
Yeast TORC1 activation via the plant H+-ATPase PMA2 requires association of its carboxy-terminal tail with 14-3-3 proteins. (A) GAL1p-PMA1 pma2Δ cells transformed with plasmids expressing (Sc)PMA1, (Np)PMA2E14D, (Np)PMA2E14D-T955A, (Np)PMA2E14D-S938A, (Np)PMA2E14D-S938D, (Np)PMA2E14D-T931A, (Np)PMA2E14D-T931D, or no H+-ATPase (-) were grown for three days on solid medium with NH4+ as nitrogen source and Gal or Gluc as carbon source. (B) The same cells as in A, additionally expressing HA-NPR1 from a plasmid, were grown on Gluc NH4+ medium in a microplate reader for 28 h. Data points represent averages of the OD at 660 nm of two biological replicates; error bars represent SD. (C) GAL1p-PMA1 pma2Δ cells expressing, from a plasmid, either (Np)PMA2E14D, (Np)PMA2E14D-T955A, (Np)PMA2E14D-T931A, (Np)PMA2E14D-T931D, (Np)PMA2E14D-S938D, (Np)PMA2E14D-S938A, or (Np)PMA2E14D-Δ(887-956) were spotted in two-fold serial dilutions on solid rich (YPD) or Gluc NH4+ (pH 6.1 or 4) medium and incubated for three days. Equivalent results were obtained when the strains additionally expressed HA-Npr1. (D) GAL1p-PMA1 pma2Δ cells expressing, from plasmids, 6xHis-tagged (Sc)Pma1, (Np)PMA2E14D, (Np)PMA2E14D-Δ(887-956), (Np)PMA2E14D-T955A, (Np)PMA2E14D-S938A, (Np)PMA2E14D-S938D, (Np)PMA2E14D-T931A, or (Np)PMA2E14D-T931D along with HA-NPR1 were grown on Gluc NH4+. After a shift to Gluc proline medium for four hours, the cells were collected and lysed, and His-tagged proteins were pulled down as described in Materials and Methods. Lysates and pulled-down fractions were immunoblotted with anti-14-3-3 or anti-polyhistidine antibodies. (E) Left. GAL1p-PMA1 pma2Δ cells expressing, from plasmids, either (Np)PMA2E14D or (Np)PMA2E14D-T955A along with pHluorin were grown on Gluc NH4+ medium. After a shift to Gluc proline for four hours, the cytosolic pH was monitored with (open symbols) or without (filled symbols) addition of FCCP (20 µM), starting at 1 min (indicated by an arrow on the graph). Average values of three biological replicates are shown, and error bars correspond to SD. Right. Strains and growth conditions as in the left panel, except that the cells expressed HA-NPR1 instead of pHluorin. Culture samples were collected before and 4, 10, and 30 min after addition of FCCP (20 µM) or 30 min after addition of NH4+ (5 mM). Crude extracts were prepared and immunoblotted with anti-HA and anti-Pgk antibodies. (F,G) Experiments similar to those in E, except that other (Np)PMA2E14D mutants were analyzed, as indicated. Original blots of figure panels D, E, F and G are presented in Fig. S3.
Figure 5
Figure 5
Reduced expression of 14–3–3 s impedes PMA2-mediated TORC1 activation. (A) GAL1p-PMA1 pma2Δ or GAL1p-PMA1 pma2Δ bmh1Δ cells expressing from a plasmid either (Sc)Pma1, (Np)PMA2E14D, or (Np)PMA2E14D-Δ(887–956) were spotted in two-fold serial dilutions on solid rich (YPD) or Gluc NH4+ (pH 6.1 or 4) medium and incubated for three days. Similar results were obtained with the same strains additionally expressing HA-Npr1. (B) GAL1p-PMA1 pma2Δ or GAL1p-PMA1 pma2Δ bmh1Δ cells expressing, from plasmids, either (Sc)Pma1 or (Np)PMA2E14D along with HA-NPR1 were grown on Gluc NH4+ medium. Acidification by these cells of the external medium was measured as described in Materials and Methods. Average values of three biological replicates are shown, and error bars correspond to SD. (C) Left. Strains and growth conditions as in B, except that the cells expressed pHluorin instead of HA-Npr1from a plasmid. After a shift to Gluc proline medium for four hours, the cytosolic pH was monitored with (open symbols) or without (filled symbols) addition of FCCP (20 µM), starting at 1 min (indicated by an arrow on the graph). Average values of three biological replicates are shown, and error bars correspond to SD. Right. Strains, growth conditions, and FCCP treatment as in B, except that the cells expressed HA-NPR1 instead of pHluorin. Cells were collected before and 4, 10, and 30 min after addition of FCCP (20 µM). Crude extracts were prepared and immunoblotted with anti-HA and anti-Pgk antibodies. For samples of cells expressing (Np)PMA2E14D, 2.3-fold more cell extract was loaded to compensate for the lower expression of HA-Npr1 which was systematically observed in independent transformed clones, for unclear reasons. On a separate gel, all samples were equally loaded and immunoblotted with anti-14–3-3. Original blots are presented in Fig. S3.

Similar articles

Cited by

References

    1. González A, Hall MN. Nutrient sensing and TOR signaling in yeast and mammals. EMBO J. 2017;36:397–408. doi: 10.15252/embj.201696010. - DOI - PMC - PubMed
    1. Liu GY, Sabatini DM. mTOR at the nexus of nutrition, growth, ageing and disease. Nat. Rev. Mol. Cell Biol. 2020;21:183–203. doi: 10.1038/s41580-019-0199-y. - DOI - PMC - PubMed
    1. Ryabova LA, Robaglia C, Meyer C. Target of Rapamycin kinase: Central regulatory hub for plant growth and metabolism. J. Exp. Bot. 2019;70:2211–2216. doi: 10.1093/jxb/erz108. - DOI - PMC - PubMed
    1. Eltschinger S, Loewith R. TOR complexes and the maintenance of cellular homeostasis. Trends Cell Biol. 2016;26:148–159. doi: 10.1016/j.tcb.2015.10.003. - DOI - PubMed
    1. Saxton RA, Sabatini DM. mTOR signaling in growth, metabolism, and disease. Cell. 2017;169:361–371. doi: 10.1016/j.cell.2017.03.035. - DOI - PubMed

Publication types

MeSH terms

Substances