

Oxygen extraction ratio to identify patients at increased risk of intradialytic hypotension
- PMID: 33637839
- PMCID: PMC7910620
- DOI: 10.1038/s41598-021-84375-7
Oxygen extraction ratio to identify patients at increased risk of intradialytic hypotension
Abstract
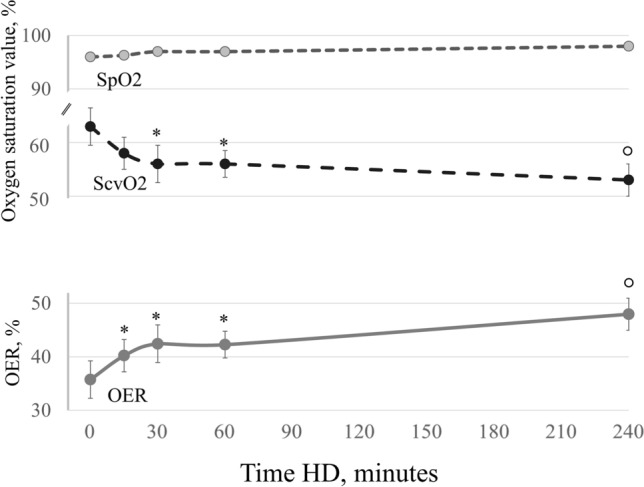
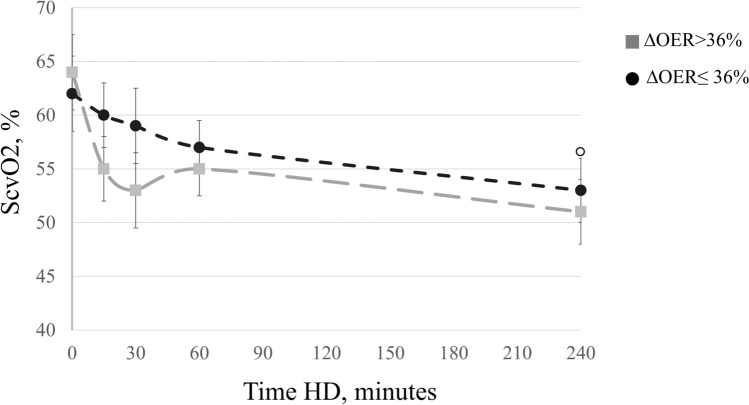
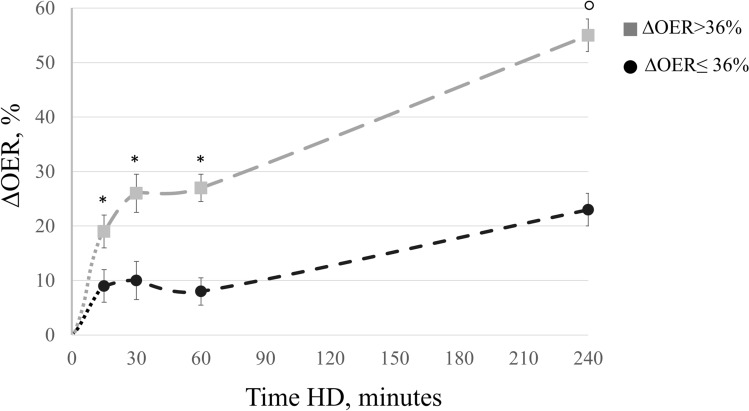
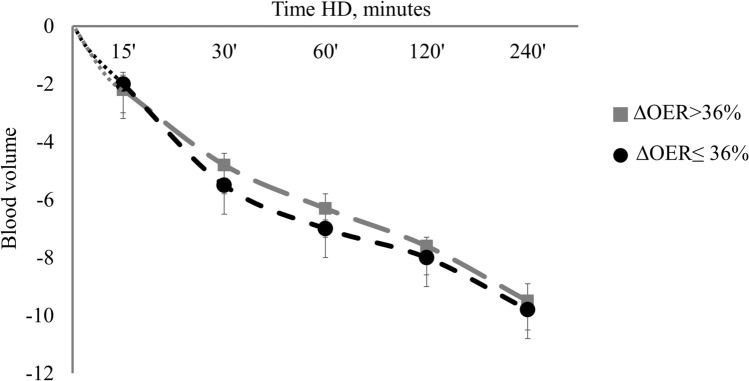
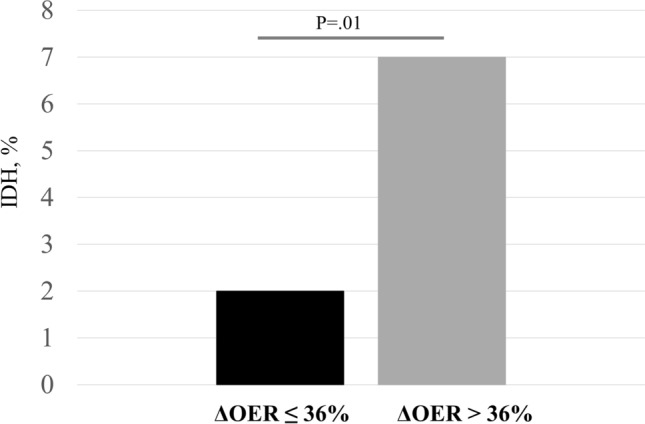
Intradialytic hypotension (IDH) is a hemodynamic phenomenon recently associated with decreased blood oxygen saturation (SO2). The ratio between peripheral oxygen saturation (SpO2) and central venous SO2 (ScvO2) or Oxygen Extraction Ratio (OER), which represents a roughly estimate of the amount of oxygen claimed by peripheral tissues, might be used to estimate haemodialysis (HD) related hypoxic stress. Aim of this pilot study was to evaluate the relationship between OER increments during dialysis sessions (ΔOER) and episodes of IDH. We enrolled chronic HD patients with permanent central venous catheter (CVC) and no fistula, in whom ScvO2 measurement is at hand. OER ([(SpO2 - ScvO2)/SpO2] × 100) was measured in three consecutive HD sessions (HD OER sessions) before HD, after 15', 30' and 60' min and at the end of HD. Then, a one-year follow-up was planned to record the number of IDH episodes. In the 28 enrolled patients (age 74 ± 2.6 years), during 12 ± 1.2 months of follow up, incidence of IDH was 3.6%. We divided patients into two groups, above or below the median value of ΔOER at the end of HD, which was 36%. In these groups, the average incidence of IDH was 7% and 2% respectively (p < 0.01), while OER values before HD were not different. Notably, in the high ΔOER group the OER increment was evident since after 15' and was significantly higher than in the low ∆OER group (∆OER-15' = 19 ± 3.0% vs. 9.0 ± 3.0%; p < 0.05). By comparison, blood volume changes overlapped in the two groups (average change - 9 ± 0.8%). Values of ∆OER > 19% after only 15' of HD treatment or > 36% at the end of the session characterize patients with higher rates of hypotension. Intradialytic ∆OER, a parameter of tissue hypoxic stress, identifies more fragile patients at greater risk of IDH.
Conflict of interest statement
The authors declare no competing interests.
Figures
References
-
- Barratt-Boyes BG, Wood EH. The oxygen saturation of blood in the venae cavae, right-heart chambers, and pulmonary vessels of healthy subjects. J. Lab. Clin. Me. 1957;50:93–106. - PubMed
Publication types
MeSH terms
Substances
LinkOut - more resources
Full Text Sources
Other Literature Sources
Medical
