. 2021 Feb 26;11(1):4742.
doi: 10.1038/s41598-021-84090-3.

LRP1 mediates the IGF-1-induced GLUT1 expression on the cell surface and glucose uptake in Müller glial cells

Affiliations

LRP1 mediates the IGF-1-induced GLUT1 expression on the cell surface and glucose uptake in Müller glial cells

Virginia Actis Dato et al. Sci Rep. .

Abstract

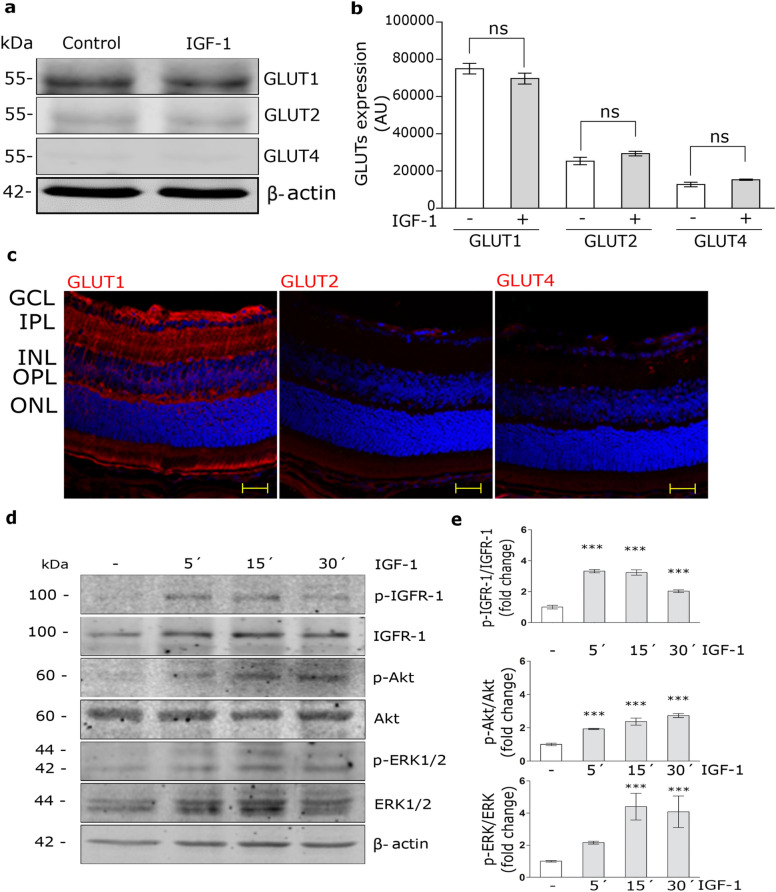
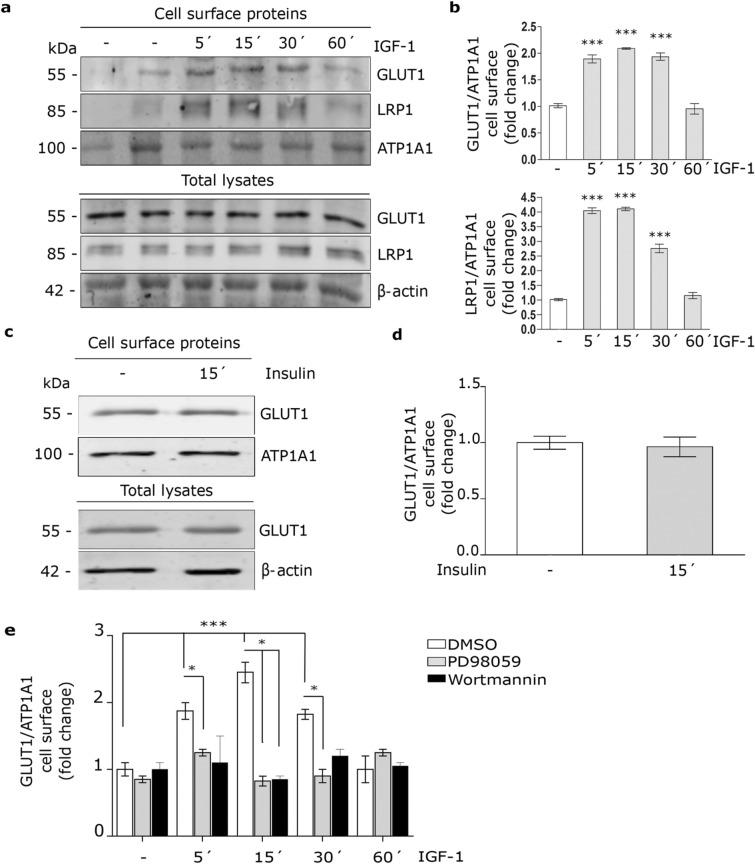
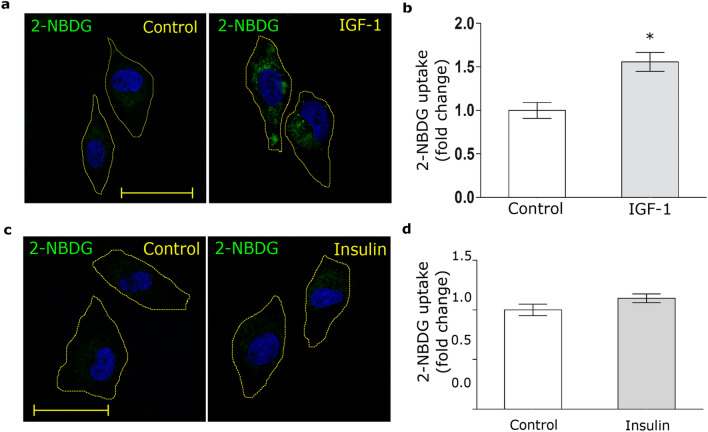
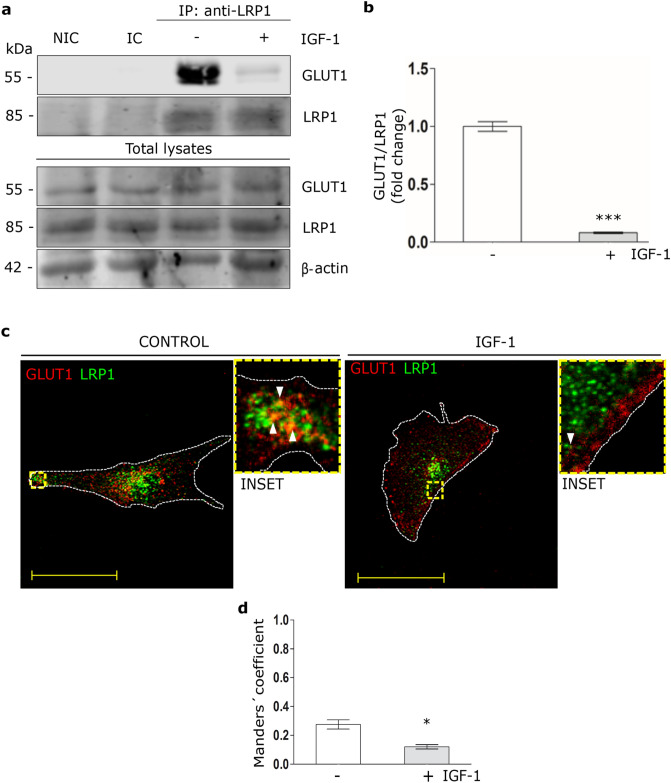
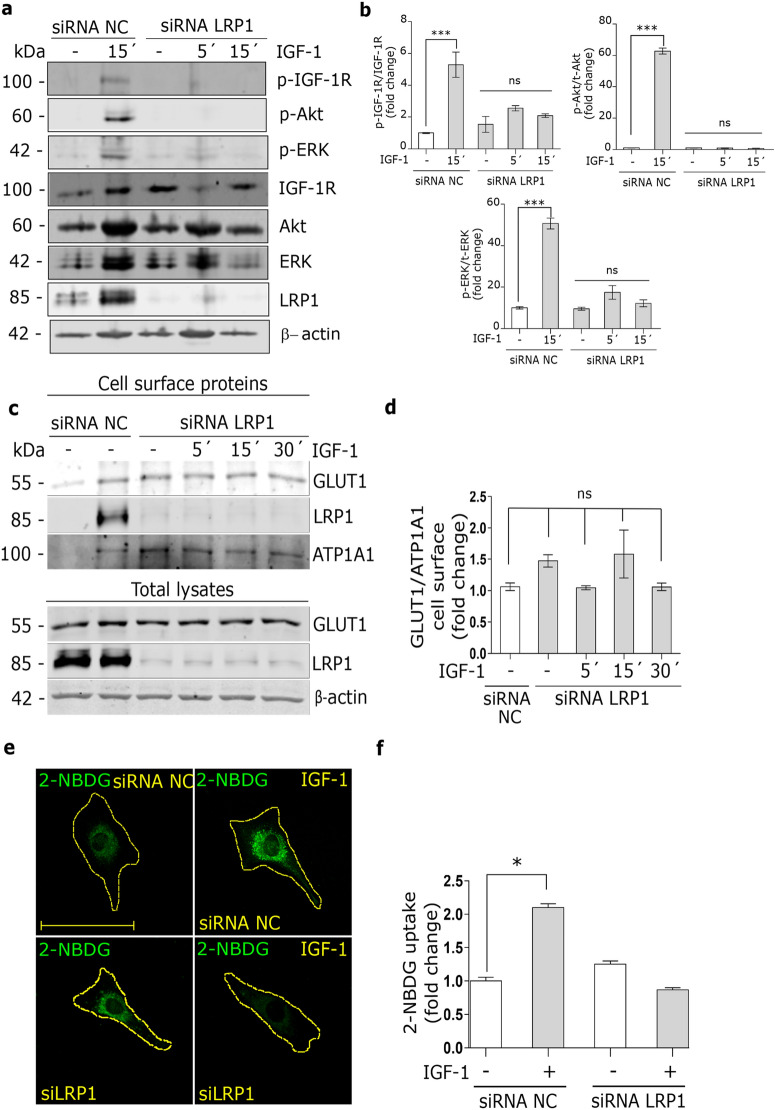
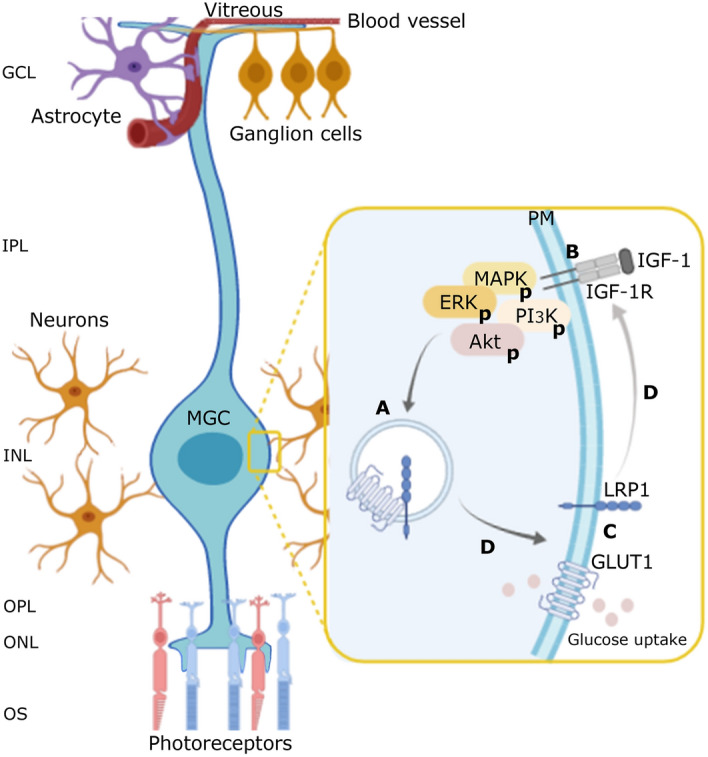
Insulin-like Growth Factor-1 (IGF-1) is involved in the normal development and survival of retinal cells. Low-density lipoprotein Receptor-related Protein-1 (LRP1) plays a key role on the regulation of several membrane proteins, such as the IGF-1 receptor (IGF-1R). In brain astrocytes, LRP1 interact with IGF-1R and the glucose transporter type 1 (GLUT1), regulating the glucose uptake in these cells. Although GLUT1 is expressed in retinal Müller Glial Cells (MGCs), its regulation is not clear yet. Here, we investigated whether IGF-1 modulates GLUT1 traffic to plasma membrane (PM) and glucose uptake, as well as the involvement of LRP1 in this process in the human Müller glial-derived cell line (MIO-M1). We found that IGF-1 produced GLUT1 translocation to the PM, in a time-dependent manner involving the intracellular signaling activation of MAPK/ERK and PI3K/Akt pathways, and generated a significant glucose uptake. Moreover, we found a molecular association between LRP1 and GLUT1, which was significantly reduced by IGF-1. Finally, cells treated with specific siRNA for LRP1 showed an impaired GLUT1 expression on PM and decreased glucose uptake induced by IGF-1. We conclude that IGF-1 regulates glucose homeostasis in MGCs involving the expression of LRP1.


Conflict of interest statement

The authors declare no competing interests.

Figures

Figure 1
Figure 1
IGF-1 activates MAPK/ERK and PI3K/Akt pathways. (a) Western blot assay for the analysis of GLUT1, GLUT2 and GLUT4 expression in MIO-M1 cells treated with IGF-1 10 nM for 60 min. β-actin was used as loading control. (b) Densitometric quantification of Western blot data expressed as arbitrary units (AU). Values are expressed as mean ± SEM. ns = non-significant differences. Three independent experiments in duplicate were performed (n = 6). (c) Representative immunofluorescence analysis of GLUT1, GLUT2 and GLUT4 (red) in cryosections of mouse retinas (at 26 days of life). Abbreviations: GCL, ganglion cell layer; IPL, inner plexiform layer; INL, inner nuclear layer; OPL, outer plexiform layer; ONL, outer nuclear layer. Scale bar: 25 μm. (n = 3) (d) Western blot assay for the analysis of phosphorylated IGF-1R (p-IGF-1R; T1316), Akt (p-Akt; T308) and ERK 1/2 (p-ERK1/2; Thr202/Tyr204) in MIO-M1 cells treated with IGF-1 10 nM for 5–30 min. Total IGF-1R, Akt, ERK1/2 and β-actin were used as loading control. (e) Densitometric quantification of Western blot data expressed as fold change respect to non-stimulated control (white bar). Values are expressed as mean ± SEM. ***p < 0.001 versus non-stimulated control. Three independent experiments in duplicate were performed (n = 6).
Figure 2
Figure 2
IGF-1 induces GLUT1 traffic to the PM by MAPK/ERK and PI3K/Akt signaling activation. (a) Biotin-labeling protein assay to measure the expression of GLUT1 and LRP1 in the PM of MIO-M1 cells stimulated with IGF-1 10 nM for 5–60 min. Biotin-labeled proteins were isolated with streptavidin-conjugated beads and then analyzed by Western blot. ATP1A1 and β-actin were used as protein loading controls. Line 1: control without biotin. (b) Densitometric quantification of Western blot data for cell surface GLUT1 and LRP1 related to ATP1A1 expressed as fold change respect to non-stimulated control (white bar). Values are expressed as mean ± SEM. ***p < 0.001 versus non-stimulated control. Three independent experiments in duplicate were performed (n = 6). (c) Biotin-labeling protein assay to measure expression of GLUT1 in the PM of cells stimulated with Insulin 10 nM for 15 min. Biotin-labeled proteins were isolated with streptavidin-conjugated beads and then analyzed by Western blot. ATP1A1 and β-actin were used as protein loading controls. (d) Densitometric quantification of Western blot data for surface GLUT1 related to ATP1A1 expressed as fold change respect to non-stimulated control (white bar). Values are expressed as mean ± SEM. Three independent experiments in duplicate were performed (n = 6). (e) Cell surface protein detection assay to measure plasma membrane GLUT1 in cells pretreated with PD98059 (40 μM) or Wortmannin (40 μM) for 30 min and then stimulated with IGF-1 10 nM for 5–60 min. The cell surface level of GLUT1 was analyzed in non-permeabilized cells using anti-GLUT1 antibody as is indicated in detail in Methods. Values are expressed as mean ± SEM. ***p < 0.001 versus non-stimulated control. *p < 0.05 versus indicated conditions. Three independent experiments in duplicate were performed (n = 6).
Figure 3
Figure 3
IGF-1 promotes glucose uptake. (a,c) Confocal microscopy in MIO-M1 cells treated with IGF-1 10 nM (a) or Insulin 10 nM (c) together with 2-NBDG 80 µM (green) for 30 min. Dotted line represents the cell shape. Images are representative of 20 cells per condition (n = 20). Scale bar = 15 μM. (b,d) Graph represents mean ± SEM of the fluorescence intensity of 2-NBDG per cell area expressed as fold change. *p < 0.05 versus non-stimulated control (white bar).
Figure 4
Figure 4
IGF-1 reduces the molecular association between LRP1 and GLUT1. (a) Immunoprecipitation assays in MIO-M1 cells treated with IGF-1 10 nM for 30 min. Cell lysates were immunoprecipitated with anti-LRP1 antibody and protein A/G agarose beads as indicated in Methods. Immunoprecipitated LRP1 and GLUT1 are shown on the top panel and total LRP1, GLUT1 and β-actin in cell lysates are shown in the lower panel of the Western blot. NIC: non-immune control. IC: isotype immunoglobulin control. (b) Densitometric quantification of relative intensity of GLUT1 bands with respect to LRP1 as a fold change against control (white bar). Values are expressed as mean ± SEM. ***p < 0.001 versus non-stimulated control. Three independent experiments in duplicate were performed (n = 6). (c) Confocal microscopy in MIO-M1 cells treated with IGF-1 10 nM for 30 min. Representative images of LRP1 (green) and GLUT1 (red) in immunostained sections. INSET represents magnification 4× of framed regions in dotted lines. White arrowheads indicate colocalization sectors (yellow). Images are representative of 20 cells per condition (n = 20). White dotted line represents the cell shape. Scale bar = 15 μM. (d) Quantitative analysis of colocalization between LRP1 and GLUT1 by Manders’ coefficients are expressed as mean ± SD (%) measured in 20 cells per condition from three independent experiments. *p < 0.05 versus non-stimulated control (white bar).
Figure 5
Figure 5
IGF-1-induced GLUT1 traffic to PM and glucose uptake are dependent on LRP1 expression. (a) Western blot assay for the analysis of phosphorylated IGF-1R (p-IGF-1R; T1316), Akt (p-Akt; T308) and ERK 1/2 (p- ERK1/2; Thr202/Tyr204) in MIO-M1 cells treated or not with siRNA for LRP1 and then stimulated with IGF-1 10 nM for 5–15 min. Total IGF-1R, Akt, ERK1/2 and β-actin were used as loading control. (b) Densitometric quantification of Western blot data expressed as fold change respect to non-stimulated control (white bar). Values are expressed as mean ± SEM. ***p < 0.001 versus non-stimulated control. ns = non-significant differences. Three independent experiments in duplicate were performed (n = 6). (c) Biotin-labeling protein assay to measure expression of GLUT1 and LRP1 in the PM of MIO-M1 cells treated or not with siRNA for LRP1 and then stimulated with IGF-1 10 nM for 5–30 min. Biotin-labeled proteins were isolated with streptavidin-conjugated beads and then analyzed by Western blot. ATP1A1 and β-actin were used as protein loading controls. Line 1: control without biotin. (d) Densitometric quantification of Western blot data for surface GLUT1 related to ATP1A1 expressed as fold change respect to non-stimulated control (white bar). Values are expressed as mean ± SEM. ns = non-significant differences. Three independent experiments in duplicate were performed (n = 6). (e) Confocal microscopy in MIO-M1 cells treated with specific siRNA for LRP1 (siLRP1) and then stimulated with IGF-1 10 nM together with 2-NBDG 80 µM (green) for 30 min. Dotted line represents the cell shape. Images are representative of 20 cells per condition (n = 20). Scale bar = 10 μM. (f) Graph represents mean ± SEM of the fluorescence intensity of 2-NBDG per cell area expressed as fold change. *p < 0.05 versus non-stimulated control (white bars).
Figure 6
Figure 6
Schematic model of LRP1 mediation in GLUT1 translocation to cell surface and glucose uptake induced by IGF-1. (A) Representative image in which, in non-stimulated MIO-M1 cells, LRP1 and GLUT1 are stored in same, but uncharacterized vesicles, since they are molecularly associated through a possible direct interaction or mediated by adaptor proteins. This molecular association would be necessary to retain GLUT1 inside the cells. (B) IGF-1 induces MAPK/ERK and PI3K/Akt signaling activation through its cognate receptor (IGF-1R). (C) This IGF-1-induced activation promptly leads to the molecular dissociation of LRP1 and GLUT1, promoting the intracellular traffic of both membrane proteins to the PM and glucose uptake. Nevertheless, if both intracellular signaling pathways have different downstream targets on the GLUT1 traffic are still unknown. (D) The LRP1 knockdown fully abrogates the IGF-1R intracellular signaling, the GLUT1 translocation and glucose uptake processes. Taken account these considerations, we propose that the LRP1 mediation in the IGF-1-induced glucose control in MIO-M1 cells may be focused at two levels: (1) by regulating the intracellular traffic of GLUT1, and (2) by acting as a scaffold protein for the IGF-1R activation. Ganglion cell layer (GCL), inner plexiform layer (IPL), inner nuclear layer (INL), outer plexiform layer (OPL), outer nuclear layer (ONL), outer segment layer (OS).

References

    1. Narayan DS, Chidlow G, Wood JP, Casson RJ. Glucose metabolism in mammalian photoreceptor inner and outer segments. Clin. Exp. Ophthalmol. 2017;45:730–741. doi: 10.1111/ceo.12952. - DOI - PubMed
    1. Umino Y, et al. Hypoglycemia leads to age-related loss of vision. Proc. Natl. Acad. Sci. U.S.A. 2006;103:19541–19545. doi: 10.1073/pnas.0604478104. - DOI - PMC - PubMed
    1. Reichenbach A, et al. What do retinal muller (glial) cells do for their neuronal 'small siblings'? J. Chem. Neuroanat. 1993;6:201–213. doi: 10.1016/0891-0618(93)90042-3. - DOI - PubMed
    1. Ahmad I, Del Debbio CB, Das AV, Parameswaran S. Muller glia: a promising target for therapeutic regeneration. Investig. Ophthalmol. Vis. Sci. 2011;52:5758–5764. doi: 10.1167/iovs.11-7308. - DOI - PubMed
    1. Bringmann A, et al. Human Muller glial cells: altered potassium channel activity in proliferative vitreoretinopathy. Investig. Ophthalmol. Vis. Sci. 1999;40:3316–3323. - PubMed

Publication types

MeSH terms