

Integration of relative metabolomics and transcriptomics time-course data in a metabolic model pinpoints effects of ribosome biogenesis defects on Arabidopsis thaliana metabolism
- PMID: 33637852
- PMCID: PMC7910480
- DOI: 10.1038/s41598-021-84114-y
Integration of relative metabolomics and transcriptomics time-course data in a metabolic model pinpoints effects of ribosome biogenesis defects on Arabidopsis thaliana metabolism
Abstract
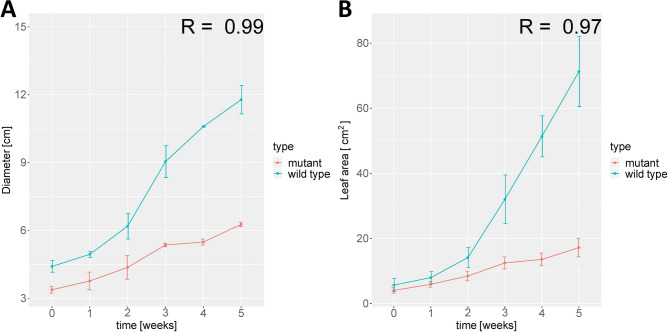
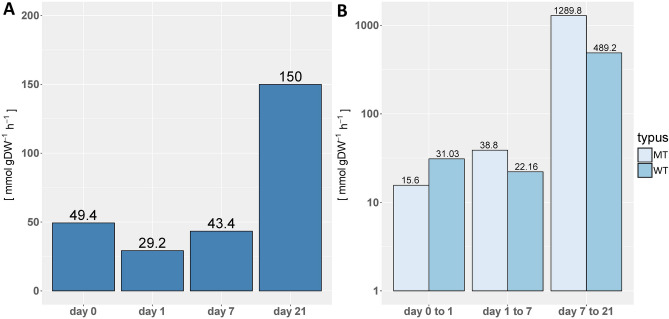
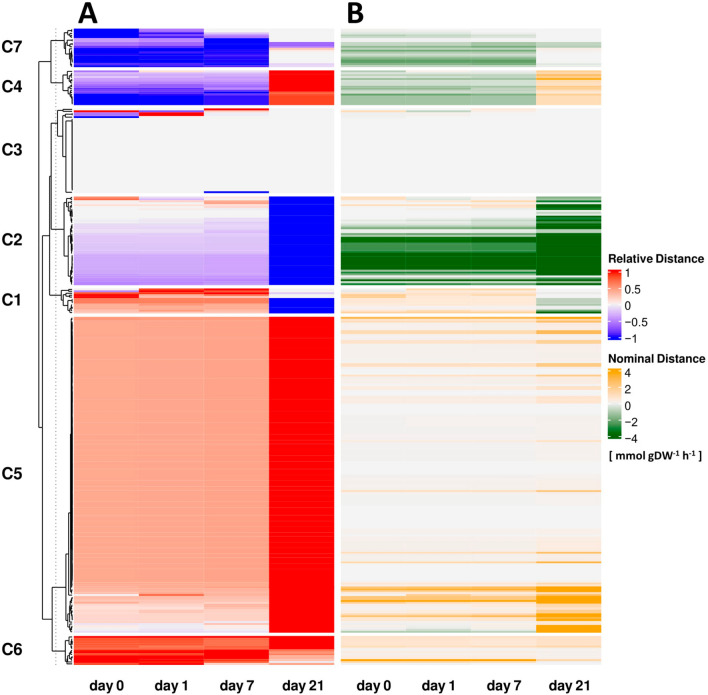
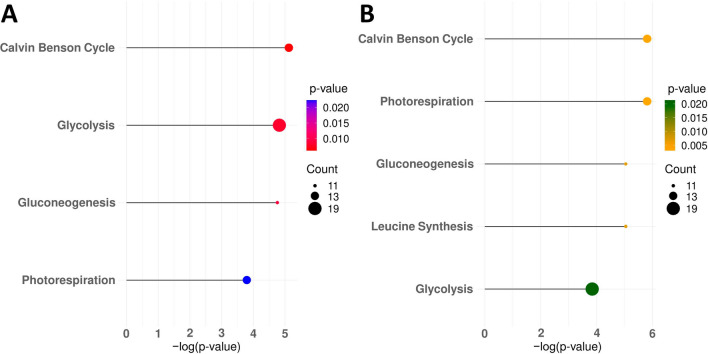
Ribosome biogenesis is tightly associated to plant metabolism due to the usage of ribosomes in the synthesis of proteins necessary to drive metabolic pathways. Given the central role of ribosome biogenesis in cell physiology, it is important to characterize the impact of different components involved in this process on plant metabolism. Double mutants of the Arabidopsis thaliana cytosolic 60S maturation factors REIL1 and REIL2 do not resume growth after shift to moderate 10 [Formula: see text] chilling conditions. To gain mechanistic insights into the metabolic effects of this ribosome biogenesis defect on metabolism, we developed TC-iReMet2, a constraint-based modelling approach that integrates relative metabolomics and transcriptomics time-course data to predict differential fluxes on a genome-scale level. We employed TC-iReMet2 with metabolomics and transcriptomics data from the Arabidopsis Columbia 0 wild type and the reil1-1 reil2-1 double mutant before and after cold shift. We identified reactions and pathways that are highly altered in a mutant relative to the wild type. These pathways include the Calvin-Benson cycle, photorespiration, gluconeogenesis, and glycolysis. Our findings also indicated differential NAD(P)/NAD(P)H ratios after cold shift. TC-iReMet2 allows for mechanistic hypothesis generation and interpretation of system biology experiments related to metabolic fluxes on a genome-scale level.
Conflict of interest statement
The authors declare no competing interests.
Figures
Similar articles
-
Plant Temperature Acclimation and Growth Rely on Cytosolic Ribosome Biogenesis Factor Homologs.Plant Physiol. 2018 Mar;176(3):2251-2276. doi: 10.1104/pp.17.01448. Epub 2018 Jan 30. Plant Physiol. 2018. PMID: 29382692 Free PMC article.
-
The REIL1 and REIL2 proteins of Arabidopsis thaliana are required for leaf growth in the cold.Plant Physiol. 2013 Dec;163(4):1623-39. doi: 10.1104/pp.113.223925. Epub 2013 Sep 13. Plant Physiol. 2013. PMID: 24038679 Free PMC article.
-
Arabidopsis REI-LIKE proteins activate ribosome biogenesis during cold acclimation.Sci Rep. 2021 Jan 28;11(1):2410. doi: 10.1038/s41598-021-81610-z. Sci Rep. 2021. PMID: 33510206 Free PMC article.
-
The Arabidopsis gene DIG6 encodes a large 60S subunit nuclear export GTPase 1 that is involved in ribosome biogenesis and affects multiple auxin-regulated development processes.J Exp Bot. 2015 Nov;66(21):6863-75. doi: 10.1093/jxb/erv391. Epub 2015 Aug 13. J Exp Bot. 2015. PMID: 26272902 Free PMC article.
-
Spatially Enriched Paralog Rearrangements Argue Functionally Diverse Ribosomes Arise during Cold Acclimation in Arabidopsis.Int J Mol Sci. 2021 Jun 7;22(11):6160. doi: 10.3390/ijms22116160. Int J Mol Sci. 2021. PMID: 34200446 Free PMC article.
Cited by
-
Genome-scale metabolic network models: from first-generation to next-generation.Appl Microbiol Biotechnol. 2022 Aug;106(13-16):4907-4920. doi: 10.1007/s00253-022-12066-y. Epub 2022 Jul 13. Appl Microbiol Biotechnol. 2022. PMID: 35829788 Review.
-
Comparative transcriptome and coexpression network analysis reveals key pathways and hub candidate genes associated with sunflower (Helianthus annuus L.) drought tolerance.BMC Plant Biol. 2024 Mar 27;24(1):224. doi: 10.1186/s12870-024-04932-w. BMC Plant Biol. 2024. PMID: 38539093 Free PMC article.
-
Genome Scale Modeling to Study the Metabolic Competition between Cells in the Tumor Microenvironment.Cancers (Basel). 2021 Sep 14;13(18):4609. doi: 10.3390/cancers13184609. Cancers (Basel). 2021. PMID: 34572839 Free PMC article. Review.
References
-
- Dieuaide-Noubhani, M. & Alonso, A. P. Application of metabolic flux analysis to plants. 1–17 (2014). - PubMed
Publication types
MeSH terms
Substances
LinkOut - more resources
Full Text Sources
Other Literature Sources
Molecular Biology Databases
