. 2021 Jun 1;42(8):2623-2641.
doi: 10.1002/hbm.25393. Epub 2021 Feb 27.

The default mode network and cognition in Parkinson's disease: A multimodal resting-state network approach

Affiliations

The default mode network and cognition in Parkinson's disease: A multimodal resting-state network approach

Marina C Ruppert et al. Hum Brain Mapp. .

Abstract

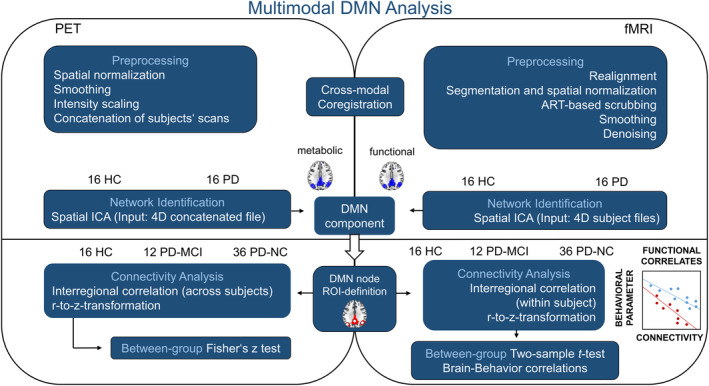
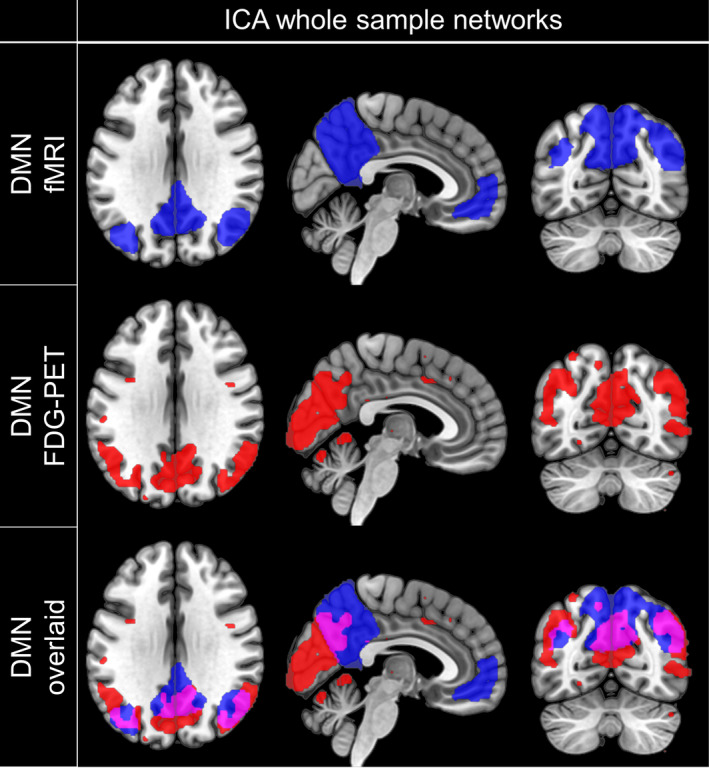
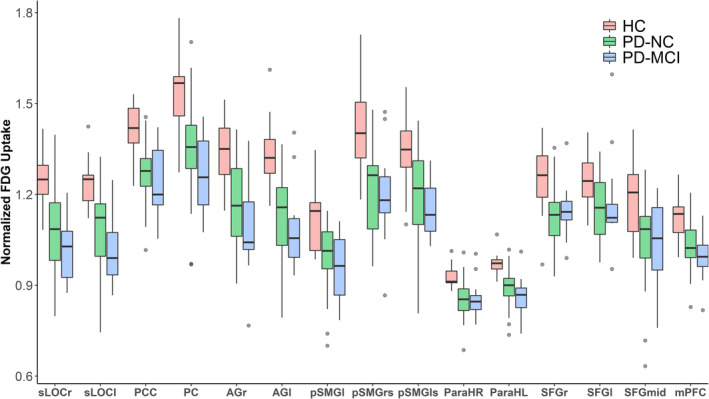
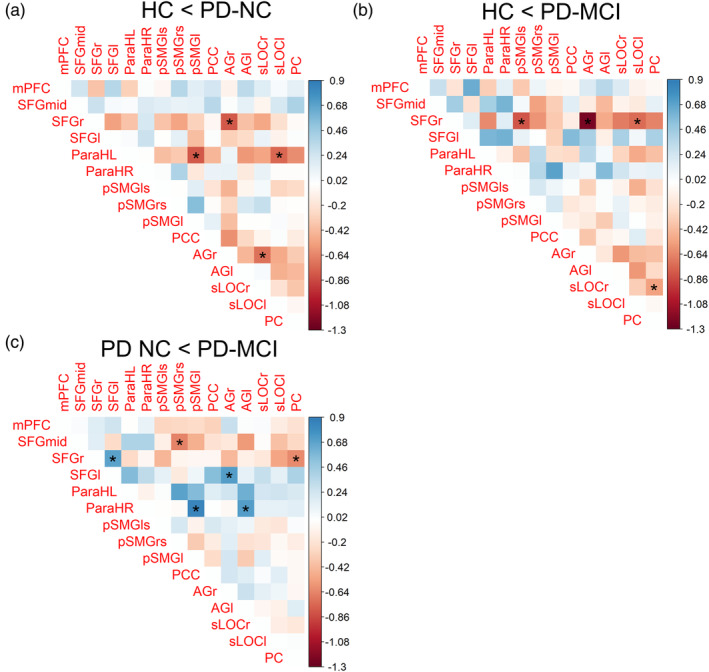
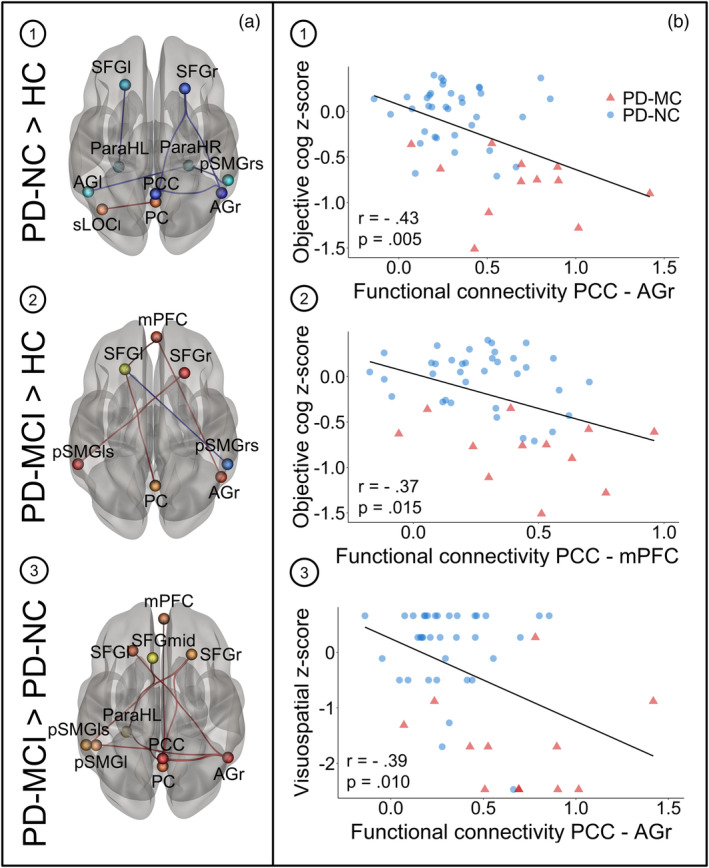
Involvement of the default mode network (DMN) in cognitive symptoms of Parkinson's disease (PD) has been reported by resting-state functional MRI (rsfMRI) studies. However, the relation to metabolic measures obtained by [18F]-fluorodeoxyglucose positron emission tomography (FDG-PET) is largely unknown. We applied multimodal resting-state network analysis to clarify the association between intrinsic metabolic and functional connectivity abnormalities within the DMN and their significance for cognitive symptoms in PD. PD patients were classified into normal cognition (n = 36) and mild cognitive impairment (MCI; n = 12). The DMN was identified by applying an independent component analysis to FDG-PET and rsfMRI data of a matched subset (16 controls and 16 PD patients) of the total cohort. Besides metabolic activity, metabolic and functional connectivity within the DMN were compared between the patients' groups and healthy controls (n = 16). Glucose metabolism was significantly reduced in all DMN nodes in both patient groups compared to controls, with the lowest uptake in PD-MCI (p < .05). Increased metabolic and functional connectivity along fronto-parietal connections was identified in PD-MCI patients compared to controls and unimpaired patients. Functional connectivity negatively correlated with cognitive composite z-scores in patients (r = -.43, p = .005). The current study clarifies the commonalities of metabolic and hemodynamic measures of brain network activity and their individual significance for cognitive symptoms in PD, highlighting the added value of multimodal resting-state network approaches for identifying prospective biomarkers.

Keywords: Parkinson's disease; [18F]-FDG-PET; default mode network; metabolic covariance; mild cognitive impairment; resting-state fMRI.


Conflict of interest statement

The authors declare no conflicts of interest.

Figures

FIGURE 1
FIGURE 1
Schematic representation of the processing pipeline applied during multimodal resting‐state network analysis. fMRI and FDG‐PET data were preprocessed according to standard pipelines except for the intensity normalization of FDG‐PET scans which followed the recently described reference cluster method. Concatenated FDG‐PET scans and single subject fMRI 4D files were fed into spatial ICA with the number of components set to 5. Fifteen spherical ROIs were defined based on the resulting DMN components and interregional correlation coefficients compared between the total sample of HC, PD‐NC, and PD‐MCI subjects. DMN, default mode network; HC, healthy controls; ICA, independent component analysis; MCI, mild cognitive impairment; NC, normal cognition; PD, Parkinson's disease; ROI, region of interest
FIGURE 2
FIGURE 2
Spatial coincidence of ICA‐derived metabolic and functional DMN. Spatial distribution of components representing the DMN obtained by fMRI (first row) or FDG‐PET (second row) and their spatial correspondence (third row). Masks were created by thresholding the component‐specific group maps at z = 2 and overlaid on a T1‐weighted MNI template for visualization. Neurological view. DMN, default mode network; ICA, independent component analysis; FDG‐PET, Fluorodeoxyglucose positron emission tomography
FIGURE 3
FIGURE 3
Metabolic DMN activity in HC (n = 16), PD‐NC (n = 36), and PD patients with MCI (n = 12). In PD patients, normalized regional FDG uptake was significantly reduced in all DMN nodes when compared to healthy controls. For all ROIs, a significant trend towards a progressive metabolic deficit from healthy controls via cognitively unimpaired patients to MCI patients was observed (Jonckheere–Terpstra test p < .01). Grey colored dots indicate outliers (defined as >1.5 times the interquartile distance range). AGl, angular gyrus left; AGr, angular gyrus right; HC, healthy controls; mPFC, medial prefrontal cortex; ParaHL, parahippocampal cortex left; ParaHR, parahippocampal cortex right; PC, precuneus cortex; PCC, posterior cingulate cortex; PD‐MCI, PD patients with mild cognitive impairment; PD‐NC, PD patients with normal cognition; pSMGl, posterior supramarginal gyrus left; pSMGls, posterior supramarginal gyrus left superior; pSMGrs, posterior supramarginal gryus right superior, SFGl, superior frontal gyrus left; SFG mid, superior frontal gyrus mid; SFGr, superior frontal gyrus right; sLOCl, superior lateral occipital cortex left; sLOCr, superior lateral occipital cortex right
FIGURE 4
FIGURE 4
Group differences in metabolic connectivity of DMN ROIs between healthy controls and cognitively impaired (PD‐MCI) or unimpaired (PD‐NC) PD patients. Color scale indicates the difference in correlation coefficients between the groups. Correlation coefficients were compared by Fisher's z test; *significant at p < .05. AGl, angular gyrus left; AGr, angular gyrus right; mPFC, medial prefrontal cortex; ParaHL, parahippocampal cortex left; ParaHR, parahippocampal cortex right; PC, precuneus cortex; PCC, posterior cingulate cortex; PD‐MCI, PD patients with mild cognitive impairment; PD‐NC, PD patients with normal cognition; pSMGl, posterior supramarginal gyrus left; pSMGls, posterior supramarginal gyrus left superior; pSMGrs, posterior supramarginal gyrus right superior; SFGl, superior frontal gyrus left; SFG mid, superior frontal gyrus mid; SFGr, superior frontal gyrus right; sLOCl, superior lateral occipital cortex left; sLOCr, superior lateral occipital cortex right
FIGURE 5
FIGURE 5
(a) Group differences in functional connectivity of DMN ROIs between healthy controls (n = 16) and cognitively impaired (n = 13) and unimpaired (n = 36) PD patients. Between‐group differences were tested two‐sided with threshold set at p uncorrected or FDR‐corrected <.05. Connections shown in red represent increased connectivity strength, blue connections refer to the opposite contrast. ROIs' sizes do not indicate the actual ROI diameters. Results are shown in 3D view from superior perspective. Neurological view. (b) Correlation plots showing significant negative correlations between functional connectivity and cognitive z‐scores in PD patients for the following connections and z‐scores: (1) PCC‐AGr and cognitive composite z‐scores, (2) PCC‐mPFC and cognitive composite z‐scores and (3) PCC‐AGr and visuospatial z‐scores. Pearson's correlation coefficients and p values are shown on the bottom left in each plot. AGl, angular gyrus left; AGr, angular gyrus right; mPFC, medial prefrontal cortex; ParaHL, parahippocampal cortex left; ParaHR, parahippocampal cortex right; PC, precuneus cortex; PCC, posterior cingulate cortex; PD‐MCI, PD patients with mild cognitive impairment; PD‐NC, PD patients with normal cognition; pSMGl, posterior supramarginal gyrus left; pSMGls, posterior supramarginal gyrus left superior; pSMGrs, posterior supramarginal gyrus right superior; SFGl, superior frontal gyrus left; SFG mid, superior frontal gyrus mid; SFGr, superior frontal gyrus right; sLOCl, superior lateral occipital cortex left; sLOCr, superior lateral occipital cortex right

References

    1. Amboni, M. , Tessitore, A. , Esposito, F. , Santangelo, G. , Picillo, M. , Vitale, C. , … Barone, P. (2015). Resting‐state functional connectivity associated with mild cognitive impairment in Parkinson's disease. Journal of Neurology, 262(2), 425–434. 10.1007/s00415-014-7591-5 - DOI - PubMed
    1. Amend, M. , Ionescu, T. M. , Di, X. , Pichler, B. J. , Biswal, B. B. , & Wehrl, H. F. (2019). Functional resting‐state brain connectivity is accompanied by dynamic correlations of application‐dependent 18FFDG PET‐tracer fluctuations. NeuroImage, 196, 161–172. 10.1016/j.neuroimage.2019.04.034 - DOI - PMC - PubMed
    1. Arnemann, K. L. , Stöber, F. , Narayan, S. , Rabinovici, G. D. , & Jagust, W. J. (2018). Metabolic brain networks in aging and preclinical Alzheimer's disease. NeuroImage Clinical, 17, 987–999. 10.1016/j.nicl.2017.12.037 - DOI - PMC - PubMed
    1. Aschenbrenner, S. , Tucha, O. , & Lange, K. W. (2001). RWT Regensburger Wortflüssigkeitstest. Göttingen: Hogrefe Verlag für Psychologie.
    1. Baggio, H.‐C. , Segura, B. , Sala‐Llonch, R. , Marti, M.‐J. , Valldeoriola, F. , Compta, Y. , … Junqué, C. (2015). Cognitive impairment and resting‐state network connectivity in Parkinson's disease. Human Brain Mapping, 36(1), 199–212. 10.1002/hbm.22622 - DOI - PMC - PubMed

Publication types

MeSH terms