

Exosomal miR-27 negatively regulates ROS production and promotes granulosa cells apoptosis by targeting SPRY2 in OHSS
- PMID: 33638619
- PMCID: PMC8051746
- DOI: 10.1111/jcmm.16355
Exosomal miR-27 negatively regulates ROS production and promotes granulosa cells apoptosis by targeting SPRY2 in OHSS
Abstract
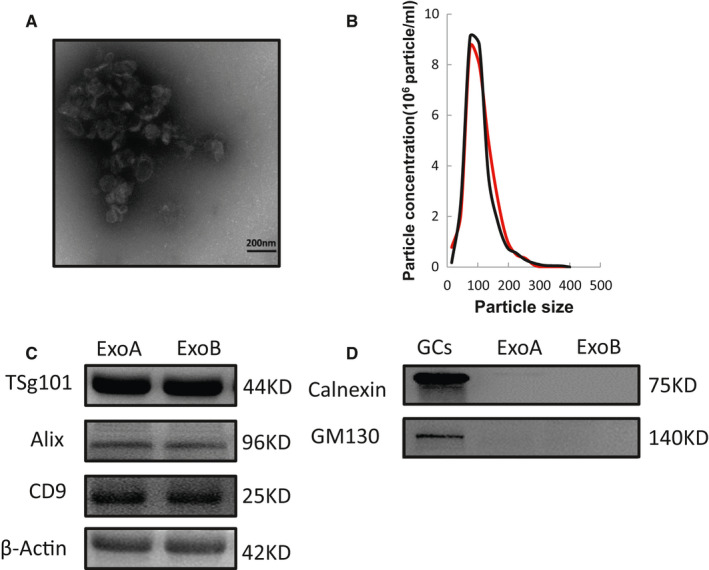
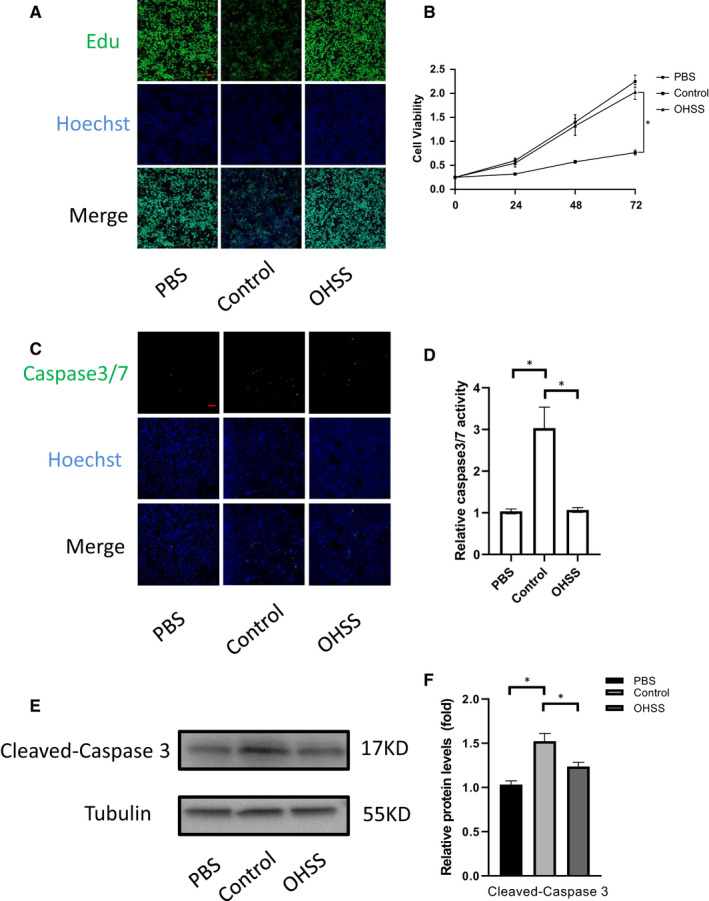
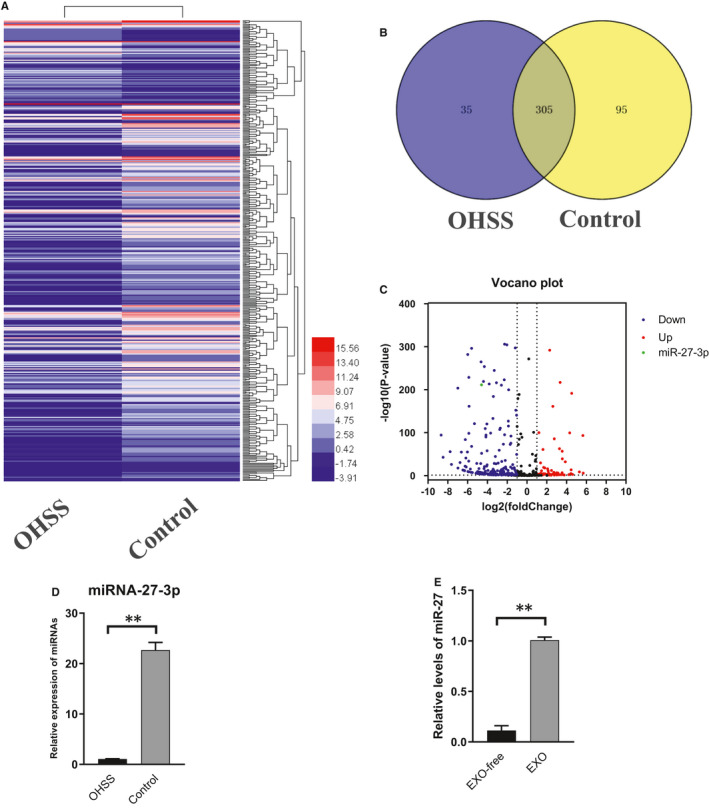
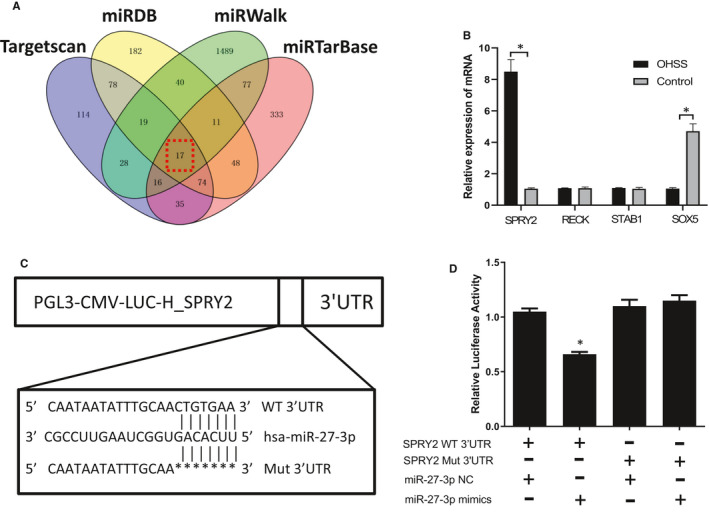
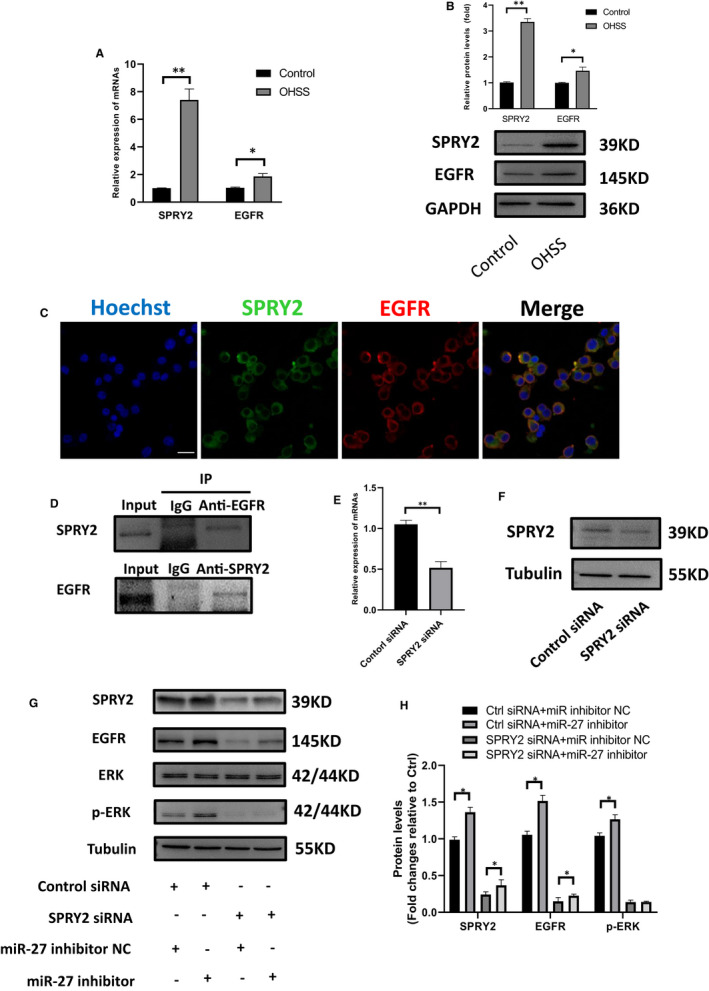
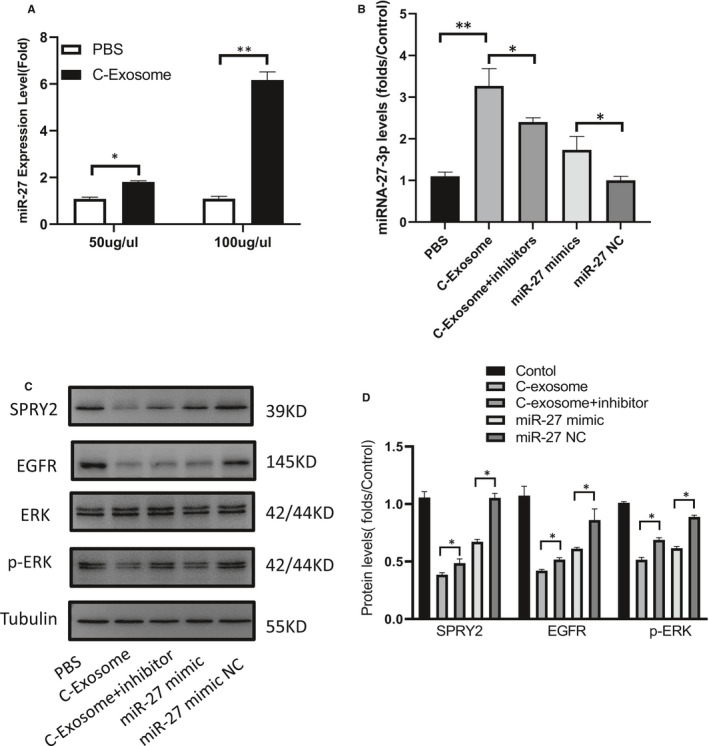
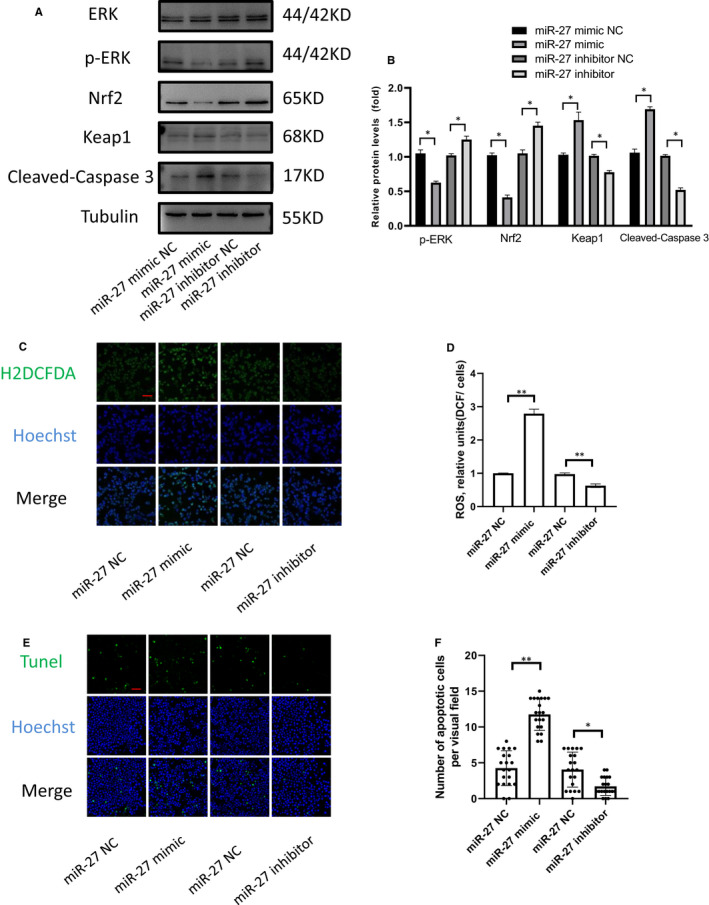
Ovarian hyperstimulation syndrome (OHSS) is one of the most dangerous iatrogenic complications in controlled ovarian hyperstimulation (COH). The exact molecular mechanism that induces OHSS remains unclear. In recent years, accumulating evidence found that exosomal miRNAs participate in many diseases of reproductive system. However, the specific role of miRNAs, particularly the follicular fluid-derived exosomal miRNAs in OHSS remains controversial. To identify differentially expressed follicular fluid exosomal miRNAs from OHSS and non-OHSS patients, the analysis based on miRNA-sequence was conducted. The levels of 291 miRNAs were significantly differed in exosomes from OHSS patients compared with normal control, and exosomal miR-27 was one of the most significantly down-regulated miRNAs in the OHSS group. By using MiR-27 mimic, we found it could increase ROS stress and apoptosis by down-regulating the expression of p-ERK/Nrf2 pathway by negatively regulating SPRY2. These data demonstrate that exosomal miRNAs are differentially expressed in follicular fluid between patients with and without OHSS, and follicular fluid exosomal miR-27 may involve in the pathological process of OHSS development.
Keywords: OHSS; exosome; follicular fluid; miRNAs.
© 2021 The Authors. Journal of Cellular and Molecular Medicine published by Foundation for Cellular and Molecular Medicine and John Wiley & Sons Ltd.
Conflict of interest statement
The authors confirm that there are no conflicts of interest.
Figures
Similar articles
-
Exosomal and Non-Exosomal Transport of Extra-Cellular microRNAs in Follicular Fluid: Implications for Bovine Oocyte Developmental Competence.PLoS One. 2013 Nov 4;8(11):e78505. doi: 10.1371/journal.pone.0078505. eCollection 2013. PLoS One. 2013. PMID: 24223816 Free PMC article.
-
Exosomal miR-143-3p derived from follicular fluid promotes granulosa cell apoptosis by targeting BMPR1A in polycystic ovary syndrome.Sci Rep. 2022 Mar 14;12(1):4359. doi: 10.1038/s41598-022-08423-6. Sci Rep. 2022. PMID: 35288625 Free PMC article.
-
Higher melatonin in the follicle fluid and MT2 expression in the granulosa cells contribute to the OHSS occurrence.Reprod Biol Endocrinol. 2019 Apr 12;17(1):37. doi: 10.1186/s12958-019-0479-6. Reprod Biol Endocrinol. 2019. PMID: 30979376 Free PMC article.
-
The role of vascular endothelial growth factor and interleukins in the pathogenesis of severe ovarian hyperstimulation syndrome.Hum Reprod Update. 1997 May-Jun;3(3):255-66. doi: 10.1093/humupd/3.3.255. Hum Reprod Update. 1997. PMID: 9322101 Review.
-
The crosstalk between exosomal miRNA and ferroptosis: A narrative review.Biol Cell. 2025 Jan;117(1):e2400077. doi: 10.1111/boc.202400077. Biol Cell. 2025. PMID: 39853758 Review.
Cited by
-
Long Noncoding RNA NONHSAT233728.1 Promotes ROS Accumulation and Granulosa Cell Apoptosis by Regulating the MAPK/ERK1/2 Signaling Pathway.FASEB J. 2025 Jun 15;39(11):e70681. doi: 10.1096/fj.202500964R. FASEB J. 2025. PMID: 40432414 Free PMC article.
-
Exosome is a Fancy Mobile Sower of Ferroptosis.J Cardiovasc Transl Res. 2024 Oct;17(5):1067-1082. doi: 10.1007/s12265-024-10508-8. Epub 2024 May 22. J Cardiovasc Transl Res. 2024. PMID: 38776048 Review.
-
Irradiated Cell-derived Exosomes Enhance Cell Proliferation and Radioresistance via the MAPK/Erk Pathway.Cancer Genomics Proteomics. 2024 Jan-Feb;21(1):12-17. doi: 10.21873/cgp.20425. Cancer Genomics Proteomics. 2024. PMID: 38151290 Free PMC article.
-
The function of exosomes in ovarian granulosa cells.Cell Tissue Res. 2023 Nov;394(2):257-267. doi: 10.1007/s00441-023-03820-3. Epub 2023 Aug 21. Cell Tissue Res. 2023. PMID: 37603064 Review.
-
Overview of Nrf2 as a target in ovary and ovarian dysfunctions focusing on its antioxidant properties.J Ovarian Res. 2025 Mar 22;18(1):60. doi: 10.1186/s13048-025-01639-w. J Ovarian Res. 2025. PMID: 40121445 Free PMC article. Review.
References
Publication types
MeSH terms
Substances
Grants and funding
LinkOut - more resources
Full Text Sources
Other Literature Sources
Miscellaneous
