. 2021 Sep;74(3):1203-1219.
doi: 10.1002/hep.31771. Epub 2021 May 22.

Liver-Specific Deletion of Mouse Tm6sf2 Promotes Steatosis, Fibrosis, and Hepatocellular Cancer

Affiliations

Liver-Specific Deletion of Mouse Tm6sf2 Promotes Steatosis, Fibrosis, and Hepatocellular Cancer

Elizabeth P Newberry et al. Hepatology. 2021 Sep.

Abstract

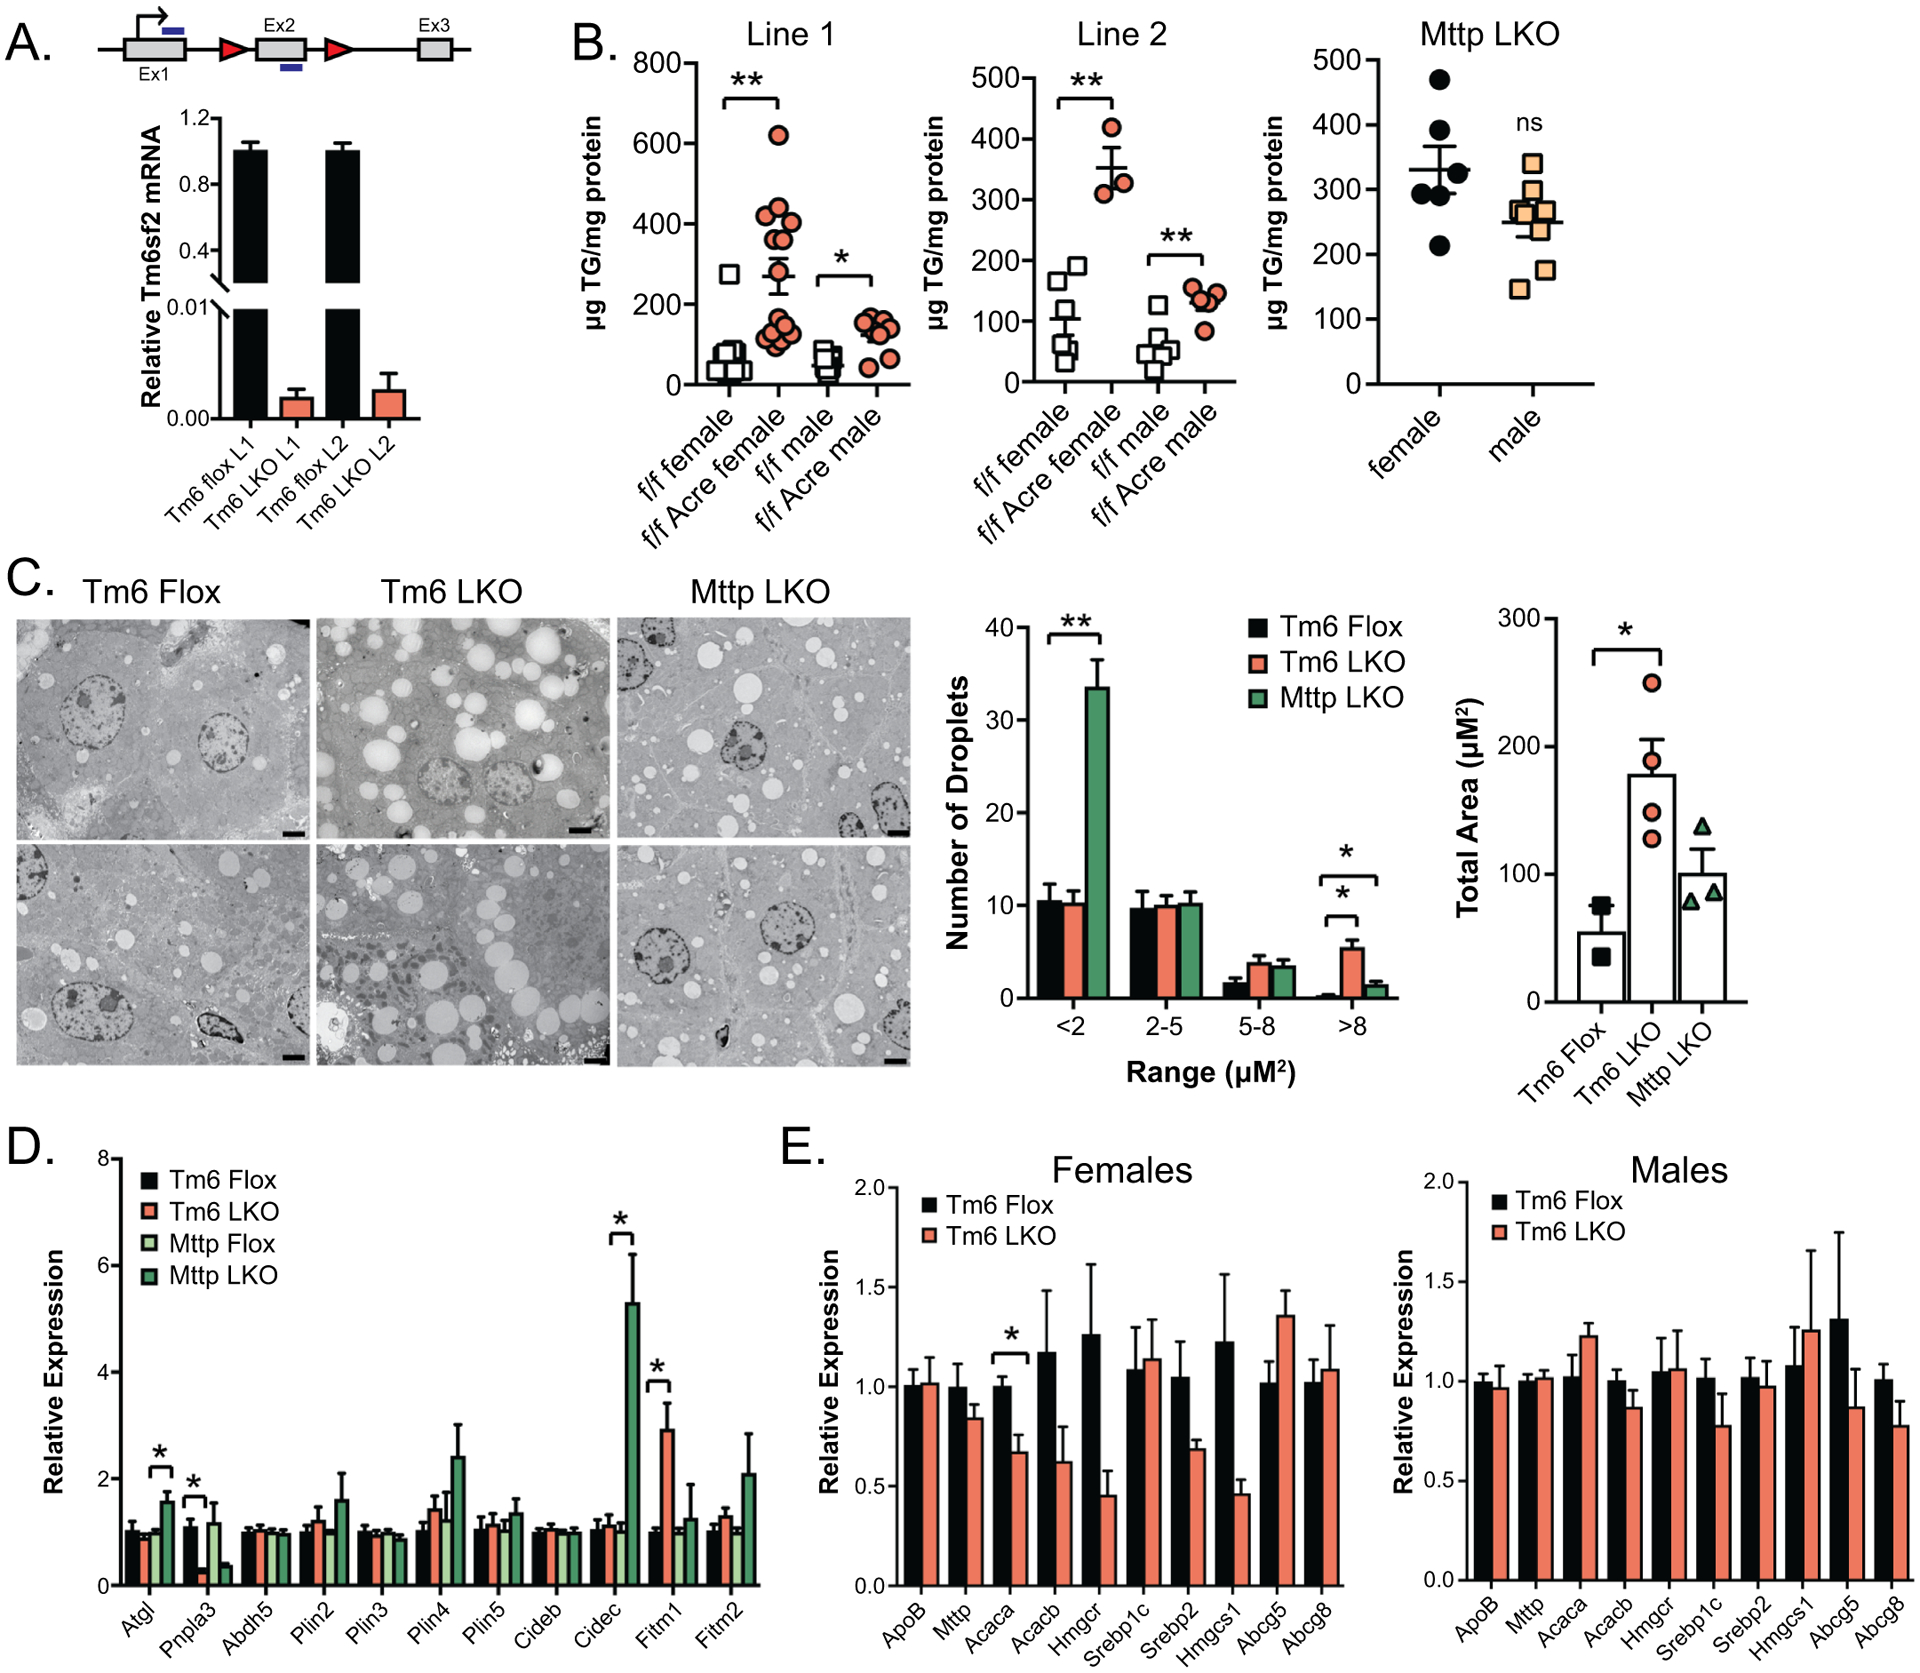
Background and aims: Human transmembrane 6 superfamily 2 (TM6SF2) variant rs58542926 is associated with NAFLD and HCC. However, conflicting reports in germline Tm6sf2 knockout mice suggest no change or decreased very low density lipoprotein (VLDL) secretion and either unchanged or increased hepatic steatosis, with no increased fibrosis. We generated liver-specific Tm6Sf2 knockout mice (Tm6 LKO) to study VLDL secretion and the impact on development and progression of NAFLD.

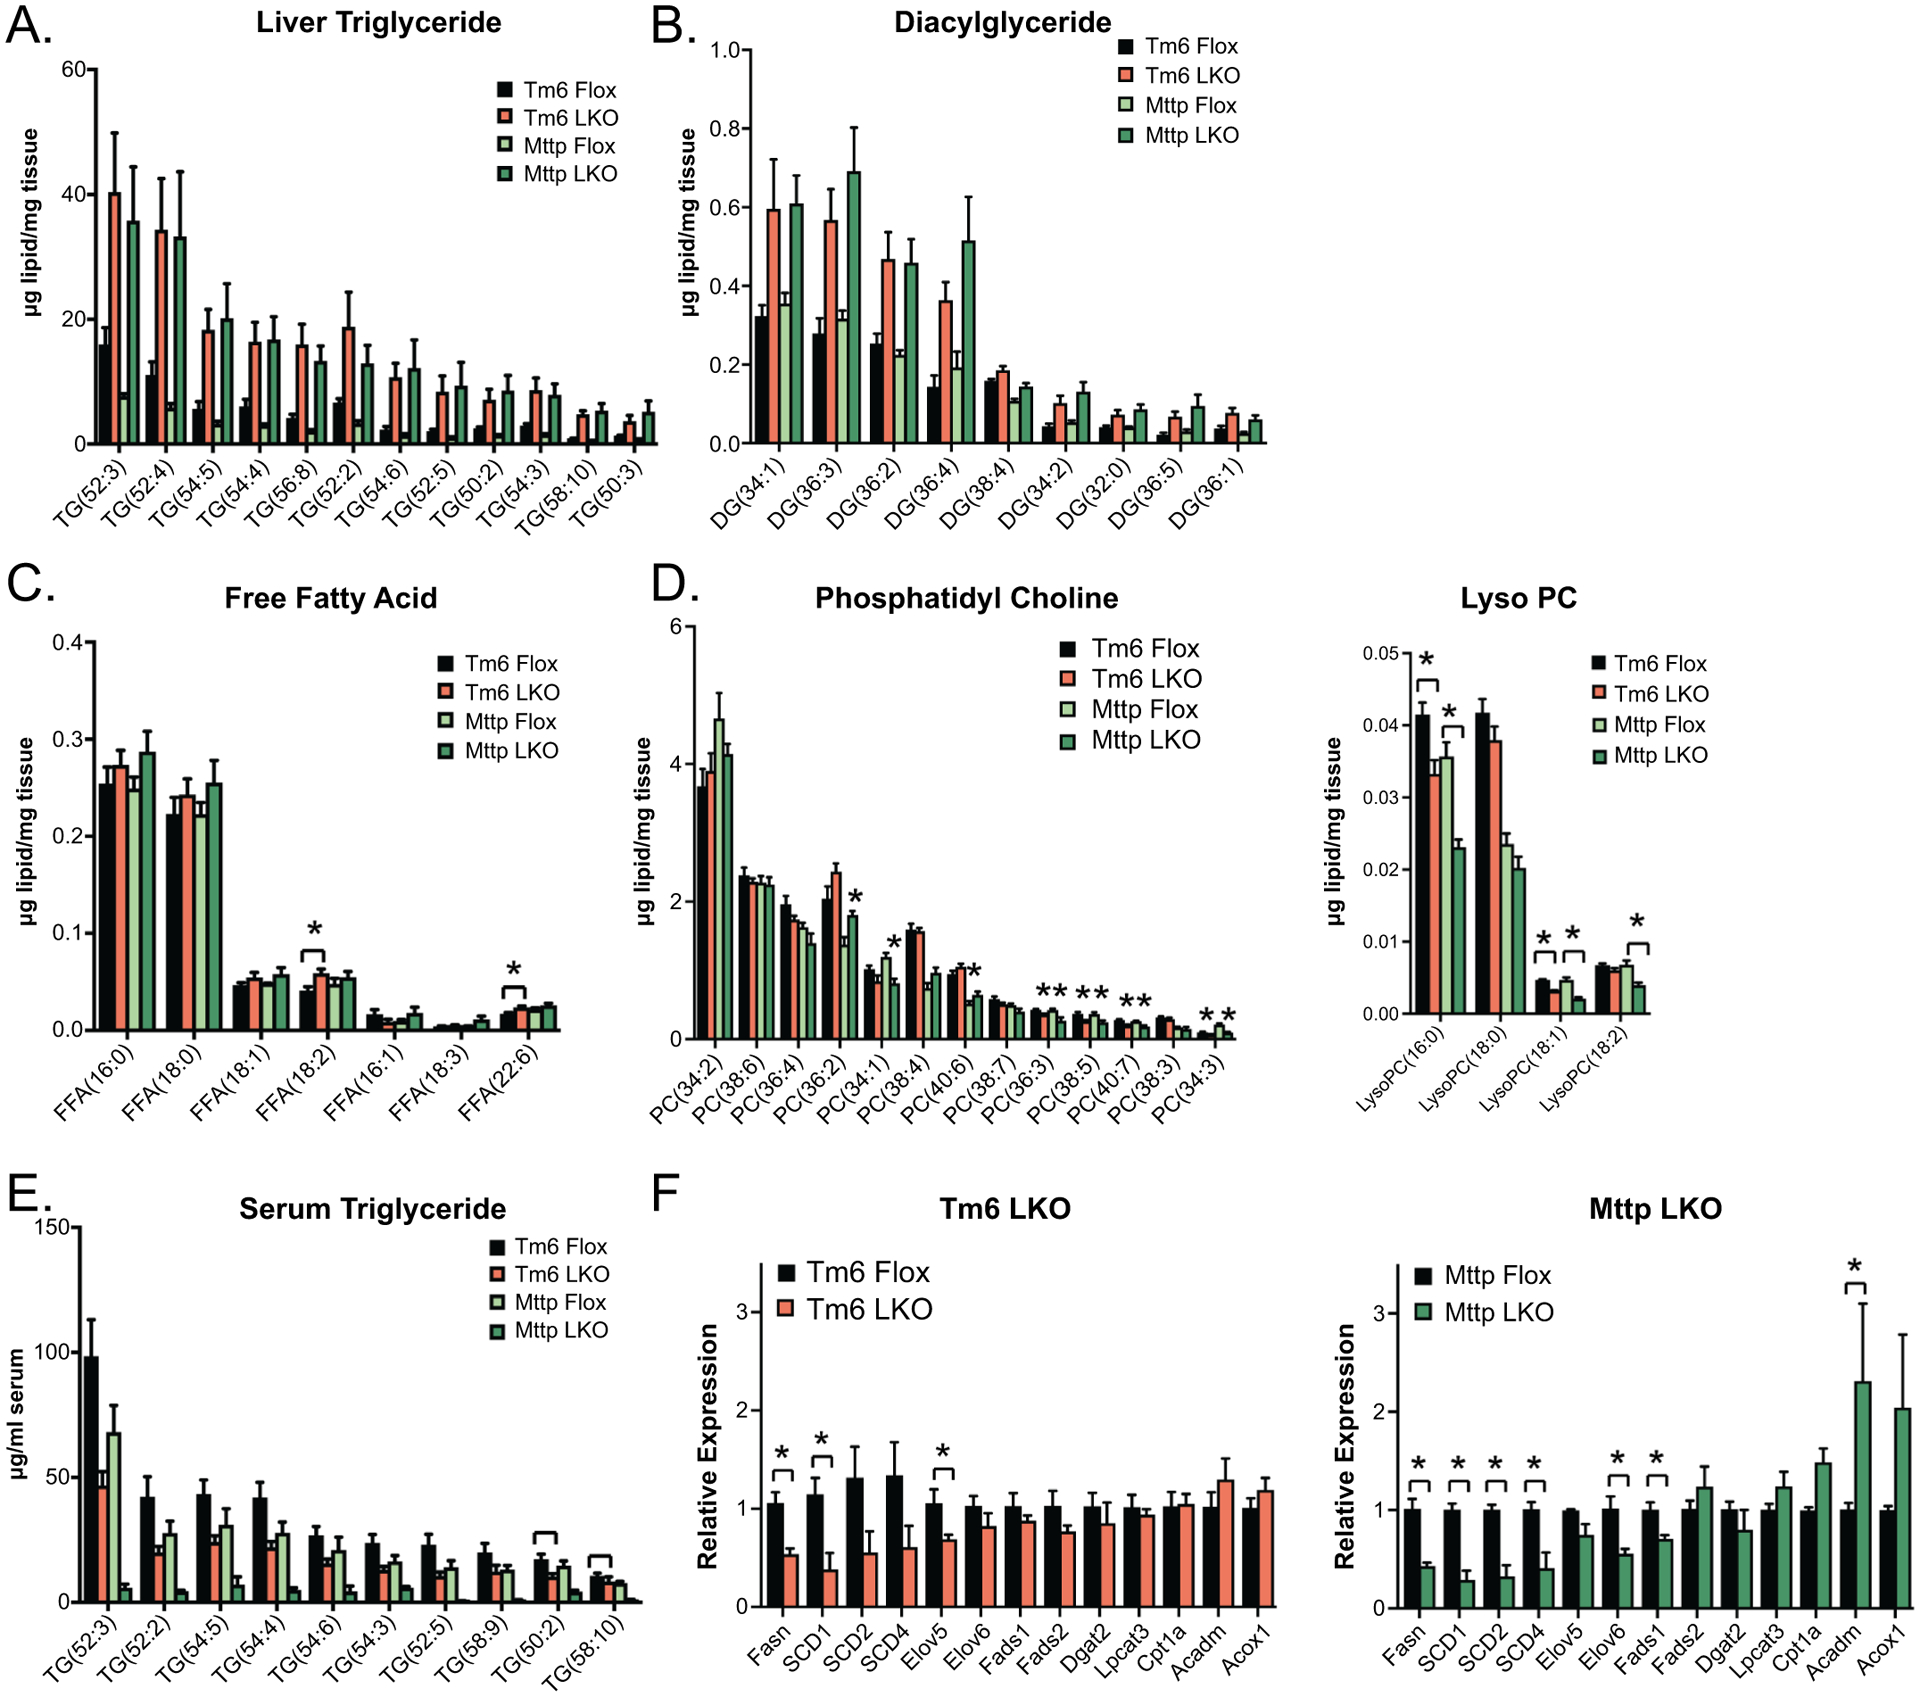
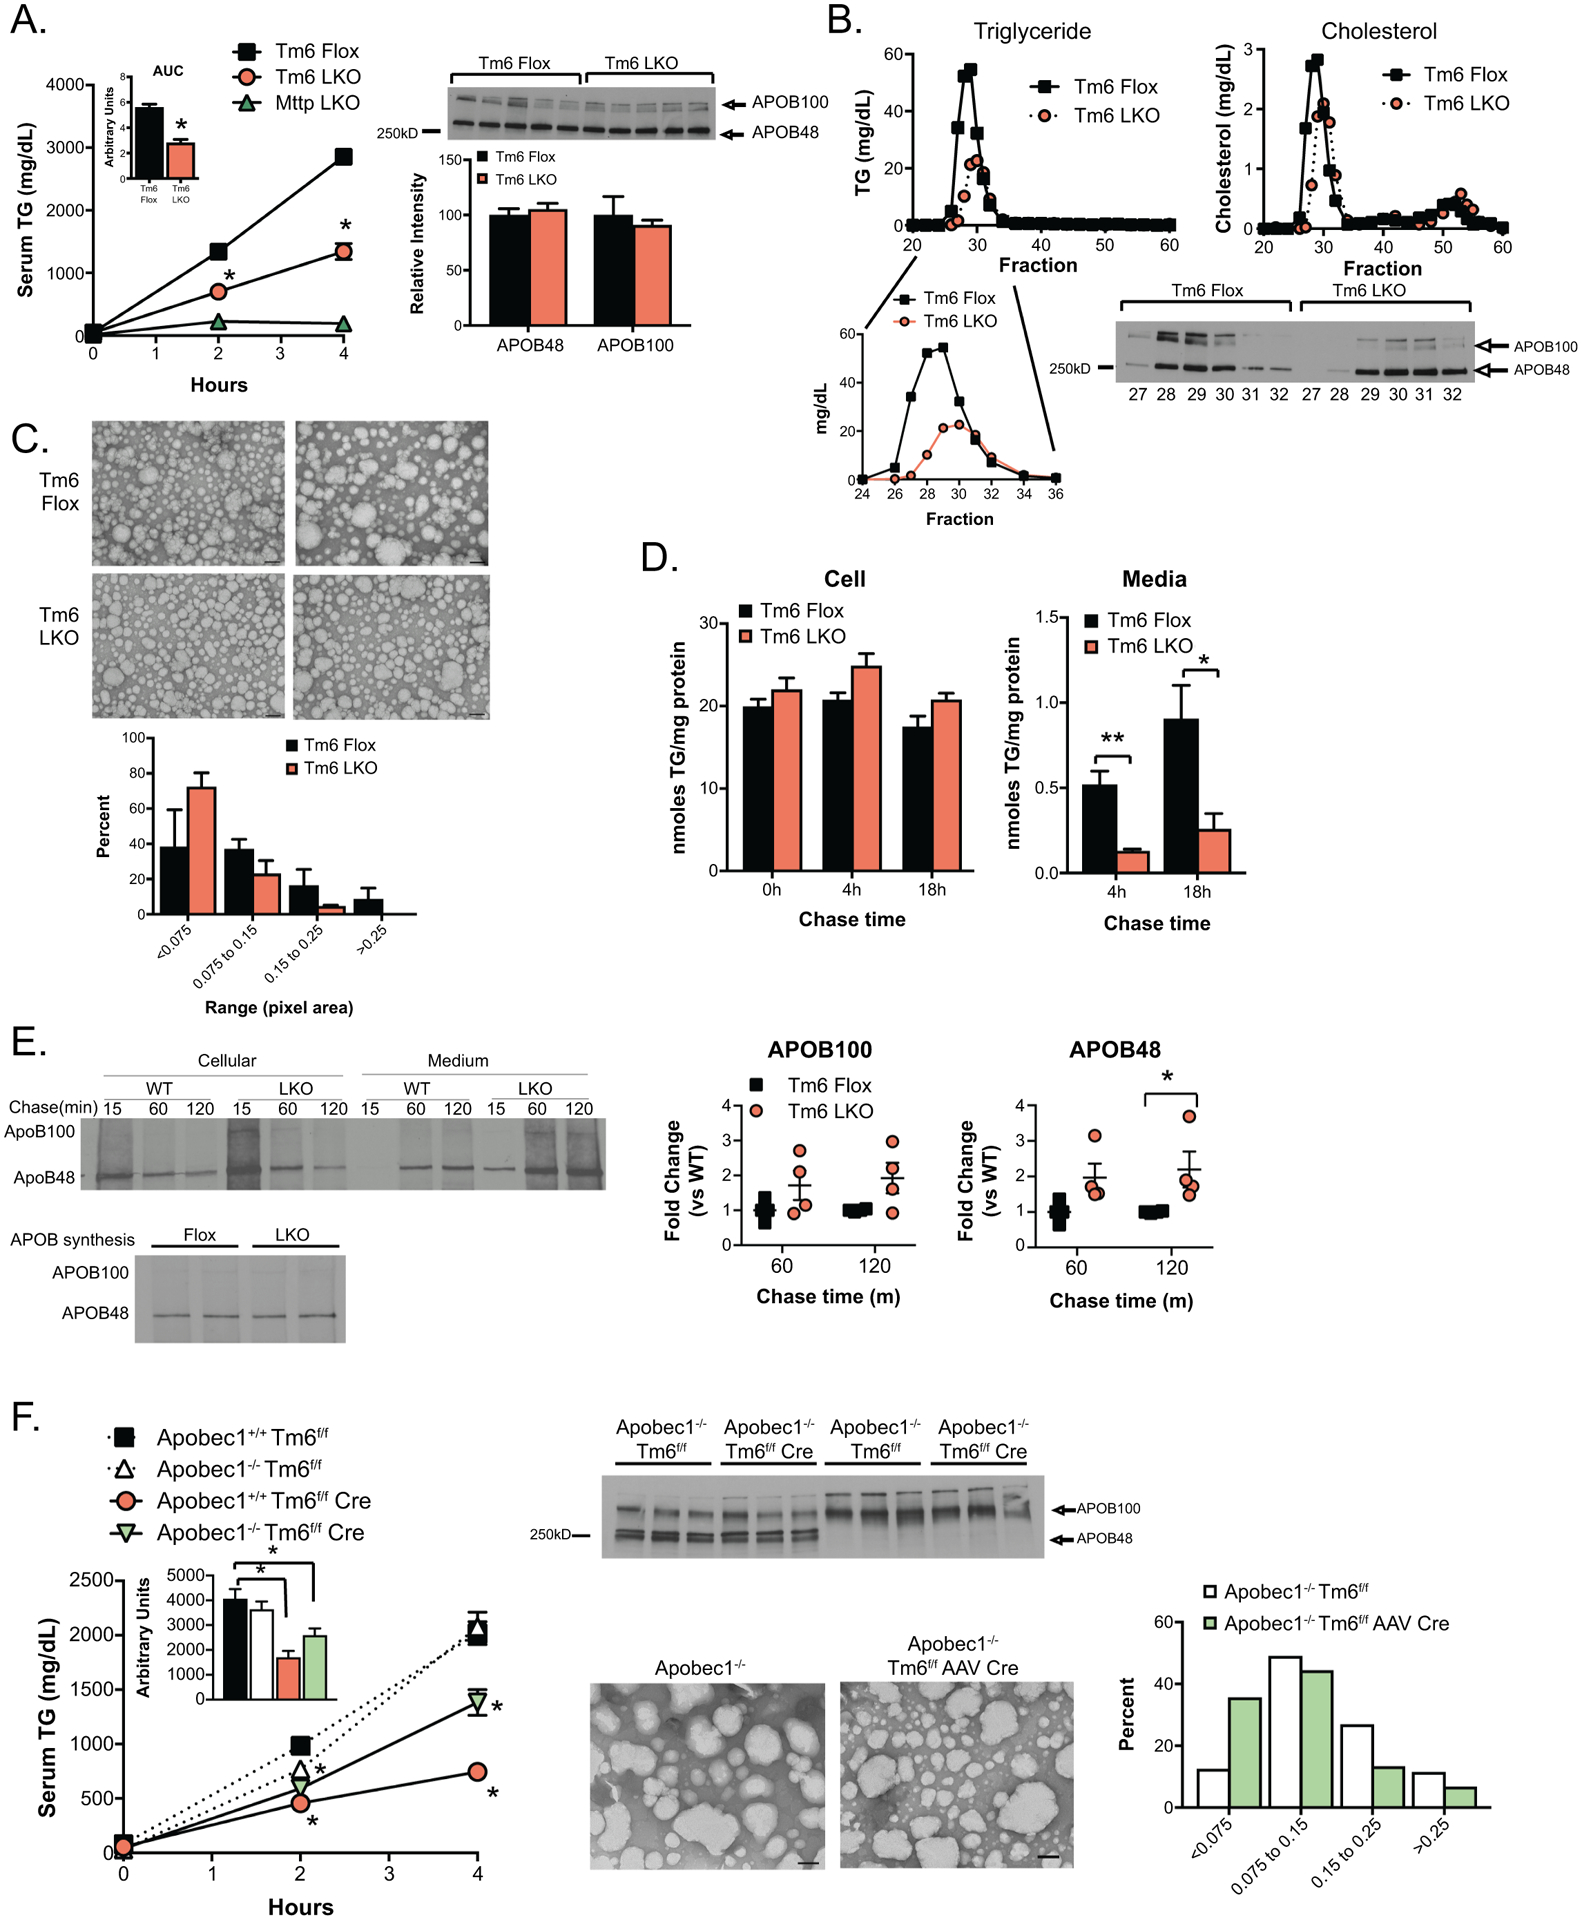
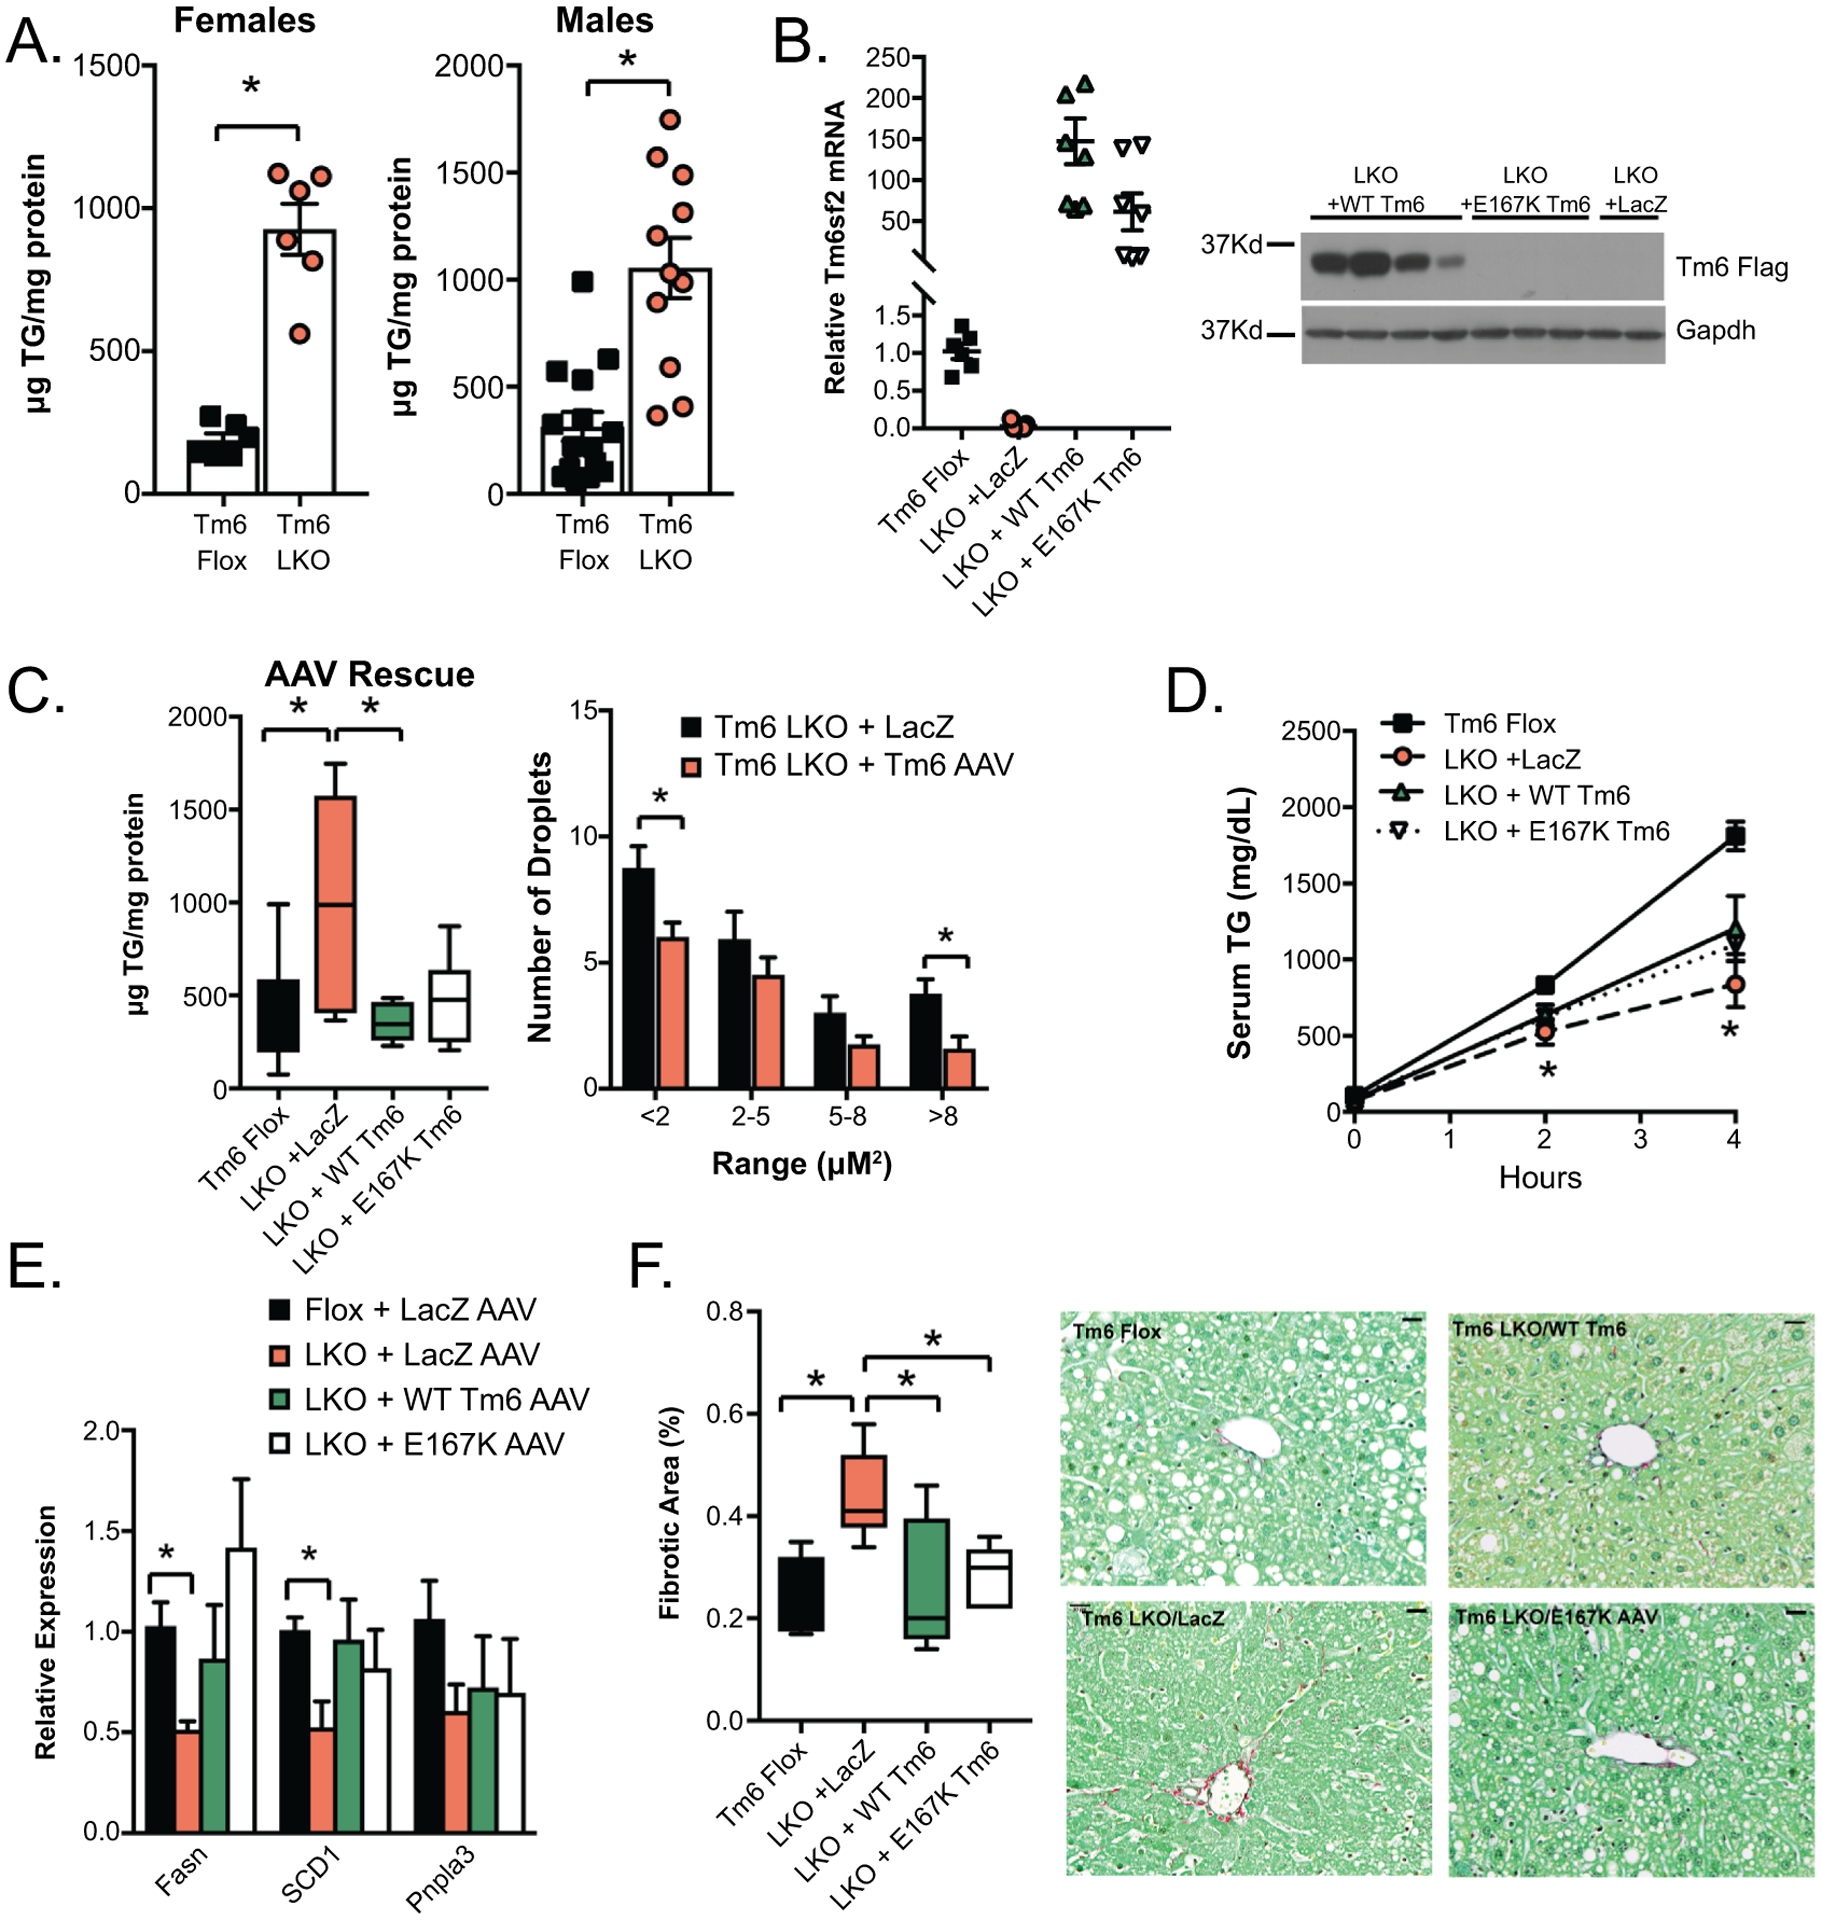
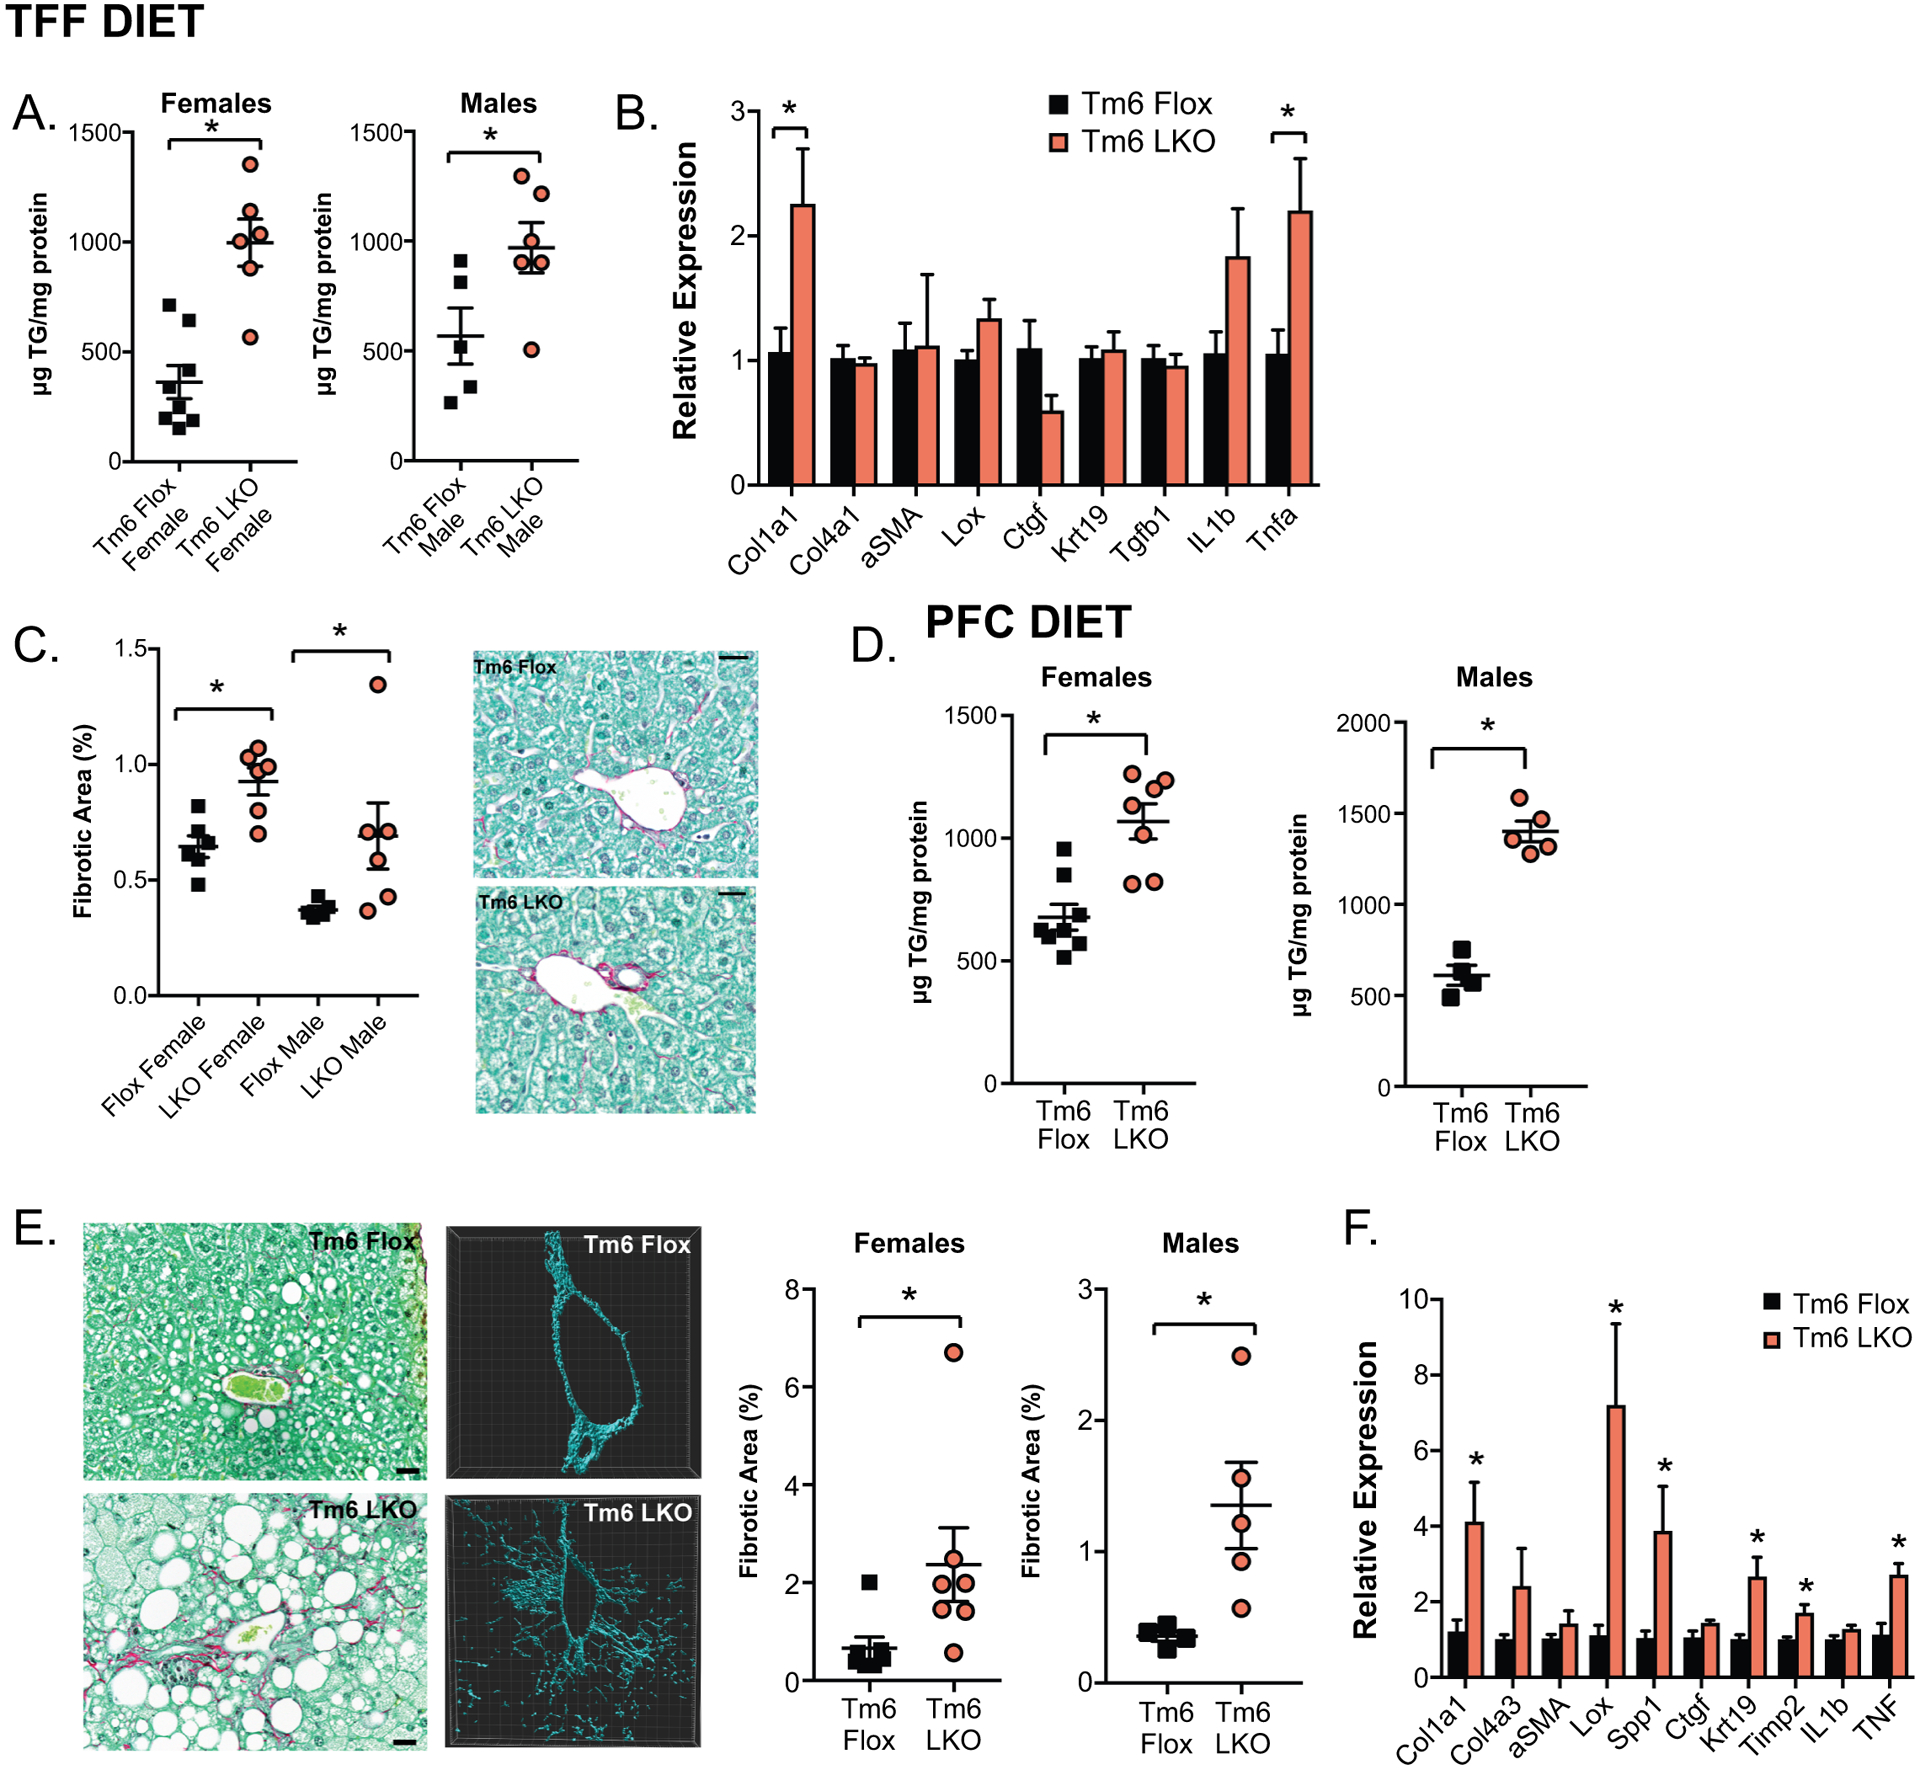
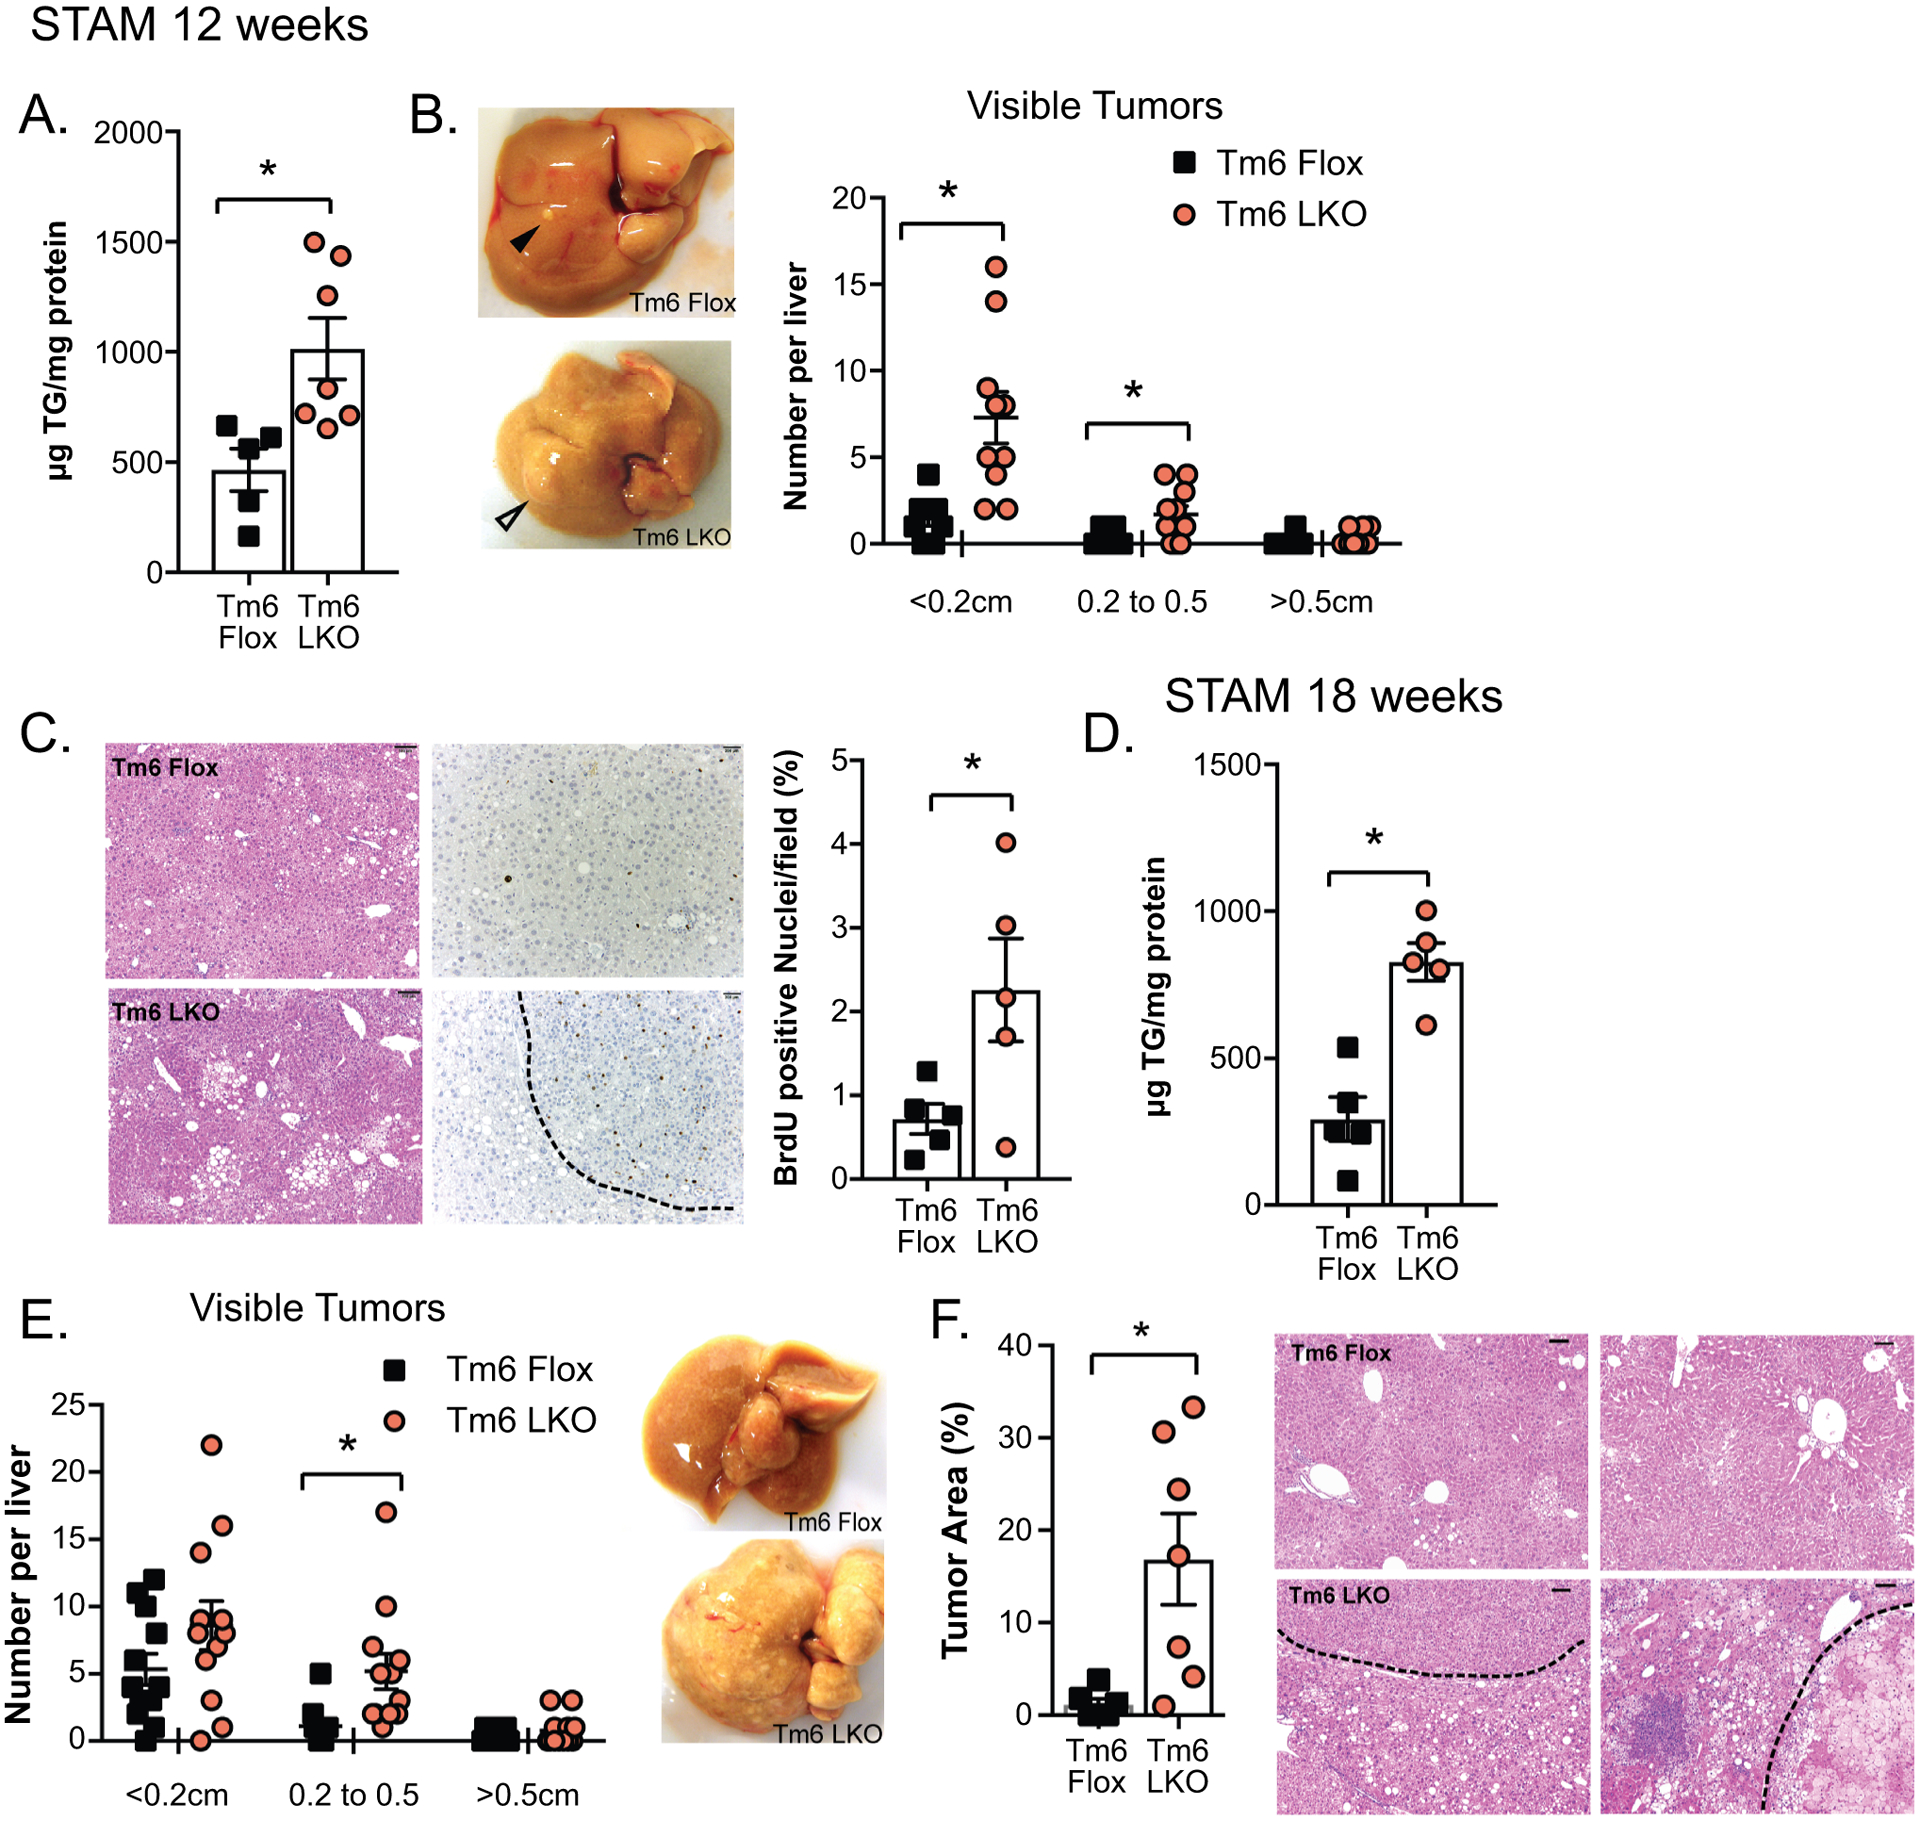
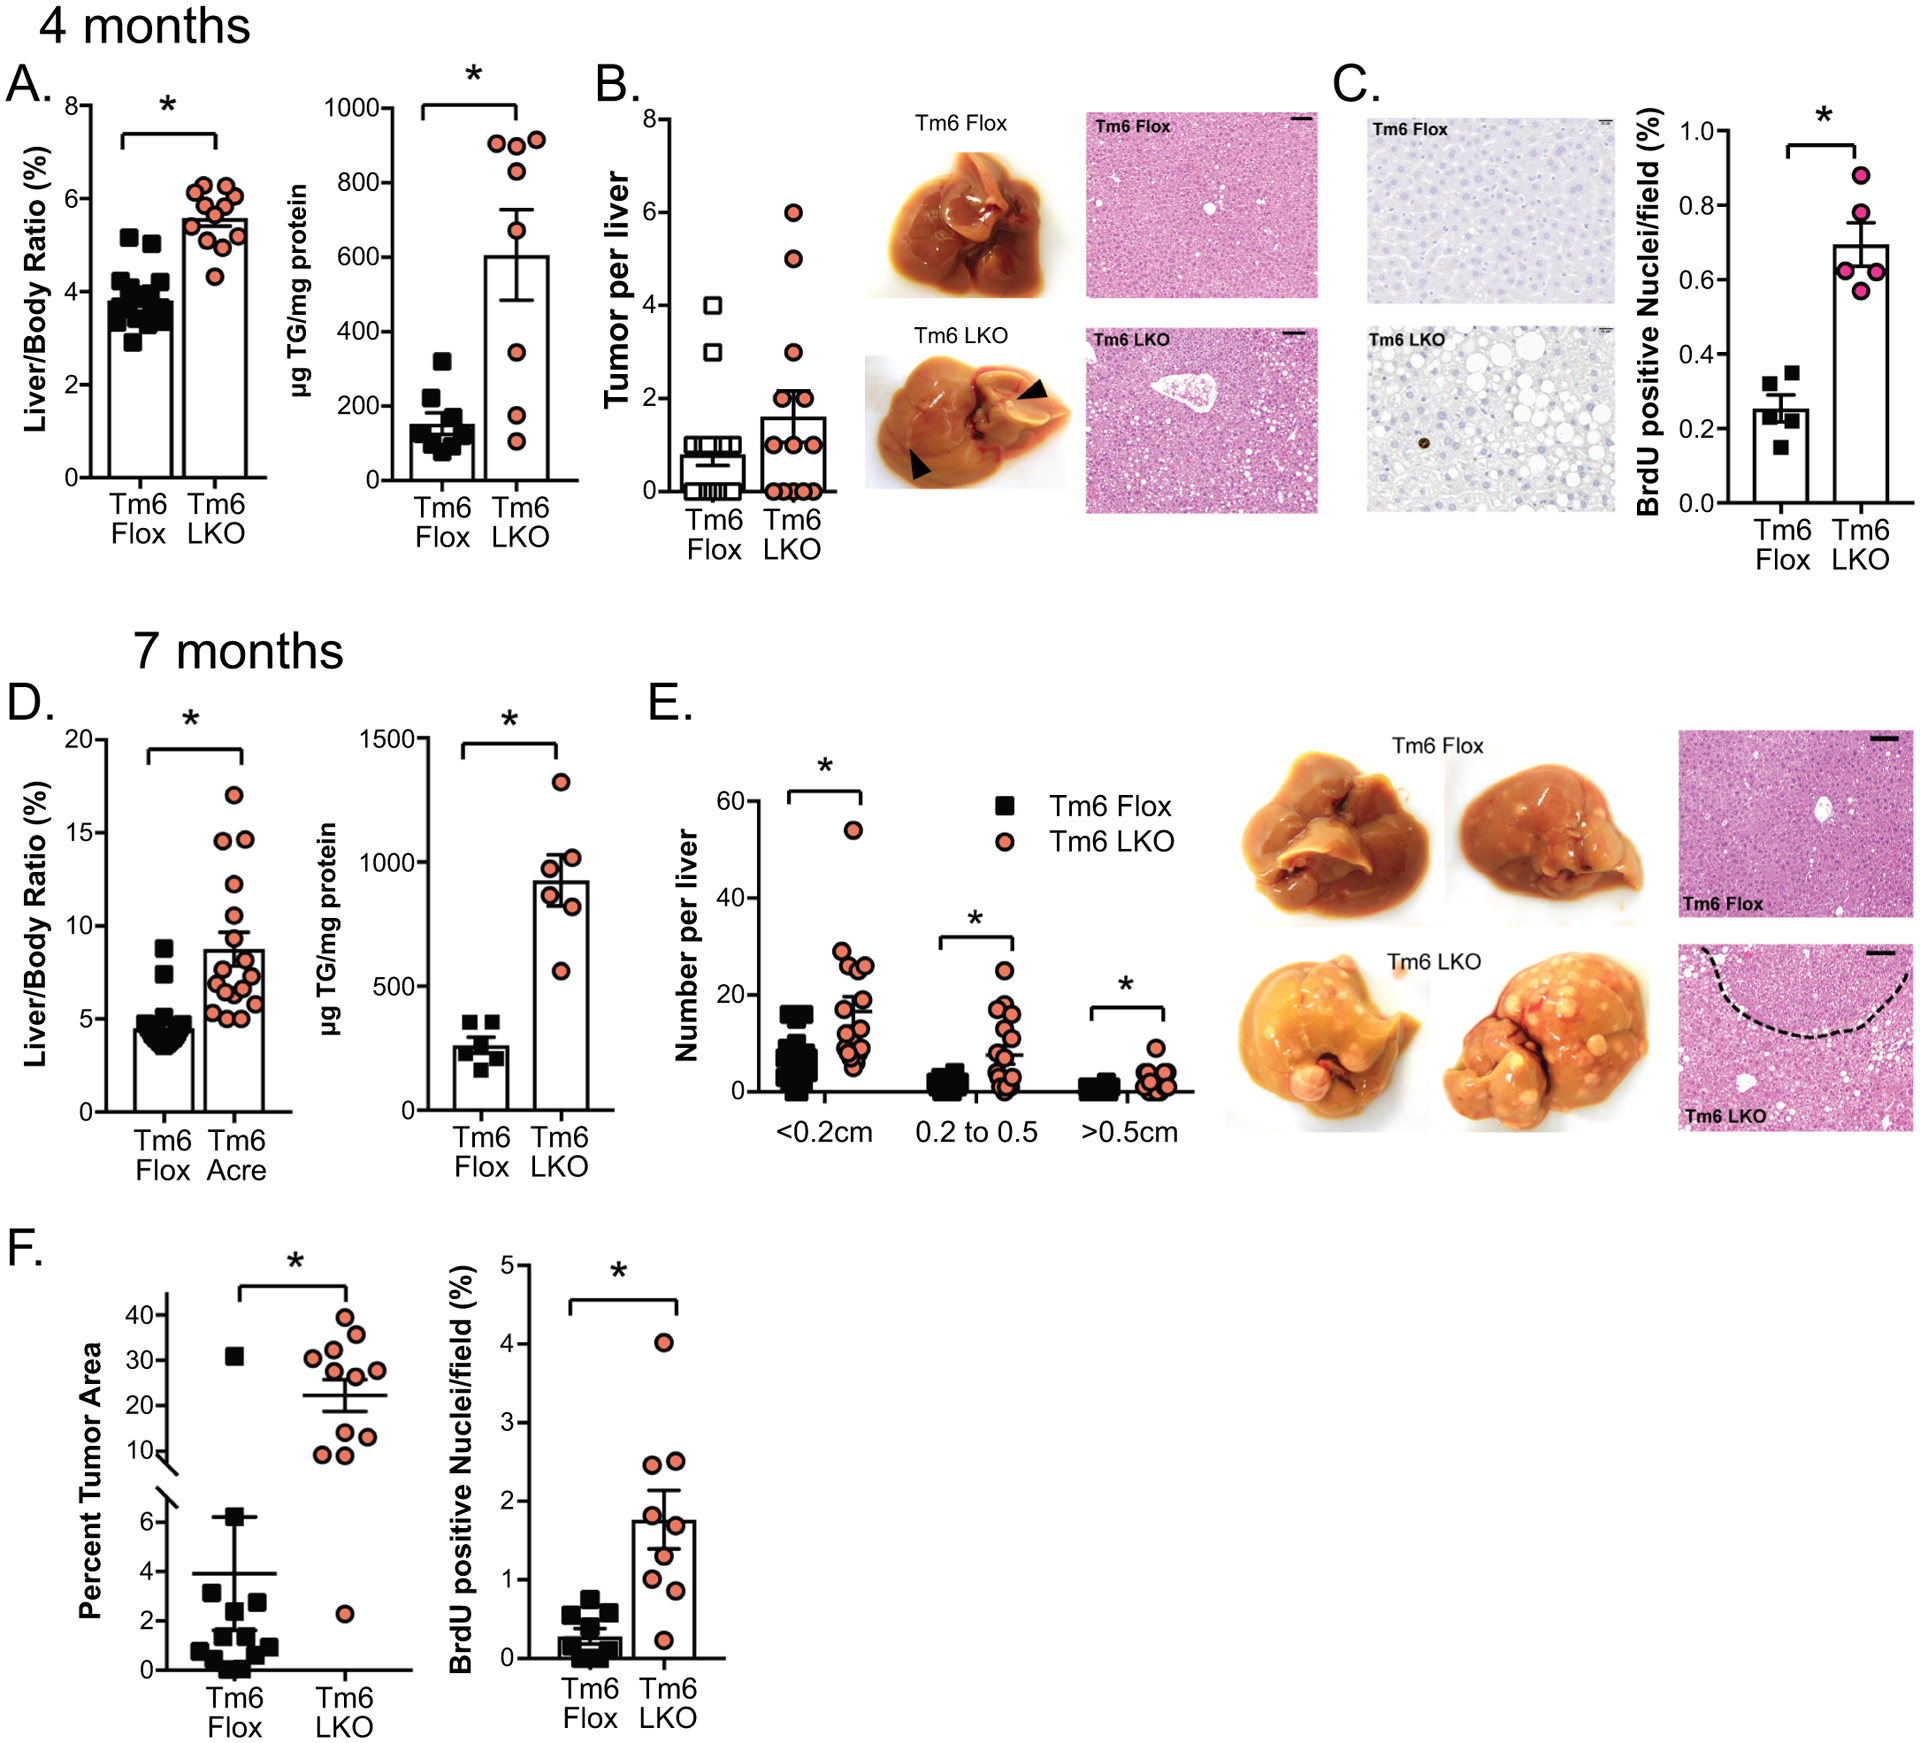
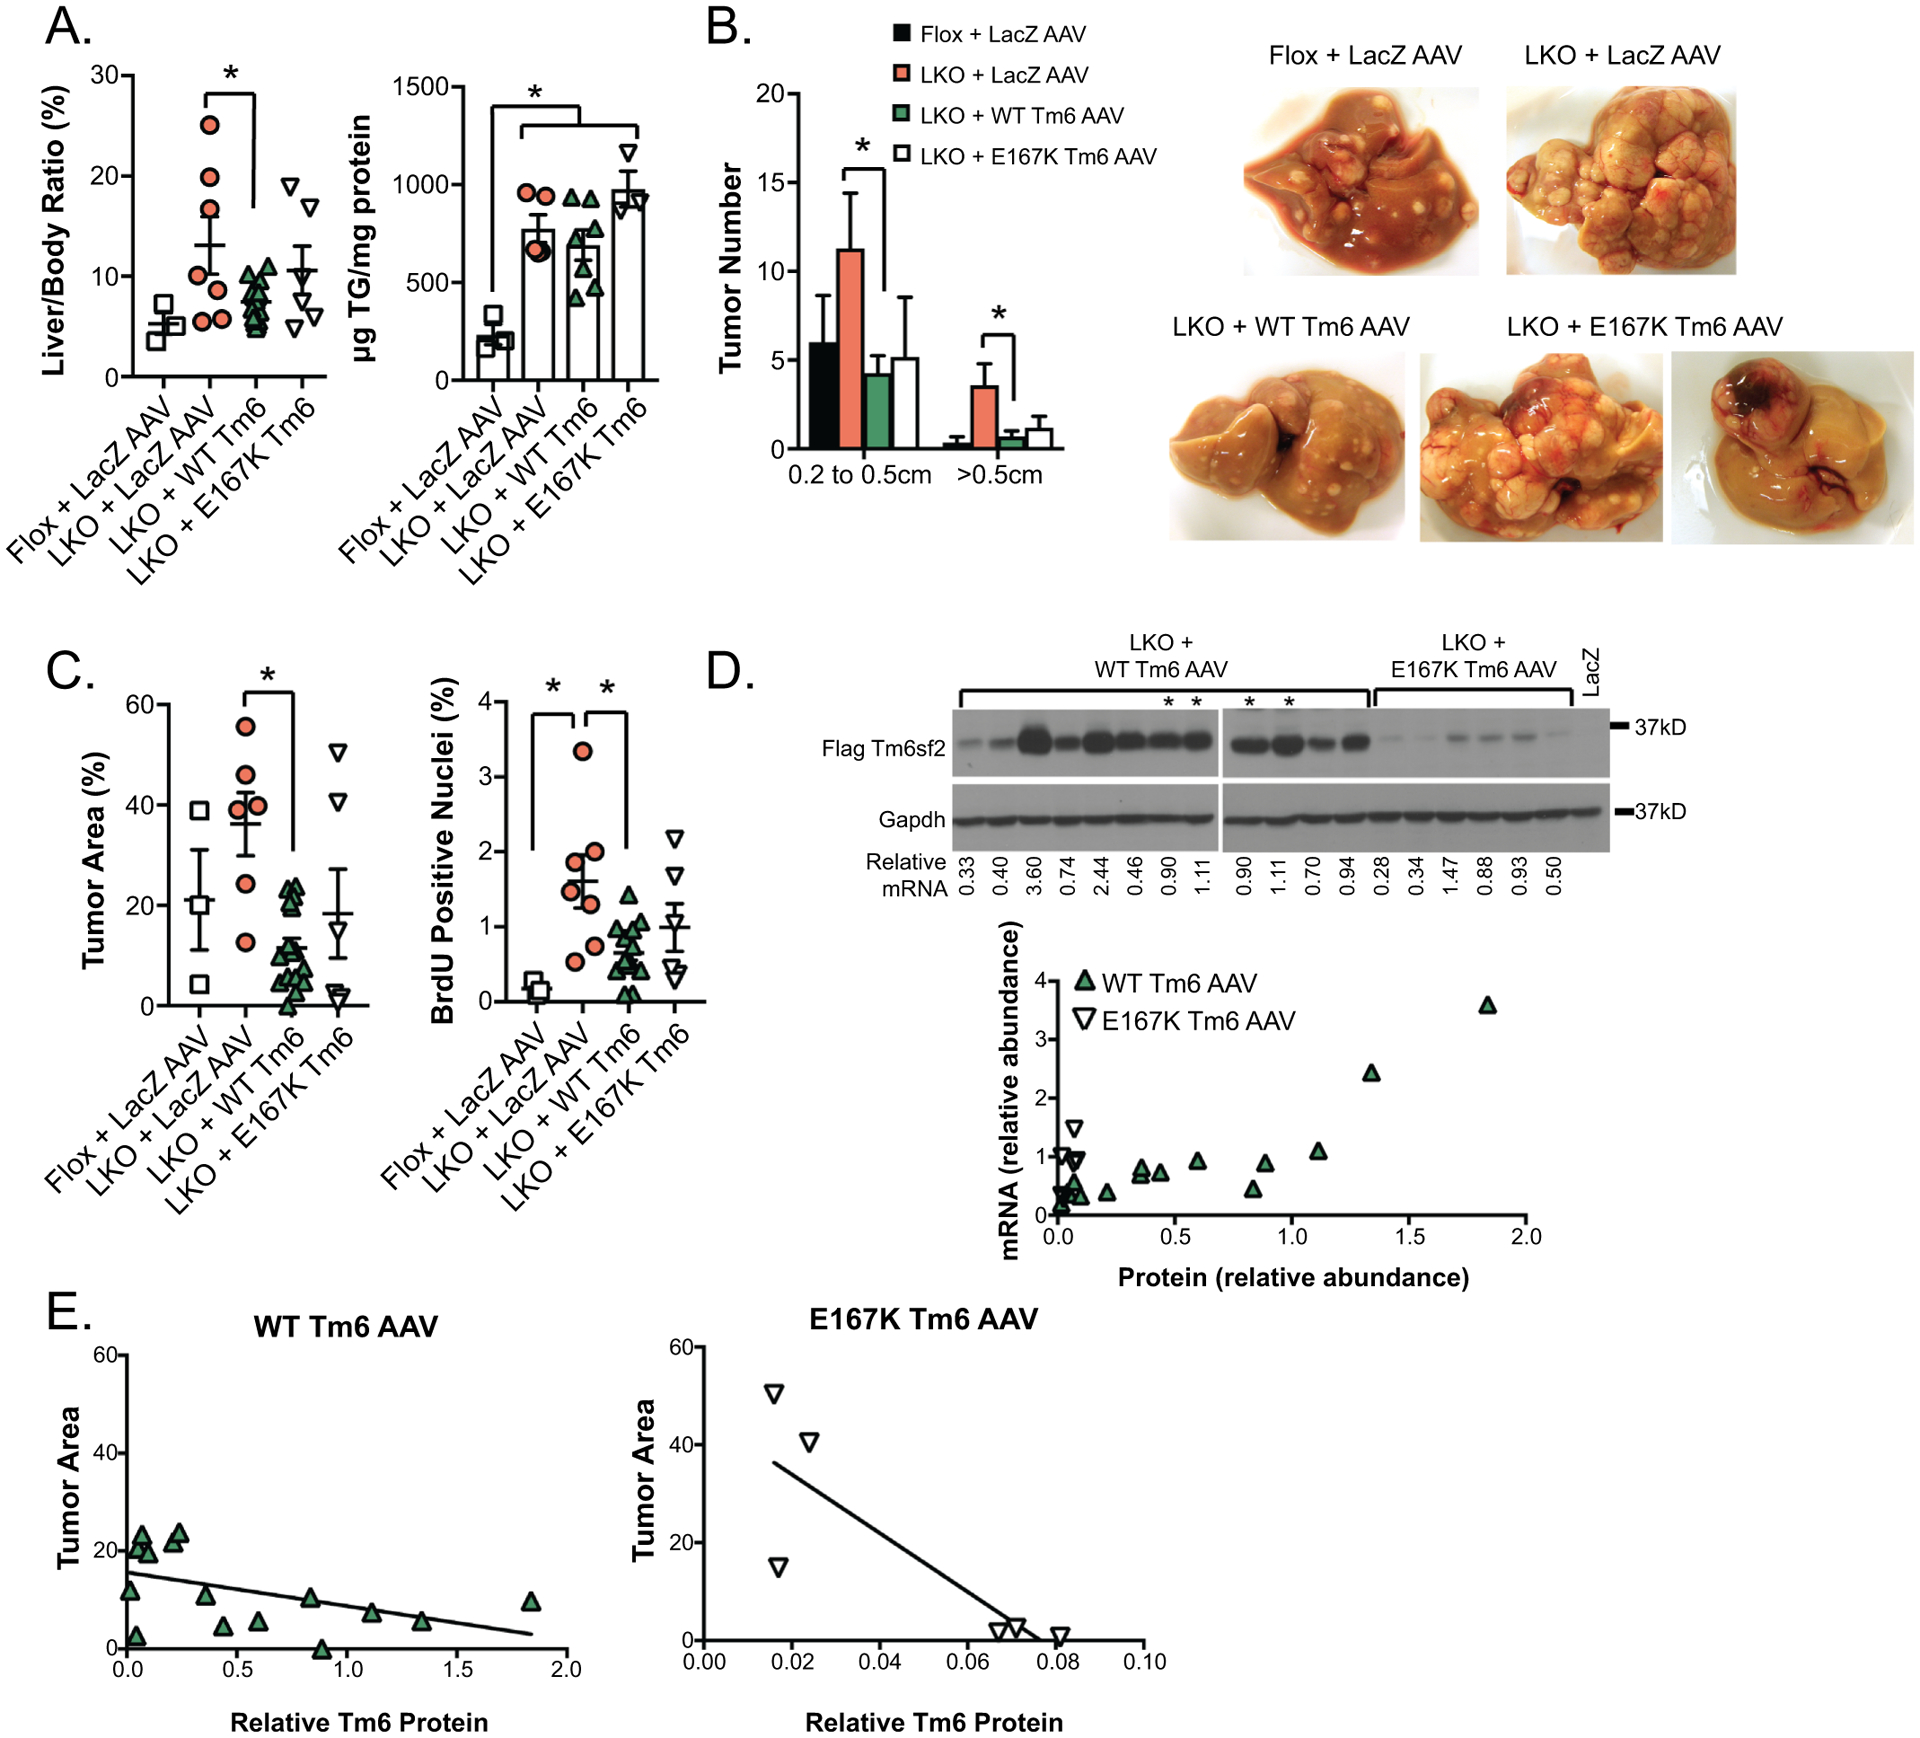
Approach and results: Two independent lines of Tm6 LKO mice exhibited spontaneous hepatic steatosis. Targeted lipidomic analyses showed increased triglyceride species whose distribution and abundance phenocopied findings in mice with liver-specific deletion of microsomal triglyceride transfer protein. The VLDL triglyceride secretion was reduced with small, underlipidated particles and unchanged or increased apolipoprotein B. Liver-specific adeno-associated viral, serotype 8 (AAV8) rescue using either wild-type or mutant E167K-Tm6 reduced hepatic steatosis and improved VLDL secretion. The Tm6 LKO mice fed a high milk-fat diet for 3 weeks exhibited increased steatosis and fibrosis, and those phenotypes were further exacerbated when mice were fed fibrogenic, high fat/fructose diets for 20 weeks. In two models of HCC, either neonatal mice injected with streptozotocin (NASH/STAM) and high-fat fed or with diethylnitrosamine injection plus fibrogenic diet feeding, Tm6 LKO mice exhibited increased steatosis, greater tumor burden, and increased tumor area versus Tm6 flox controls. Additionally, diethylnitrosamine-injected and fibrogenic diet-fed Tm6 LKO mice administered wild-type Tm6 or E167K-mutant Tm6 AAV8 revealed significant tumor attenuation, with tumor burden inversely correlated with Tm6 protein levels.

Conclusions: Liver-specific Tm6sf2 deletion impairs VLDL secretion, promoting hepatic steatosis, fibrosis, and accelerated development of HCC, which was mitigated with AAV8- mediated rescue.


Figures

Figure 1:
Figure 1:
Targeting strategy and baseline characterization of Tm6 LKO mice. A. Schematic diagram of Tm6sf2 gene showing the location of Lox P recombination sites (triangles) in intronic regions surrounding Exon 2 (Ex2). Also shown is the translation initiation site (arrow) and the location of primers used to detect Tm6sf2 mRNA (blue bars). Lower panel: Relative expression of Tm6sf2 mRNA in the liver of two distinct conditional knock out lines of Tm6 Flox and Tm6 LKO mice (L1, L2; n=5–7 females/group). B. Hepatic triglyceride levels in male and female, Tm6 flox and Tm6 LKO mice from 2 distinct Tm6sf2 LKO lines (left, middle). Right panel shows hepatic triglyceride levels in male and female Mttp LKO mice for comparison. All mice are 12–14 weeks of age, fed chow diet. C. Left: Representative TEM images of intracellular lipid droplets in chow fed Tm6 Flox, Tm6 LKO and Mttp LKO liver tissue (2000x, scale bar = 2μM). Middle: Quantitation of lipid droplet size distribution in Tm6 Flox (n=2), Tm6 LKO (n=4) and Mttp LKO (n=3) female mice (6 images/mouse). Right: Average total lipid droplet area in 6 images/animal. D. Relative gene expression of lipid droplet associated proteins in Tm6 Flox, Tm6 LKO, Mttp Flox and Mttp LKO liver (chow diet females, n=4/genotype), with expression normalized to respective flox control samples. E. Baseline expression of genes involved in TG secretion, fibrogenesis, and inflammation in male and female Tm6 LKO and control mice (n=5/genotype, 12–14 weeks, chow diet). For all panels, * indicates p<0.05, ** indicates p<0.01.
Figure 2:
Figure 2:
Untargeted lipidomic characterization of indicated genotypes. A. Levels of major triglyceride species in Tm6 Flox, Tm6 LKO, Mttp Flox and Mttp LKO liver tissue. All TG species shown are significantly more abundant in mice with liver specific deletion of Tm6sf2 or Mttp versus respective control livers. N= 5–6/genotype, chow diet fed females, 12–15 weeks of age. Species shown represent >85% percent of total TG species peak area. B. Diacylglyceride species in Tm6 Flox, Tm6 LKO, Mttp Flox and Mttp LKO liver tissue. All species shown are significantly more abundant in Tm6 LKO and Mttp LKO liver tissue versus respective control livers. C. Free fatty acid species in above genotypes. Significant differences are indicated. D. Phosphatidyl choline (left panel) and lyso-phosphatidylcholine (Lyso PC) species E. Abundance of triglyceride species in serum of Tm6 Flox, Tm6 LKO, Mttp Flox and Mttp LKO mice following a 4h fast (chow diet, females). . F. Expression of genes related to fatty acid synthesis, β-oxidation and modification in Tm6 LKO and Mttp LKO liver (n=4 females/genotype, chow diet). For all panels, data are presented as mean ± SEM; asterisks indicate p<0.05 and ns indicates not significant.
Figure 3:
Figure 3:
VLDL secretion characteristics of Tm6 LKO mice. A. Serum triglyceride levels at 0, 2 and 4 hours after injection of Pluronic −127 in Tm6 Flox, Tm6 LKO, and Mttp LKO mice (n=4–5/genotype). Inset shows average area under curve for Tm6 Flox and LKO genotypes. Right: Western blot of APOB protein in 4h serum of individual Tm6 Flox and Tm6 LKO mice, with densitometric quantification shown below. B. Serum from 4h bleed (Panel A) was pooled by genotype and fractionated by FPLC to separate lipoprotein particles. Column fractions were assayed for triglyceride and cholesterol to identify VLDL- and HDL-containing fractions (Fractions 27–32 and 48–55, respectively). Lower panel: Western blot showing APOB100 and APOB48 protein in VLDL FPLC fractions. C. Size distribution of negatively stained VLDL particles isolated from Tm6 Flox and Tm6 LKO mice. Serum was pooled from 3–4 mice per genotype 4h after Pluronic injection and fractionated by density centrifugation. Data are presented as percent of total droplets in each size range and was generated from 2 independent isolations per genotype. Representative images of negatively stained VLDL particles are shown (50,000x; scale bar=100nm). D. Synthesis and secretion of [3H]-labeled triglyceride in isolated primary hepatocytes. Left: Cellular [3H]-TG levels in Tm6 Flox and LKO hepatocytes at 0h, 4h and 18 hours after labeling, normalized to cellular protein. Right: [3H]-TG in media collected 4 or 18 hours after labeling. E. Synthesis and secretion of APOB in primary hepatocytes. Top left: Newly synthesized APOB100 and APOB48 in cells or medium 15, 60 or 120 minutes after pulse labeling of Tm6 Flox (WT) and LKO hepatocytes. Bottom left: APOB synthesis in isolated hepatocytes. Right: Quantitation of APOB100 and APOB48 secretion in 3 independent experiments, normalized to APOB secretion in WT hepatocytes in each experiment. F. Effect of Tm6sf2 deletion on VLDL secretion and particle size in APOB100 and APOB48 mice. Left: Serum triglyceride in HMFD-fed Apobec1+/+ Tm6f/f, Apobec1−/- Tm6f/f, Apobec1+/+ Tm6 f/f Cre and Apobec1−/- Tm6f/f Cre mice at 0, 2 and 4 hours after Pluronic F-127 injection. Deletion of Tm6sf2 was induced by AAV Cre in Apobec1−/- mice and with Alb CreTg in Apobec1+/+ mice. Tm6f/f mice received control AAV (null or LacZ). N=4–5 animals/group, mixed genders. Middle: Serum from 4 hour timepoint was analyzed by western blot analysis to monitor levels of APOB100 and APOB48 protein, and by density centrifugation to examine VLDL particle size in Apobec1−/- Tm6f/f and Apobec1−/- Tm6f/f AAV Cre mice fed chow diet. Representative images of negatively stained VLDL particles are shown (50,000x, scale bar=100nm), with quantitative size distribution presented as percent of total droplets in each size range (right). For all panels, asterisks indicate p<0.05 versus Tm6 Flox controls.
Figure 4:
Figure 4:
Impact of high fat diet on hepatic lipid content of Tm6 LKO mice and rescue with AAV8 Tm6sf2. A. Hepatic triglyceride content in male and female Tm6 Flox and Tm6 LKO mice fed HMFD for 3 weeks (female, n=6/genotype; male, n= 11–15). A similar phenotype was found using Tm6 LKO line 2. B. AAV-mediated expression of Flag Tm6sf2. Left: Relative expression of Tm6 mRNA in livers of Tm6 LKO mice (n=6–8/group) transduced with LacZ AAV, WT Tm6 AAV, or E167K AAV, normalized to expression of endogenous Tm6sf2 in Tm6 Flox livers. All groups are significantly different compared to flox controls. Right: Western blot showing expression of Flag tagged Tm6 in AAV transduced liver tissue using anti-Flag antibody. Expression of Gapdh protein is shown as a loading control. C. Left: Hepatic TG content in liver of HMFD- fed Tm6 Flox and Tm6 LKO mice transduced with AAV constructs (n=6–10 males/group). Right: Quantitation of lipid droplet size in Tm6 LKO mice transduced with Lac Z or WT Tm6 AAV. D. VLDL secretion in HMFD- fed male and female Tm6 Flox and Tm6 LKO mice transduced with Lac Z, Tm6 WT, and E167K AAV (n=3–4/group). E. Expression of lipogenic genes in Tm6 Flox and AAV-transduced LKO mice fed HMFD (n=5–7 animals/group). F. Sirius red stained fibrotic area in Tm6 Flox and Tm6 LKO mice transduced with AAV (n=5–6/group). Representative images are shown (400x magnification, scale bar = 20μM). For all panels, asterisks indicate p<0.05.
Figure 5:
Figure 5:
Impact of high fat, fibrogenic diet on Tm6 LKO mice. A. Hepatic triglyceride in male and female (left) Tm6 Flox and Tm6 LKO mice fed a transfat fructose (TFF) diet for 20 weeks (n=5–8/group). Similar findings were obtained using an independent line of Tm6 LKO mice (not shown) B. Fibrogenic and inflammatory gene expression in female mice fed TFF diet (n=5–6/genotype). C. Sirius red stained fibrotic area in male and female mice fed TFF diet (n=5–6/group), with representative images shown (40x, scale bar= 20μm). D. Hepatic triglyceride in male and female (left) mice fed a palm oil/ fructose/ cholesterol (PFC) containing diet for 20 weeks (n=5–8/group). E. Representative images of periportal fibrosis in PFC fed femaleTm6 Flox and LKO livers using Sirius red staining and second-harmonic generation microscopy (middle) to visualize collagen fibers. Fibrotic area (right) was quantitated from the Sirius red stained sections (n=7/genotype, scale bar = 20μm). F. Fibrogenic and inflammatory gene expression in livers of female Tm6 Flox and LKO mice fed PFC diet (n=5/genotype). For all panels, asterisks indicate p<0.05 versus flox controls.
Figure 6.
Figure 6.
Effect of STAM model on hepatic tumorigenesis in Tm6 LKO mice. A. Hepatic triglyceride content in STAM model Tm6 Flox and Tm6 LKO mice at 12 weeks of age (n=5–7mice/genotype). B. Distribution of visible tumors in Tm6 Flox and LKO STAM mice at 12 weeks (n=10–12/genotype). Representative images are shown (right). C. H&E staining (left) and BrdU immunohistochemistry in STAM liver tissue (12 weeks) showing regions of dysplasia and proliferation (H&E images at 100x, scale bar = 100μM; BrdU images at 200x, scale bar= 50μM). Right panel shows BrdU positive nuclei, expressed as percent of total hepatocyte nuclei, per field. Nuclei were counted in at least 10 images per animal, taken from 3–4 distinct pieces of tissue. D. Hepatic triglyceride content in STAM model mice at 18 weeks of age (n=5/genotype). E. Distribution of visible tumors at 18 weeks of age. N=12/genotype. F. Tumor area expressed as a percent of total tissue area (n=6–7 mice/genotype, with 10–12 images per animal). Representative images are shown (100x, scale bar=100μM).
Figure 7.
Figure 7.
Effect of DEN induced tumorigenesis in Tm6 LKO mice. A. Liver size and triglyceride content in Tm6 Flox and Tm6 LKO mice in the DEN high fat diet model at 4 months of age (n=20 flox, 13 LKO for liver size; n=8/genotype for TG). B. Average number of visible tumors at 4 months (n=13–20/genotype), with representative livers and H&E images shown (100x, scale bar = 100μM). C. BrdU incorporation in liver tissue of DEN treated animals at 4 months. Left: BrdU images at 400x, scale bar=20μM. Right: Quantitation of BrdU positive hepatocytes, expressed as a percent of total hepatocyte nuclei per field. D. Liver size and triglyceride content of mice in DEN high fat model at 7 months of age (n=30 flox, 23 LKO for liver size; n=6/genotype for TG). E. Size distribution of visible tumors in DEN high fat mice at 7 months, with representative livers and H&E images shown (100x, scale bar=100μm). F. Quantitation of tumor area and BrdU positive nuclei in Tm6 Flox and Tm6 LKO mice in DEN high fat model at 7 months. For all panels, asterisks indicate p<0.05 vs controls.
Figure 8.
Figure 8.
Rescue of DEN induced hepatic tumorigenesis with AAV8 delivery of Tm6sf2. A. Liver size (left, normalized to body weight) and hepatic TG content in DEN high fat diet mice injected with AAV. N=3 Tm6 Flox + LacZ AAV, n=6–10 Tm6 LKO mice + AAV, sacrificed at 7 months. B. Distribution of larger visible tumors at 7 months. Tumors smaller than 2mm were too numerous to precisely count. Representative images of livers are shown, including livers of 2 Tm6 LKO + E167K AAV to show variability. C. Average tumor area (left) and BrdU incorporation in DEN high fat diet Tm6 Flox and Tm6 LKO mice + AAV at 7 months. D. Western blot with anti-FLAG antibody showing expression of Tm6sf2 protein in livers of DEN high fat Tm6 LKO mice injected with WT Tm6 or E167K Tm6 AAV. Gapdh protein is shown as a loading control. Relative exogenous Tm6sf2 mRNA levels are shown below the blot, with expression of both protein and mRNA normalized to expression in 2 reference samples (marked with asterisks on western blot, and loaded on both gels). In reference samples, exogenous Tm6sf2 mRNA is expressed at levels that are 60- and 74-fold higher (respectively) than endogenous Tm6sf2 (data not shown). Lower panel shows direct correlation between abundance of Tm6sf2 mRNA and protein in mice receiving WT AAV (closed triangles), but not in mice expression E167K AAV (open triangles). E. Inverse correlation between Tm6sf2 protein expression and tumor area in both Tm6 LKO + WT Tm6 AAV (left) and Tm6 LKO + E167K Tm6 AAV.

Comment in

Similar articles

Cited by

References

    1. Cotter TG, Rinella M. Nonalcoholic Fatty Liver Disease 2020: The State of the Disease. Gastroenterology 2020;158:1851–1864. - PubMed
    1. Sookoian S, Pirola CJ, Valenti L, Davidson NO. Genetic Pathways in Nonalcoholic Fatty Liver Disease: Insights From Systems Biology. Hepatology 2020;72:330–346. - PMC - PubMed
    1. Trepo E, Valenti L. Update on NAFLD genetics: From new variants to the clinic. J Hepatol 2020;72:1196–1209. - PubMed
    1. Krawczyk M, Liebe R, Lammert F. Toward Genetic Prediction of Nonalcoholic Fatty Liver Disease Trajectories: PNPLA3 and Beyond. Gastroenterology 2020;158:1865–1880 e1861. - PubMed
    1. Di Filippo M, Moulin P, Roy P, Samson-Bouma ME, Collardeau-Frachon S, Chebel-Dumont S, Peretti N, et al.Homozygous MTTP and APOB mutations may lead to hepatic steatosis and fibrosis despite metabolic differences in congenital hypocholesterolemia. J Hepatol 2014;61:891–902. - PubMed

Publication types

MeSH terms