

Paeoniflorin attenuates DHEA-induced polycystic ovary syndrome via inactivation of TGF-β1/Smads signaling pathway in vivo
- PMID: 33638949
- PMCID: PMC7993663
- DOI: 10.18632/aging.202564
Paeoniflorin attenuates DHEA-induced polycystic ovary syndrome via inactivation of TGF-β1/Smads signaling pathway in vivo
Abstract
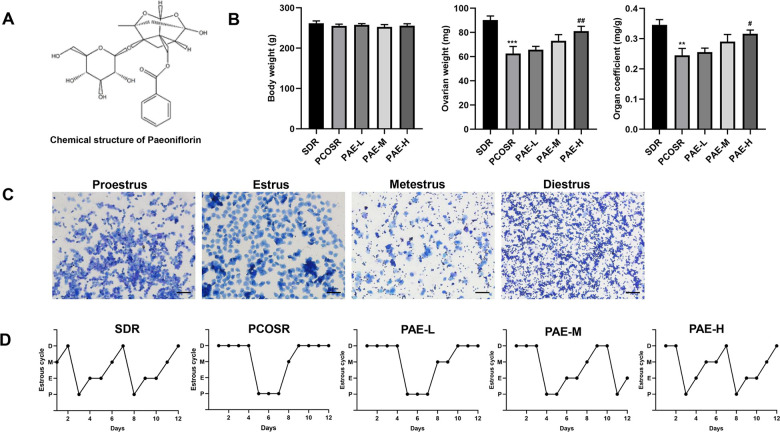
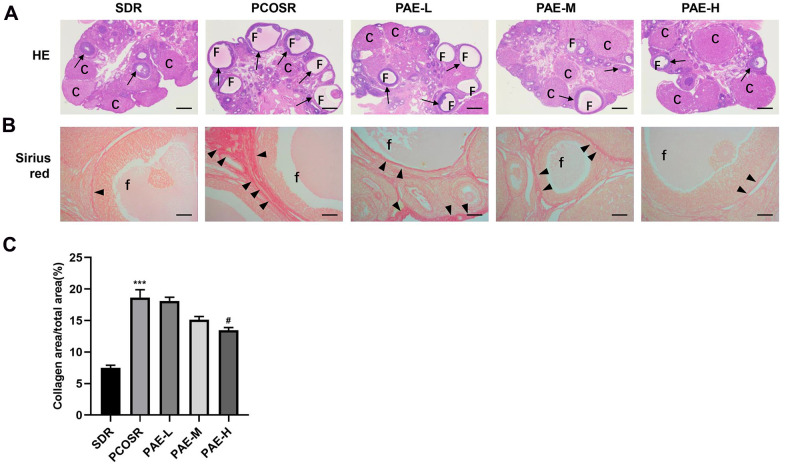
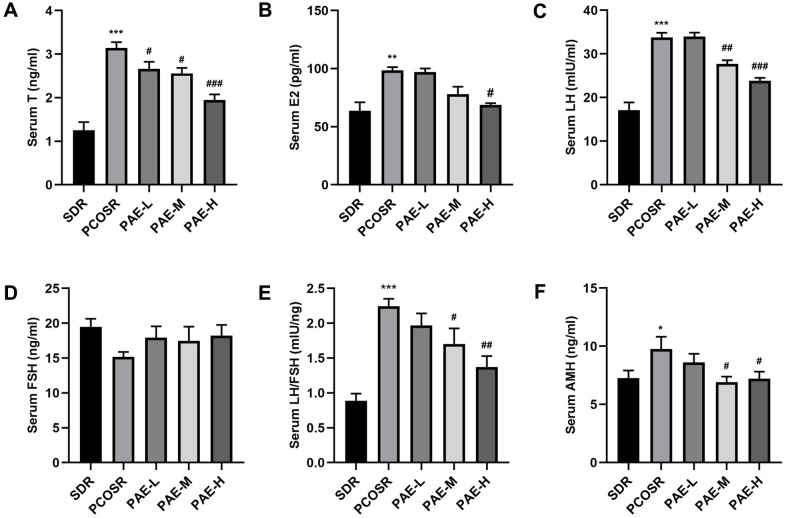
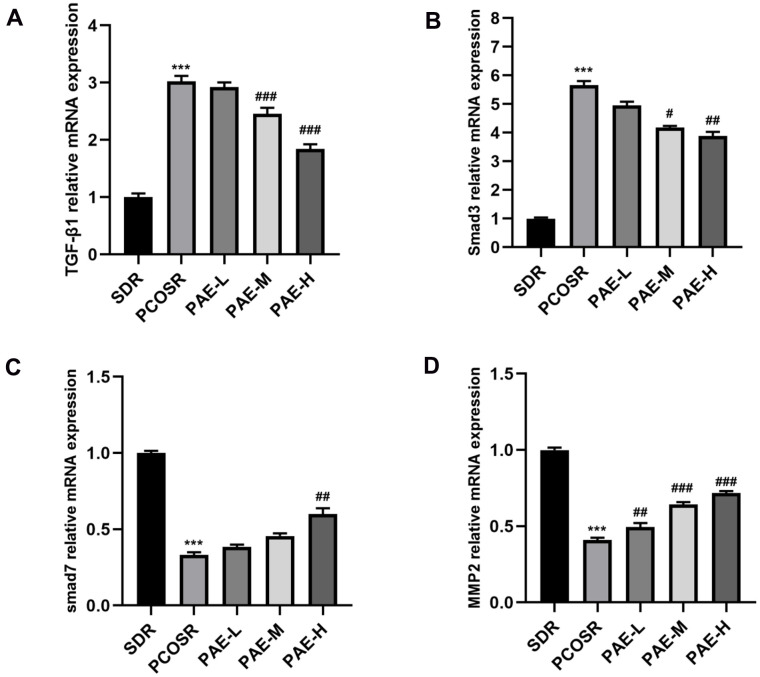
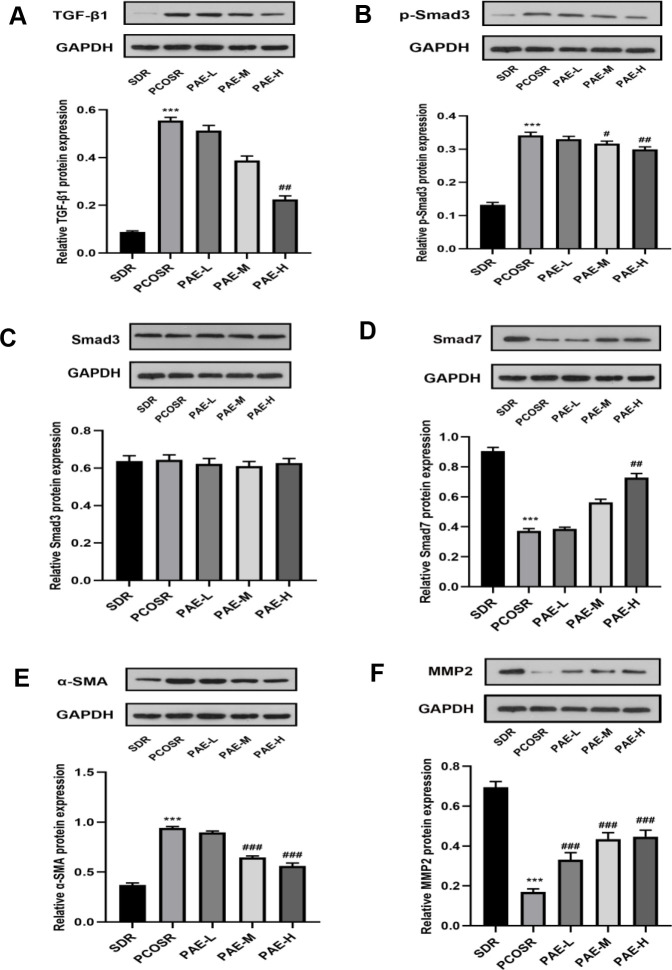
Polycystic ovarian syndrome (PCOS) is one of the most common reproductive endocrine disorders which are involved in complicated and unknown pathogenic mechanisms. Paeoniflorin (PAE) plays a significant anti-fibrotic role according to previous studies. The aim of the present study was to investigate the effect of PAE on ovarian fibrosis and its underlying mechanism in PCOS development. An animal model of PCOS was established by subcutaneous injection of 60mg/kg/d dehydroepiandrosterone (DHEA) for 35 consecutive days. Rats in PAE-L, PAE-M and PAE-H groups were administrated by gavage with PAE (20, 40, 80 mg/kg/d) for 4 weeks. Our results indicated that DHEA-induced PCOS rats showed similar phenotypes with PCOS patients. PAE could significantly block the DHEA-induced decline of ovary weight and organ coefficient, shorten the prolonged diestrus period, and regulate the irregular estrous cycle of PCOS rats. Moreover, PAE regulated reproductive hormone levels and improved ovarian fibrosis induced by DHEA. PAE treatment could also reduce the expression levels of TGF-β1 and Smad3, and increase the expression levels of Smad7 and MMP2. In conclusion, PAE significantly attenuated the ovarian fibrosis in PCOS, which could be mediated by TGF-β1/Smads signaling pathway. Herein, PAE can be used for the treatment of ovarian fibrosis in PCOS progression.
Keywords: TGF-β1/Smads signaling pathway; ovarian fibrosis; paeoniflorin; polycystic ovary syndrome.
Conflict of interest statement
Figures
Similar articles
-
DHEA-induced ovarian hyperfibrosis is mediated by TGF-β signaling pathway.J Ovarian Res. 2018 Jan 10;11(1):6. doi: 10.1186/s13048-017-0375-7. J Ovarian Res. 2018. PMID: 29321035 Free PMC article.
-
Dehydroepiandrosterone induces ovarian and uterine hyperfibrosis in female rats.Hum Reprod. 2013 Nov;28(11):3074-85. doi: 10.1093/humrep/det341. Epub 2013 Aug 26. Hum Reprod. 2013. PMID: 23980058
-
Effects of dipeptidyl peptidase-4 inhibitors on transforming growth factor-β1 signal transduction pathways in the ovarian fibrosis of polycystic ovary syndrome rats.J Obstet Gynaecol Res. 2019 Mar;45(3):600-608. doi: 10.1111/jog.13847. Epub 2018 Dec 4. J Obstet Gynaecol Res. 2019. PMID: 30515927 Free PMC article.
-
Central role of dysregulation of TGF-β/Smad in CKD progression and potential targets of its treatment.Biomed Pharmacother. 2018 May;101:670-681. doi: 10.1016/j.biopha.2018.02.090. Epub 2018 Mar 22. Biomed Pharmacother. 2018. PMID: 29518614 Review.
-
The role of TGF-β in polycystic ovary syndrome.Reprod Sci. 2014 Jan;21(1):20-31. doi: 10.1177/1933719113485294. Epub 2013 Apr 12. Reprod Sci. 2014. PMID: 23585338 Free PMC article. Review.
Cited by
-
Paeoniflorin Alleviates Cisplatin-Induced Diminished Ovarian Reserve by Restoring the Function of Ovarian Granulosa Cells via Activating FSHR/cAMP/PKA/CREB Signaling Pathway.Molecules. 2023 Dec 15;28(24):8123. doi: 10.3390/molecules28248123. Molecules. 2023. PMID: 38138611 Free PMC article.
-
Autophagy as a Therapeutic Target of Natural Products Enhancing Embryo Implantation.Pharmaceuticals (Basel). 2021 Dec 31;15(1):53. doi: 10.3390/ph15010053. Pharmaceuticals (Basel). 2021. PMID: 35056110 Free PMC article. Review.
-
Natural compounds in the management of polycystic ovary syndrome: a comprehensive review of hormonal regulation and therapeutic potential.Front Nutr. 2025 Feb 11;12:1520695. doi: 10.3389/fnut.2025.1520695. eCollection 2025. Front Nutr. 2025. PMID: 40008316 Free PMC article. Review.
-
Paeoniflorin Promotes Ovarian Development in Mice by Activating Mitophagy and Preventing Oxidative Stress.Int J Mol Sci. 2024 Jul 30;25(15):8355. doi: 10.3390/ijms25158355. Int J Mol Sci. 2024. PMID: 39125927 Free PMC article.
-
Abnormal Expression of Prolyl Oligopeptidase (POP) and Its Catalytic Products Ac-SDKP Contributes to the Ovarian Fibrosis Change in Polycystic Ovary Syndrome (PCOS) Mice.Biomedicines. 2023 Jul 7;11(7):1927. doi: 10.3390/biomedicines11071927. Biomedicines. 2023. PMID: 37509566 Free PMC article.
References
Publication types
MeSH terms
Substances
LinkOut - more resources
Full Text Sources
Other Literature Sources
Medical
Miscellaneous
