. 2021 Jan-Jun:296:100469.
doi: 10.1016/j.jbc.2021.100469. Epub 2021 Feb 25.

Mitochondrial fission is a critical modulator of mutant APP-induced neural toxicity

Affiliations

Mitochondrial fission is a critical modulator of mutant APP-induced neural toxicity

Lauren Y Shields et al. J Biol Chem. 2021 Jan-Jun.

Abstract

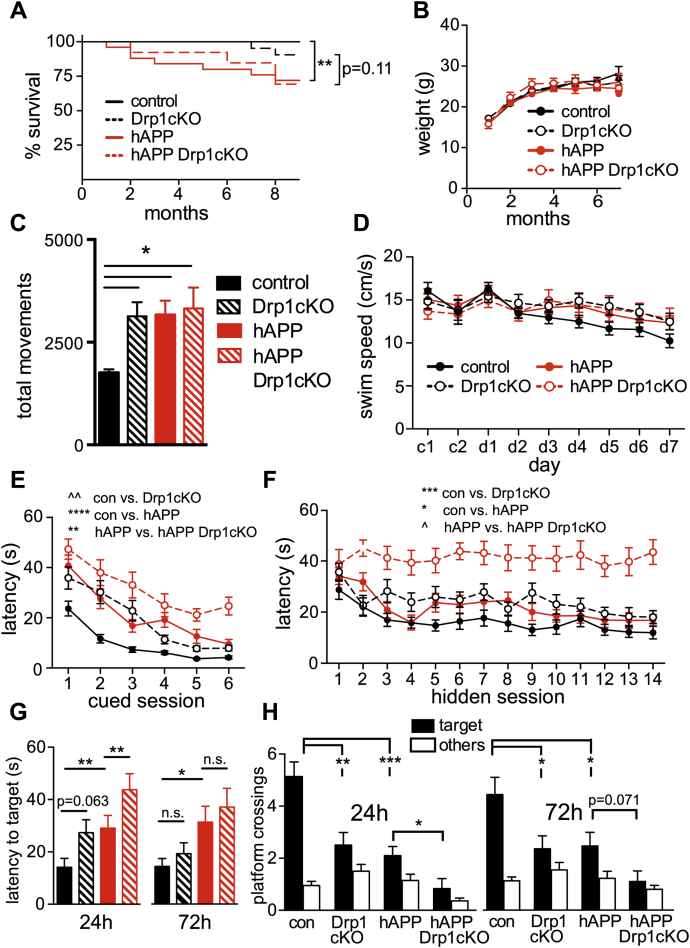
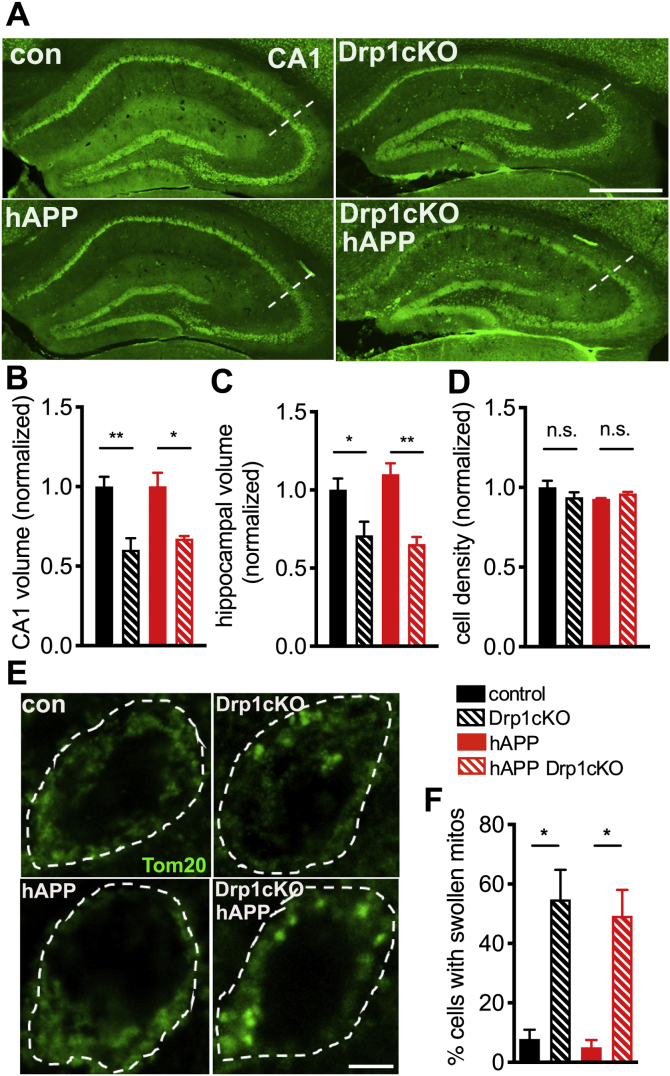
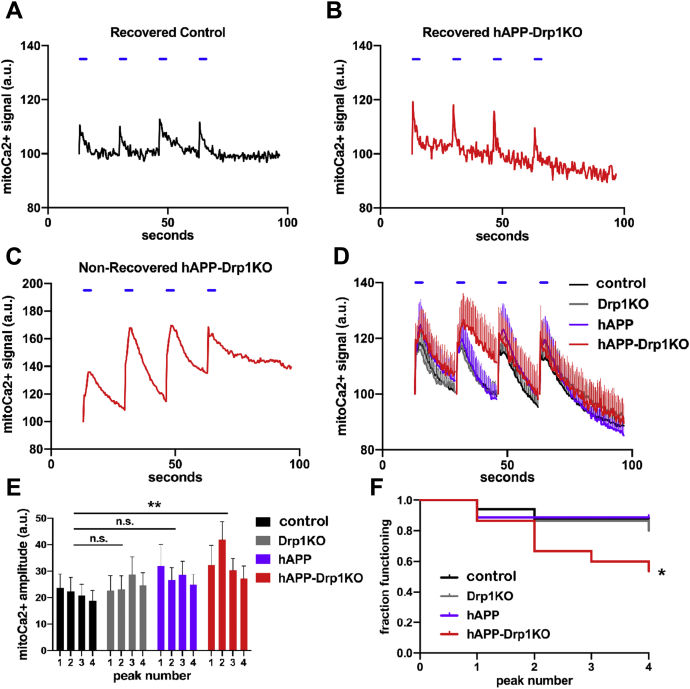
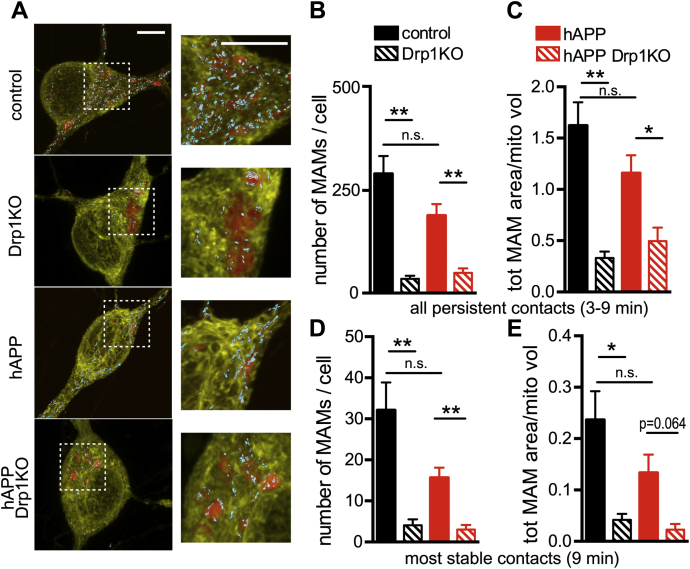
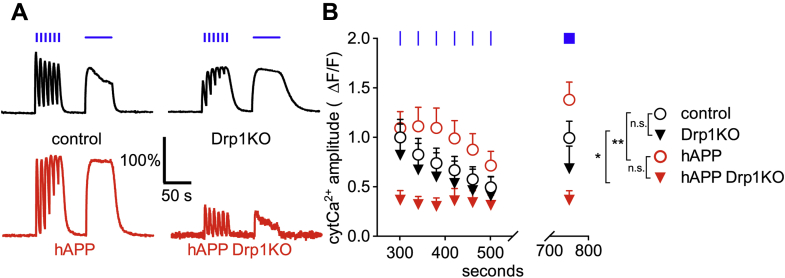
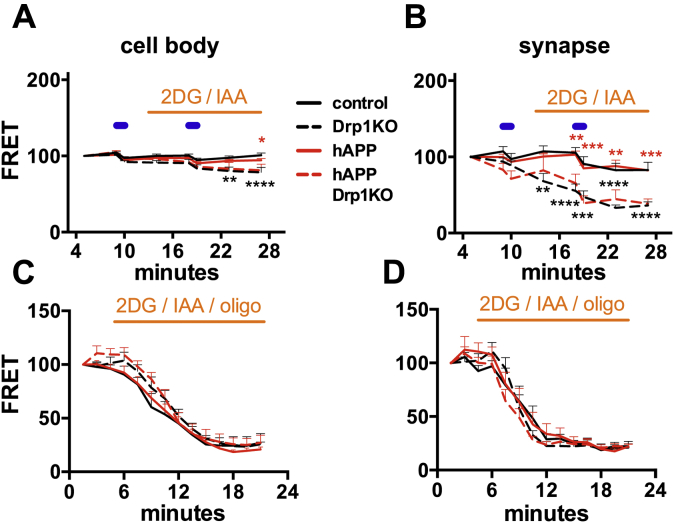
Alterations in mitochondrial fission may contribute to the pathophysiology of several neurodegenerative diseases, including Alzheimer's disease (AD). However, we understand very little about the normal functions of fission or how fission disruption may interact with AD-associated proteins to modulate pathogenesis. Here we show that loss of the central mitochondrial fission protein dynamin-related protein 1 (Drp1) in CA1 and other forebrain neurons markedly worsens the learning and memory of mice expressing mutant human amyloid precursor protein (hAPP) in neurons. In cultured neurons, Drp1KO and hAPP converge to produce mitochondrial Ca2+ (mitoCa2+) overload, despite decreasing mitochondria-associated ER membranes (MAMs) and cytosolic Ca2+. This mitoCa2+ overload occurs independently of ATP levels. These findings reveal a potential mechanism by which mitochondrial fission protects against hAPP-driven pathology.

Keywords: Alzheimer’s disease; Drp1; amyloid precursor protein (APP); mitochondria; mitochondrial calcium; mitochondrial fission; neurodegeneration; neurodegenerative disease.


Conflict of interest statement

Conflict of interest The authors declare that they have no conflicts of interest with the contents of this article.

Figures

Figure 1
Figure 1
Drp1 loss and hAPP expression combine to impair learning and memory. A, hAPP (hAPP-J20;Drp1wt/lox and hAPP-J20;Drp1lox/lox) mice had significant premature mortality (∗∗p < 0.01) compared with controls (Drp1wt/lox and Drp1lox/lox); hAPP Drp1cKO (hAPP-J20;Drp1lox/lox;CamKII-Cre) mice had a trend (p = 0.11) toward premature mortality compared with Drp1cKO (Drp1lox/lox;CamKII-Cre), by log-rank Mantel–Cox test, n = 13 to 30 mice/group monitored from birth through 9 months of age. B, no weight differences were observed between genotypes up to 7 months. Data are means ± S.E.M.; n = 5-42 mice/group. C, 6–7-month-old Drp1cKO, hAPP, and hAPP Drp1cKO mice showed an increased number of total movements in an open field over the course of 15 min, as compared with controls (Drp1wt/lox and Drp1lox/lox). Data are means ± S.E.M.; ∗p < 0.05 by one-way ANOVA and Holm–Sidak post hoc test, n = 9–12 mice/group. D–F, both procedural and spatial learning and memory were evaluated using the Morris water maze (MWM). D, no difference in swim speeds was found throughout the 2 days of procedural learning or 7 days of spatial learning by two-way ANOVA with repeated measures, indicating that all groups had intact motor function prior to the start of spatial training. E, procedural cued training conducted on the first 2 days over six sessions (c1-6) demonstrated significant but differential learning effects between the groups. Data are means ± S.E.M.; ∗∗p < 0.01, ∗∗∗∗p < 0.0001, ˆˆp<1e-10 by average rank latency with mixed-effect modeling, n = 12–22 mice/group. F, spatial learning and memory during hidden platform training in 6–7-month-old mice. Drp1cKO and hAPP showed significant learning impairments compared with Drp1WT (control). hAPP-J20 Drp1cKO (hAPP Drp1cKO) mice showed significant learning impairments compared with hAPP-J20 (hAPP) mice. Data are means ± S.E.M.; ∗p < 0.05, ∗∗∗p < 0.001, ˆp<1e-9 by average rank latency with mixed-effect modeling, n = 12 to 22 mice/group. G and H, spatial memory was evaluated using MWM probe trials at 24 and 72 h with the hidden platform removed and measured by latency to cross the former hidden platform location (target) (G) and number of platform location (target) and nontarget (other) crossings (H). Drp1cKO, hAPP, and hAPP Drp1cKO mice showed significant memory deficits. n = 12 to 22 mice/group. Data are means ± S.E.M.; n.s. = not significant, ∗p < 0.05, ∗∗p < 0.01, ∗∗∗p < 0.001 by Cox proportional hazards regression models (latency to cross) and Quasi-Poisson generalized linear models (platform crossings).
Figure 2
Figure 2
hAPP does not exacerbate Drp1cKO-induced cell loss and morphologic changes.A, neuronal cell bodies labeled by NeuN staining in brain sections from 12-month-old mice. Hippocampi indicated by dotted outlines. Scale bar is 1 mm. B and C, Drp1 loss decreased both CA1 (B) and overall hippocampal (C) volume in 12-month-old mice. n = 4–5 mice/group (9–17 slices/mouse). Data are means ± S.E.M., ∗p < 0.05, ∗∗p < 0.01 by two-way ANOVA and Holm–Sidak post hoc test. D, Drp1cKO and hAPP Drp1cKO mice did not show any decrease in CA1 cell density at 12 months of age. n = 4–5 mice/group (4 slices/mouse). n.s. (not significant) by two-way ANOVA and Holm–Sidak post hoc test. E, Mitochondria in CA1 neurons in hippocampal slices from 6 to 7-month-old Drp1WT (control), Drp1cKO, hAPP-J20 (hAPP), and hAPP-J20 Drp1cKO (hAPP Drp1cKO) mice, identified by Tom20 immunofluorescence (green). Cell bodies (outer stippled outlines) were defined by Map2 staining. Scale bar is 4 μm. F, Drp1KO increased the proportion of cells with swollen mitochondria, while hAPP had no effect. n = 4 mice/group (3 slices/mouse). ∗p < 0.05 by Welch’s ANOVA and Games-Howell post hoc test (used instead of two-way ANOVA due to significant Levene’s test for equality of variance).
Figure 3
Figure 3
hAPP and Drp1KO combine to overload mitochondria with calcium. Primary hippocampal neurons from Drp1lox/lox mice were cotransfected with Cre (to delete Drp1; Drp1KO), mutant hAPP, and/or control vector (control), as well as CEPIA3mt to visualize mitochondrial calcium (mitoCa2+) and mApple, and were subjected to a sequence of four individual electrical stimuli (30 Hz for 3s, blue horizontal lines) to evoke calcium entry. A, example trace of a control neuron that recovers baseline mitoCa2+ levels following each stimulus. B and C, Example traces of hAPP-Drp1KO neurons successfully (B) and unsuccessfully (C) recovering mitoCa2+ levels after evoked influx. D, average mitoCa2+ levels for control (black), Drp1KO (gray), hAPP (purple), and hAPP-Drp1KO (red) neurons. E, average amplitude for each mitoCa2+ peak in (D). The combination of hAPP and Drp1KO, but neither of the perturbations alone, increased mitoCa2+ loading during electrically evoked calcium entry compared to control. n = 15–18 coverslips/group (1 cell/coverslip), compilation of six independent experiments. Data show mean ± SEM; ∗∗p < 0.01 by two-way repeated measures ANOVA and Holm–Sidak post hoc test. F, graph shows the fraction of neurons from (D) that successfully recovered baseline mitoCa2+ levels following each of the four stimuli. The combination of hAPP and Drp1KO decreases the fraction of functional neurons; ∗p < 0.05 by log-rank test.
Figure 4
Figure 4
Drp1 loss decreases MAMs in cultured neurons. Drp1KO and control neurons, with or without mutant hAPP, were cotransfected with reporters to visualize the ER (yellow, eYFP-ER) and mitochondria (red, mitoFarRed). A, three-dimensional reconstructions of confocal Z-stacks (rendered via max projection) showing neuronal cell bodies with MAMs identified by areas showing ER-mitochondria colocalization (cyan; with surface rendering). B, in the presence or absence of hAPP, Drp1KO cells showed fewer persistent MAMs (defined as contacts lasting 3–5, 6–8, or 9 min) than Drp1WT cells. C, Drp1KO decreased the total area of ER–mitochondria contacts (normalized to total mitochondrial volume) with or without hAPP. D and E, in the most stable contacts (lasting 9 min), Drp1KO reduced MAM number and total MAM area in the presence and absence of hAPP expression. (B–E), hAPP alone had no significant effect on MAMs as compared with control. n = 8–11 coverslips/group (with 11–12 cells/group), compilation of three experiments. Data show mean ± SEM; p = 0.064, ∗p < 0.05, ∗∗p < 0.01, n.s. (not significant), by Welch’s ANOVA and Games-Howell post hoc test. Scale bars are 5 μm.
Figure 5
Figure 5
hAPP expression increases evoked cytosolic calcium in the cell body of neurons, but drastically decreases evoked calcium in the absence of Drp1.A and B, Drp1KO and control neurons, with or without mutant hAPP, were cotransfected with the cytosolic calcium (cytCa2+) sensor GCaMP6f (81) and subjected to electrical stimulation (30 Hz for 3 s (blue vertical bars) and 10 Hz for 60 s (horizontal blue bar)). Drp1KO alone had no significant effect on the amplitude of evoked cytCa2+, whereas hAPP expression increased cytCa2+ in the presence of Drp1 and decreased cytCa2+ in the absence of Drp1. n = 7–8 coverslips/group (with 17–60 cells/group), compilation of three experiments. Data are representative traces normalized to baseline and control (A) and means ± S.E.M. (B) ∗p < 0.05 Drp1KO versus hAPP Drp1KO, ∗∗p < 0.01 control versus hAPP, ∗∗∗∗p < 0.0001 hAPP versus hAPP Drp1KO by two-way ANOVA and Holm–Sidak test. Control versus Drp1KO was not significant (n.s.).
Figure 6
Figure 6
Drp1KO, but not hAPP expression, reduces mitochondria-derived ATP at synapses more than at cell bodies. Drp1KO and control neurons, with or without mutant hAPP, were cotransfected with an ATP-based FRET sensor (ATP1.03YEMK) (49). A, when forced to rely on mitochondria for ATP (acute absence of glucose, addition of glycolytic inhibitors 2-deoxyglucose (2DG) and iodoacetate (IAA); orange horizontal bar), Drp1KO neurons with or without hAPP had only slightly decreased ATP levels at the cell body after stimulation (10 Hz ∗ 60 s, blue horizontal bars). B, in contrast, Drp1KO neurons with or without hAPP had markedly reduced ATP levels at the synapse under these conditions. hAPP did not affect ATP levels. n = 6–12 coverslips/group (with 67–105 boutons and 15–22 cells per group), compilation of four experiments. C and D, To estimate basal ATP consumption, we simultaneously blocked glycolytic production with 2DG and IAA and respiration with oligomycin (oligo). Rates of consumption, assessed in the absence of electrical stimulation, did not differ across groups at the cell body (C) or the synapse (D), as indicated by the initial slope of decline in ATP level. n = 6–8 coverslips/group (with 56–68 boutons and 6–10 cells per group), compilation of three experiments. Data are means ± S.E.M.; ∗p < 0.05, ∗∗p < 0.01, ∗∗∗p < 0.001, ∗∗∗∗p < 0.0001 control versus Drp1KO (black) and hAPP versus hAPP Drp1KO (red) by two-way ANOVA with repeated measures and Holm–Sidak test.

Similar articles

Cited by

References

    1. Itoh K., Nakamura K., Iijima M., Sesaki H. Mitochondrial dynamics in neurodegeneration. Trends Cell Biol. 2013;23:64–71. - PMC - PubMed
    1. Kandimalla R., Reddy P.H. Multiple faces of dynamin-related protein 1 and its role in Alzheimer's disease pathogenesis. Biochim. Biophys. Acta. 2016;1862:814–828. - PMC - PubMed
    1. Manczak M., Calkins M.J., Reddy P.H. Impaired mitochondrial dynamics and abnormal interaction of amyloid beta with mitochondrial protein Drp1 in neurons from patients with Alzheimer's disease: Implications for neuronal damage. Hum. Mol. Genet. 2011;20:2495–2509. - PMC - PubMed
    1. Kamp F., Exner N., Lutz A.K., Wender N., Hegermann J., Brunner B., Nuscher B., Bartels T., Giese A., Beyer K., Eimer S., Winklhofer K.F., Haass C. Inhibition of mitochondrial fusion by alpha-synuclein is rescued by PINK1, Parkin and DJ-1. EMBO J. 2010;29:3571–3589. - PMC - PubMed
    1. Nakamura K., Nemani V.M., Azarbal F., Skibinski G., Levy J.M., Egami K., Munishkina L., Zhang J., Gardner B., Wakabayashi J., Sesaki H., Cheng Y., Finkbeiner S., Nussbaum R.L., Masliah E. Direct membrane association drives mitochondrial fission by the Parkinson disease-associated protein alpha-synuclein. J. Biol. Chem. 2011;286:20710–20726. - PMC - PubMed

Publication types

MeSH terms