

TNF receptor-associated factor 3 restrains B-cell receptor signaling in normal and malignant B cells
- PMID: 33639170
- PMCID: PMC8042179
- DOI: 10.1016/j.jbc.2021.100465
TNF receptor-associated factor 3 restrains B-cell receptor signaling in normal and malignant B cells
Abstract
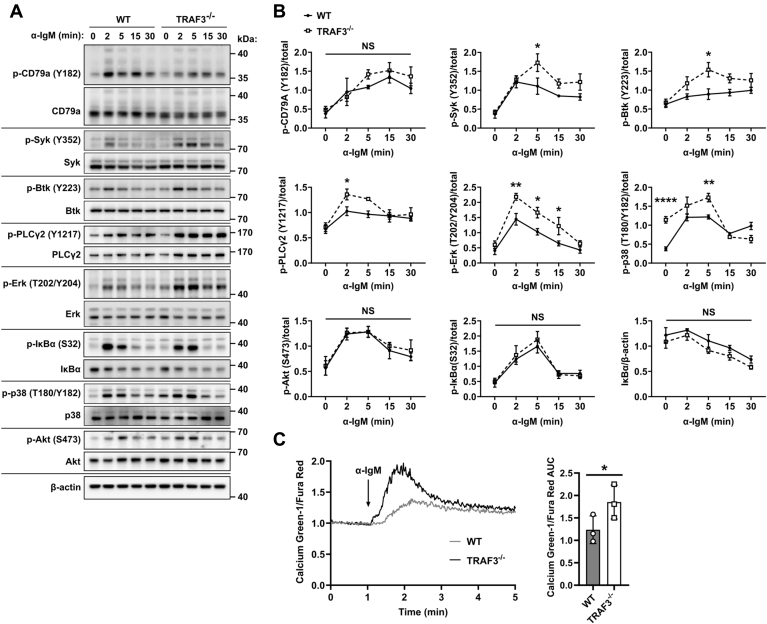
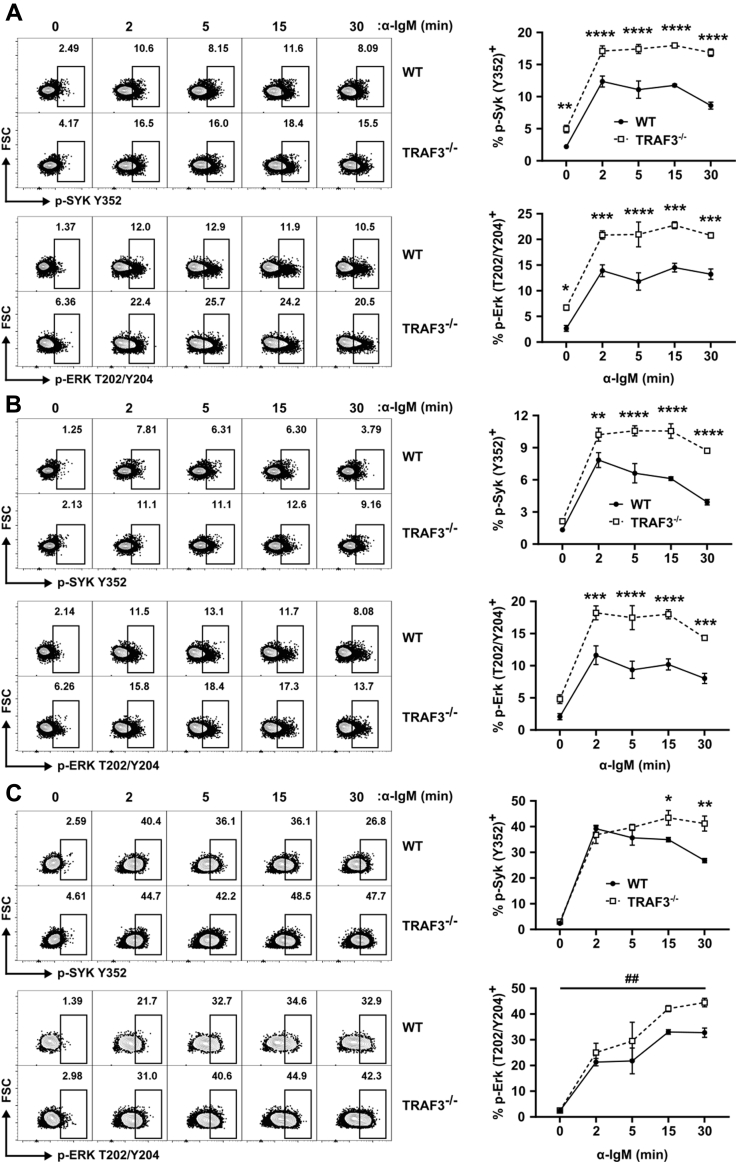
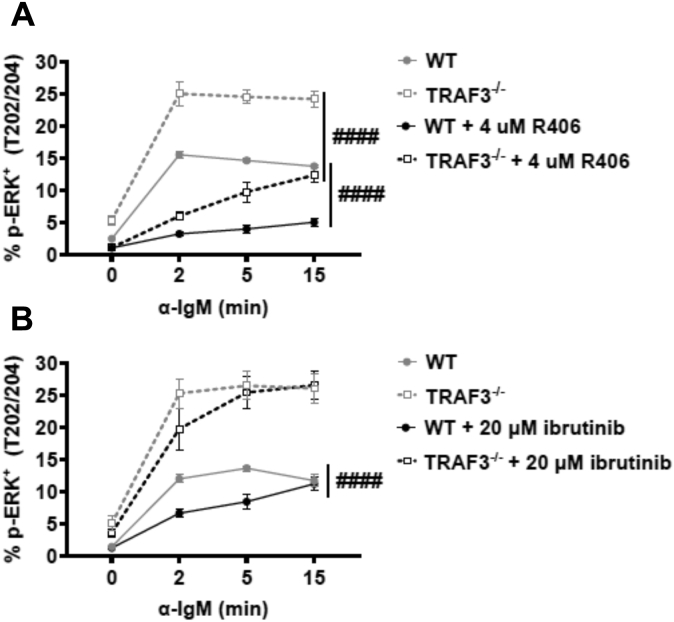
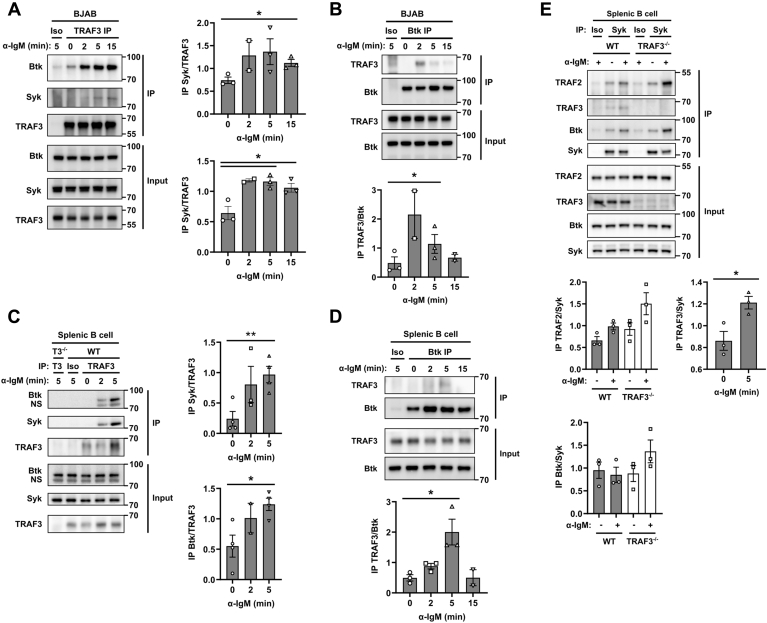
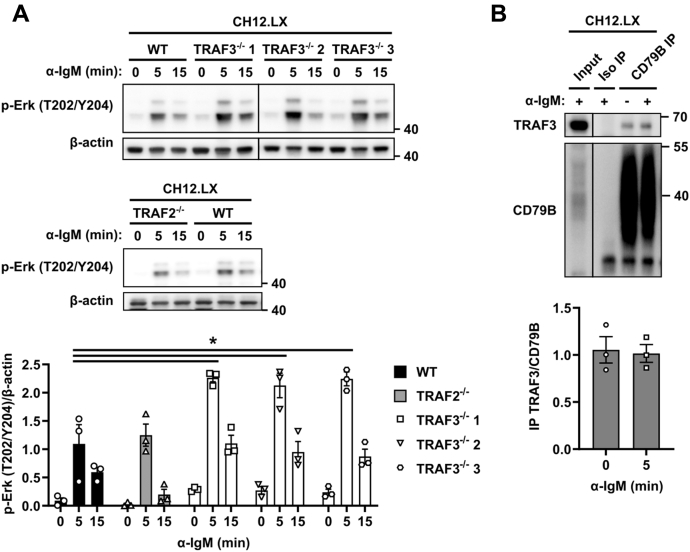
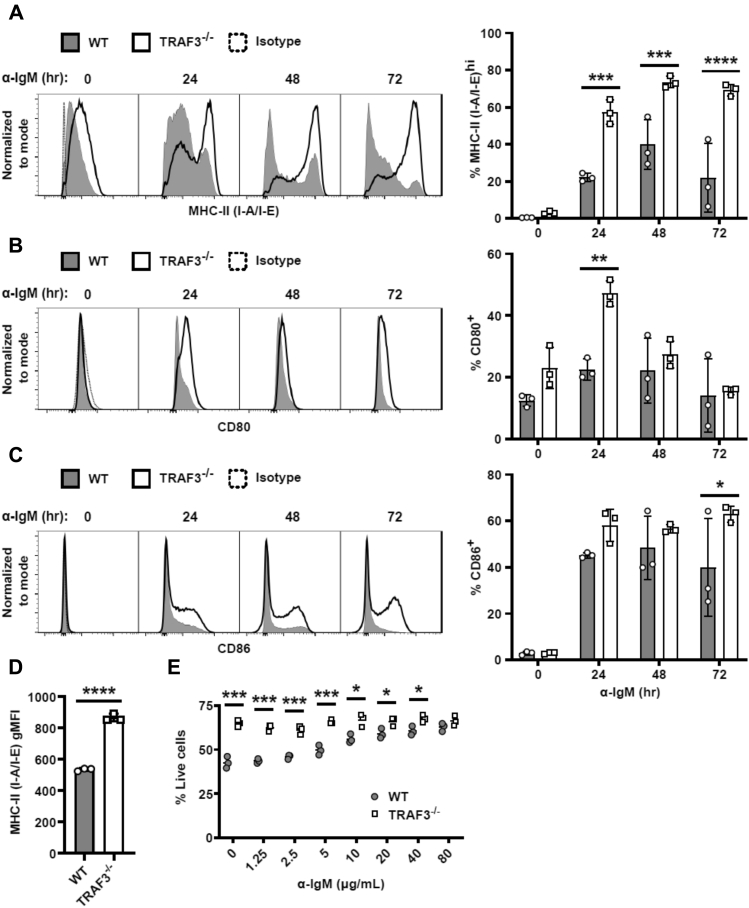
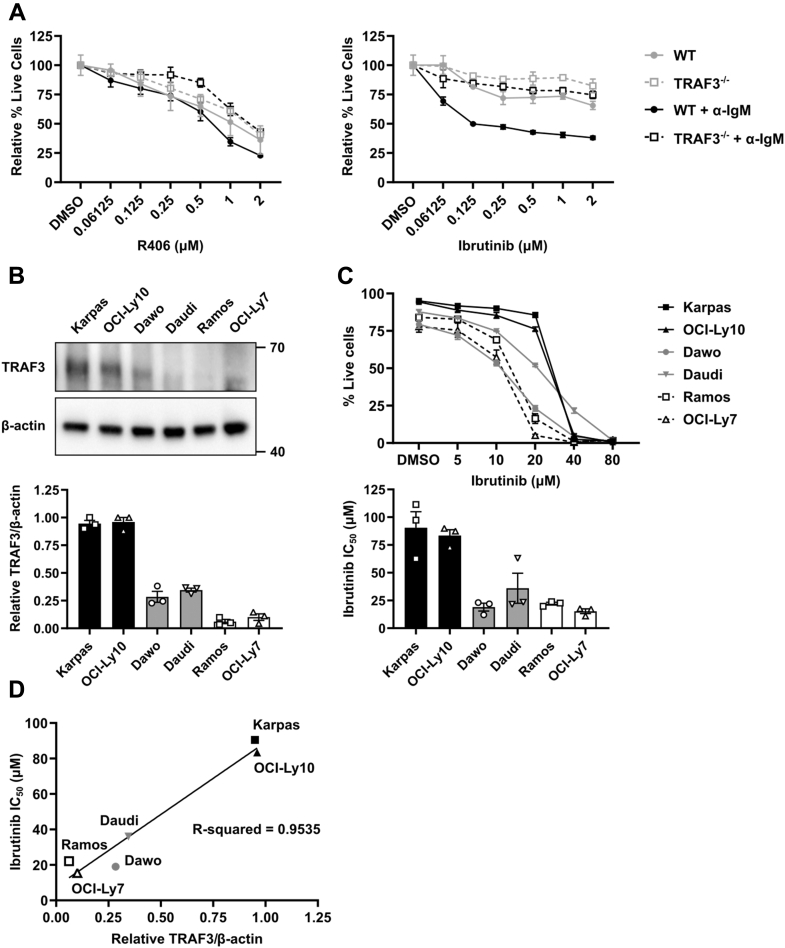
TRAF3 has diverse signaling functions, which vary by cell type. Uniquely in B lymphocytes, TRAF3 inhibits homeostatic survival. Highlighting the role of TRAF3 as a tumor suppressor, loss-of-function TRAF3 mutations are associated with human B-cell malignancies, while B-cell-specific deletion of TRAF3 in mice leads to autoimmunity and lymphoma development. The role of TRAF3 in inhibiting noncanonical NF-κB activation, CD40 and BAFF-R signaling to B cells is well documented. In contrast, TRAF3 enhances many T-cell effector functions, through associating with and enhancing signaling by the T-cell receptor (TCR)-CD28 complex. The present study was designed to determine the role of TRAF3 in signaling via the B-cell antigen receptor (BCR). The BCR is crucial for antigen recognition, survival, proliferation, and antibody production, and defects in BCR signaling can promote abnormal survival of malignant B cells. Here, we show that TRAF3 is associated with both CD79B and the BCR-activated kinases Syk and Btk following BCR stimulation. BCR-induced phosphorylation of Syk and additional downstream kinases was increased in TRAF3-/- B cells, with regulation observed in both follicular and marginal zone B-cell subsets. BCR stimulation of TRAF3-/- B cells resulted in increased surface expression of MHC-II, CD80, and CD86 molecules. Interestingly, increased survival of TRAF3-/- primary B cells was resistant to inhibition of Btk, while TRAF3-deficient malignant B-cell lines showed enhanced sensitivity. TRAF3 serves to restrain normal and malignant BCR signaling, with important implications for its role in normal B-cell biology and abnormal survival of malignant B cells.
Keywords: B-cell receptor (BCR); Btk; MAPK; TNF receptor-associated factor (TRAF); cell signaling; immunology; inhibition mechanism; lymphocyte; lymphoma; spleen tyrosine kinase (Syk).
Copyright © 2021 The Authors. Published by Elsevier Inc. All rights reserved.
Conflict of interest statement
Conflict of interest The authors declare no competing financial or nonfinancial interests.
Figures
Similar articles
-
TRAF3 regulation of proximal TLR signaling in B cells.J Leukoc Biol. 2024 Jul 25;116(2):210-223. doi: 10.1093/jleuko/qiae038. J Leukoc Biol. 2024. PMID: 38489541 Free PMC article.
-
Bruton's tyrosine kinase inhibition induces rewiring of proximal and distal B-cell receptor signaling in mice.Eur J Immunol. 2021 Sep;51(9):2251-2265. doi: 10.1002/eji.202048968. Epub 2021 Aug 16. Eur J Immunol. 2021. PMID: 34323286 Free PMC article.
-
Distinct patterns of B-cell receptor signaling in non-Hodgkin lymphomas identified by single-cell profiling.Blood. 2017 Feb 9;129(6):759-770. doi: 10.1182/blood-2016-05-718494. Epub 2016 Dec 23. Blood. 2017. PMID: 28011673 Free PMC article.
-
B-cell receptor signaling as a driver of lymphoma development and evolution.Semin Cancer Biol. 2013 Dec;23(6):410-21. doi: 10.1016/j.semcancer.2013.09.001. Epub 2013 Sep 20. Semin Cancer Biol. 2013. PMID: 24060900 Free PMC article. Review.
-
Roles of TRAF3 in T cells: many surprises.Cell Cycle. 2015;14(8):1156-63. doi: 10.1080/15384101.2015.1021524. Cell Cycle. 2015. PMID: 25723057 Free PMC article. Review.
Cited by
-
Enhanced CD19 activity in B cells contributes to immunodeficiency in mice deficient in the ICF syndrome gene Zbtb24.Cell Mol Immunol. 2023 Dec;20(12):1487-1498. doi: 10.1038/s41423-023-01106-w. Epub 2023 Nov 22. Cell Mol Immunol. 2023. PMID: 37990035 Free PMC article.
-
TRAF3 regulation of proximal TLR signaling in B cells.J Leukoc Biol. 2024 Jul 25;116(2):210-223. doi: 10.1093/jleuko/qiae038. J Leukoc Biol. 2024. PMID: 38489541 Free PMC article.
-
Mitochondrial Quality Control Orchestrates the Symphony of B Cells and Plays Critical Roles in B Cell-Related Diseases.J Immunol Res. 2024 Oct 17;2024:5577506. doi: 10.1155/2024/5577506. eCollection 2024. J Immunol Res. 2024. PMID: 39449998 Free PMC article. Review.
-
TRAF3/p38-JNK Signalling Crosstalk with Intracellular-TRAIL/Caspase-10-Induced Apoptosis Accelerates ROS-Driven Cancer Cell-Specific Death by CD40.Cells. 2022 Oct 18;11(20):3274. doi: 10.3390/cells11203274. Cells. 2022. PMID: 36291141 Free PMC article.
-
B-Cell Receptor Signaling and Beyond: The Role of Igα (CD79a)/Igβ (CD79b) in Normal and Malignant B Cells.Int J Mol Sci. 2023 Dec 19;25(1):10. doi: 10.3390/ijms25010010. Int J Mol Sci. 2023. PMID: 38203179 Free PMC article. Review.
References
-
- Xu Y., Cheng G., Baltimore D. Targeted disruption of TRAF3 leads to postnatal lethality and defective T-dependent immune responses. Immunity. 1996;5:407–415. - PubMed
-
- Gardam S., Sierro F., Basten A., Mackay F., Brink R. TRAF2 and TRAF3 signal adapters act cooperatively to control the maturation and survival signals delivered to B cells by the BAFF receptor. Immunity. 2008;28:391–401. - PubMed
Publication types
MeSH terms
Substances
Grants and funding
LinkOut - more resources
Full Text Sources
Other Literature Sources
Molecular Biology Databases
Research Materials
Miscellaneous
