Review
. 2021:20:100041.
doi: 10.1074/mcp.RA120.002301. Epub 2021 Jan 7.

Interspecies Differences in Proteome Turnover Kinetics Are Correlated With Life Spans and Energetic Demands

Affiliations
Review

Interspecies Differences in Proteome Turnover Kinetics Are Correlated With Life Spans and Energetic Demands

Kyle Swovick et al. Mol Cell Proteomics. 2021.

Abstract

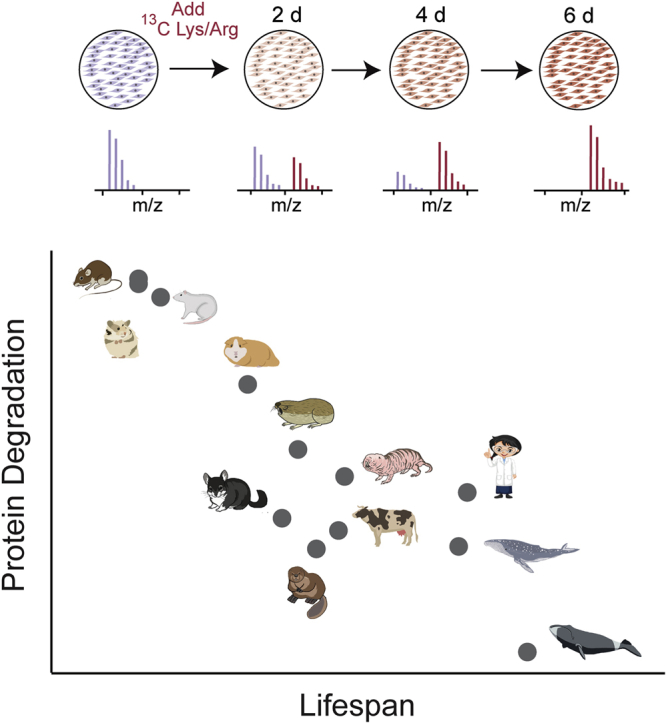
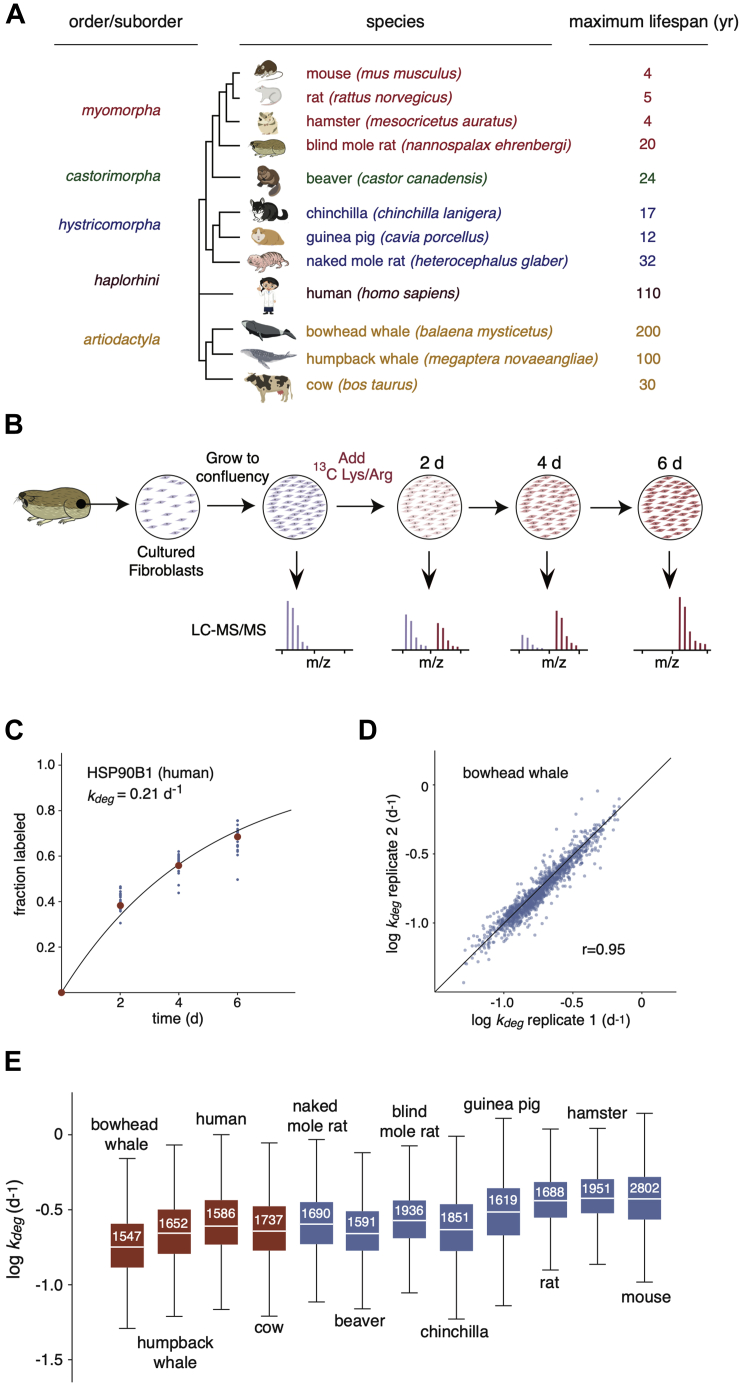
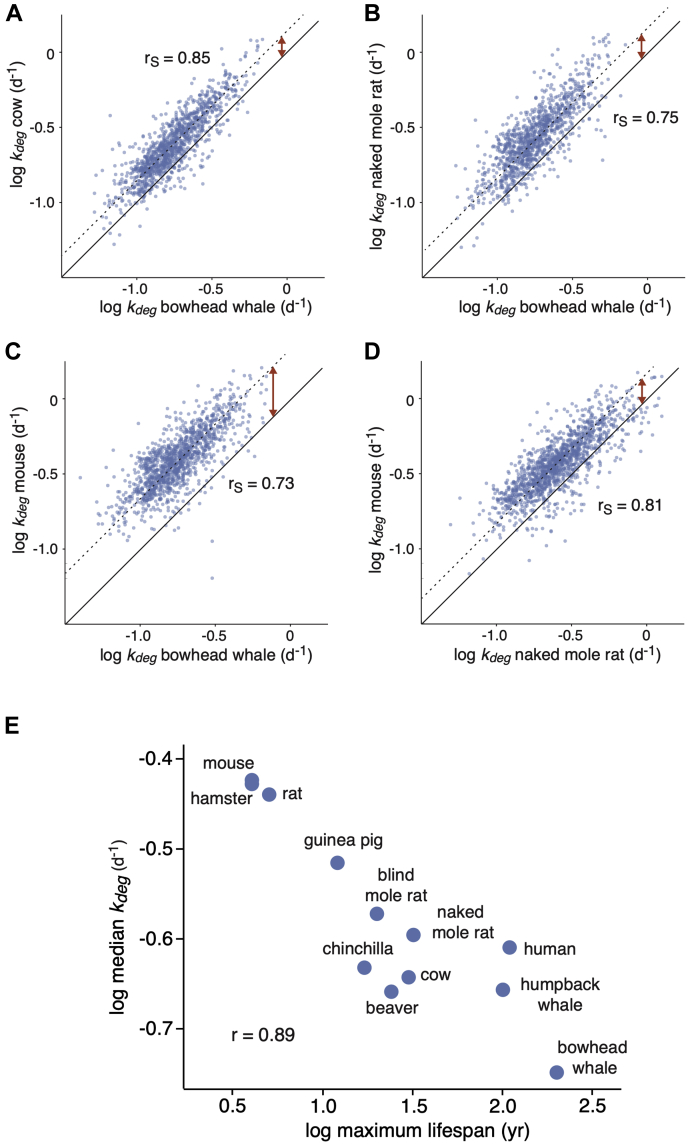
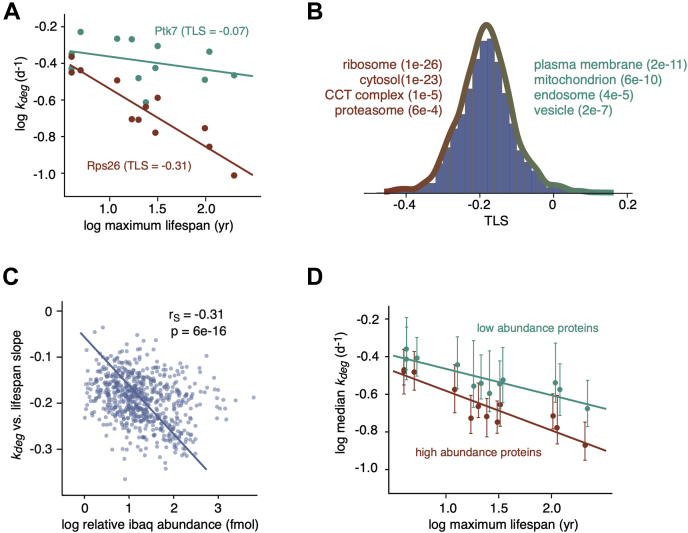
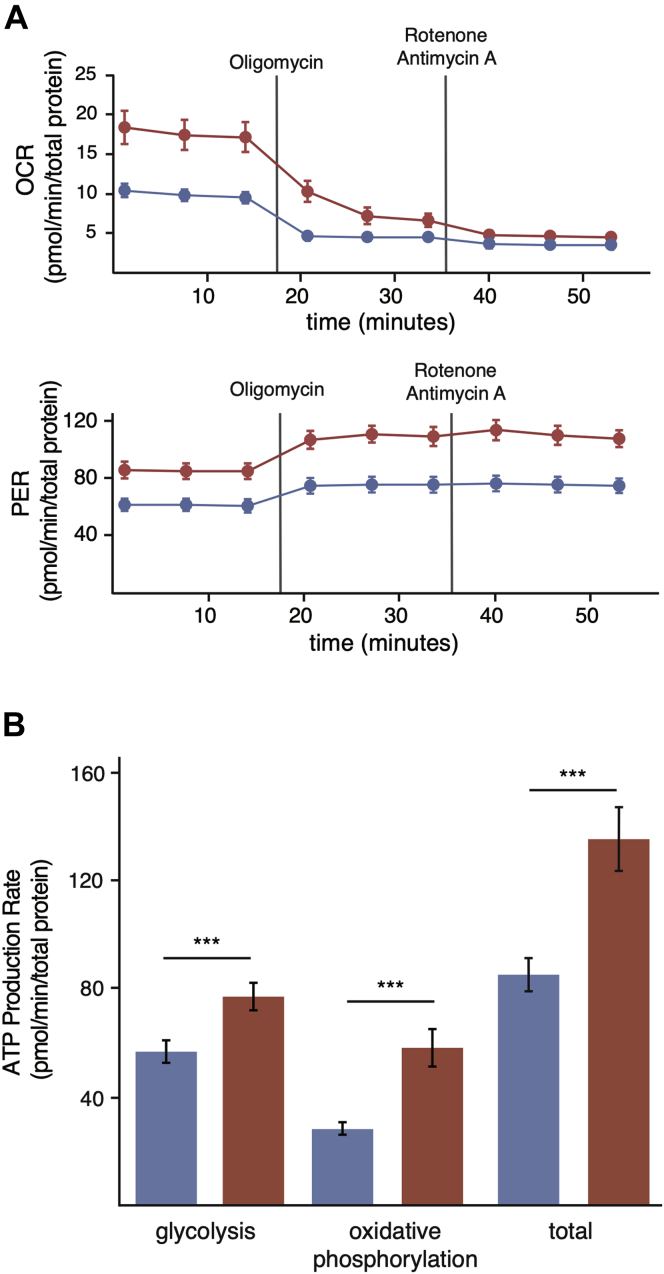
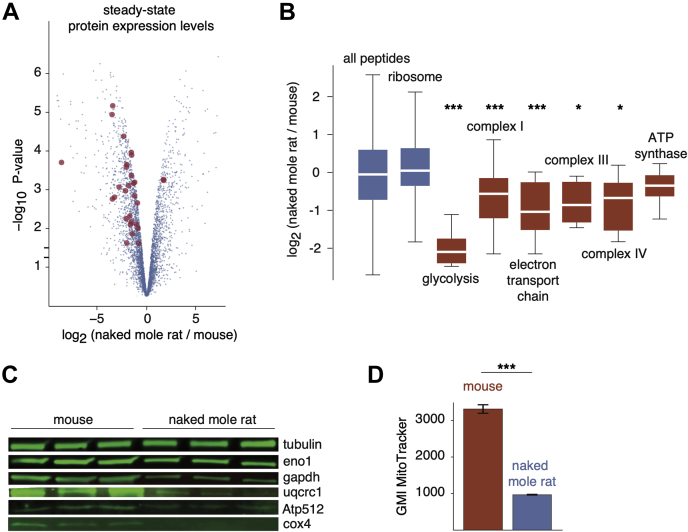
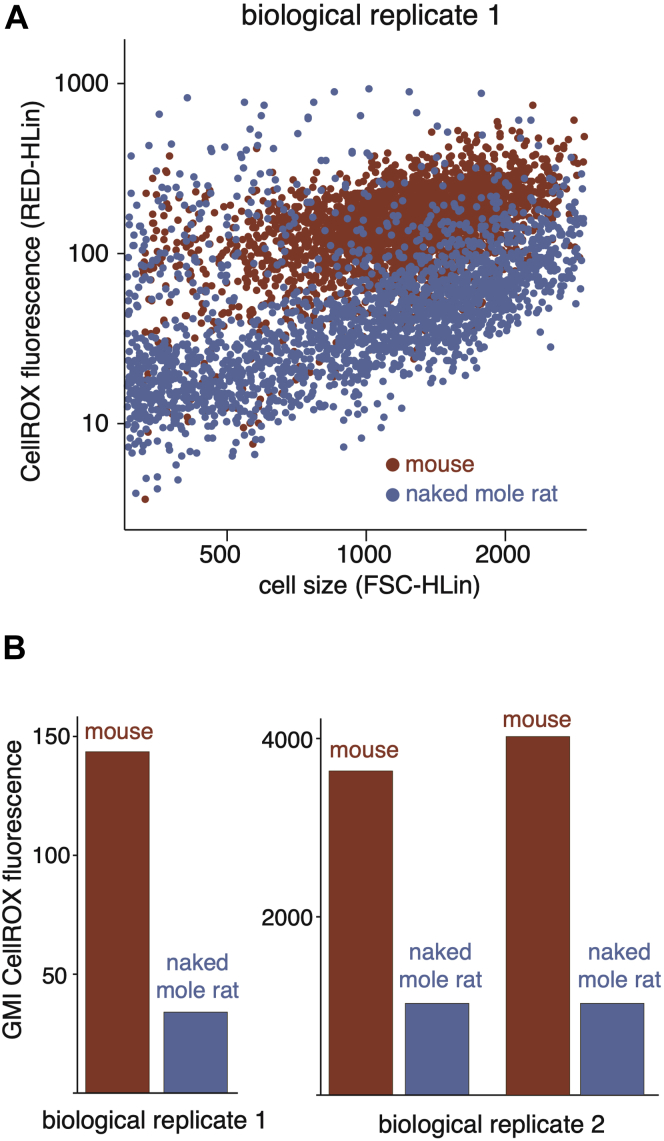
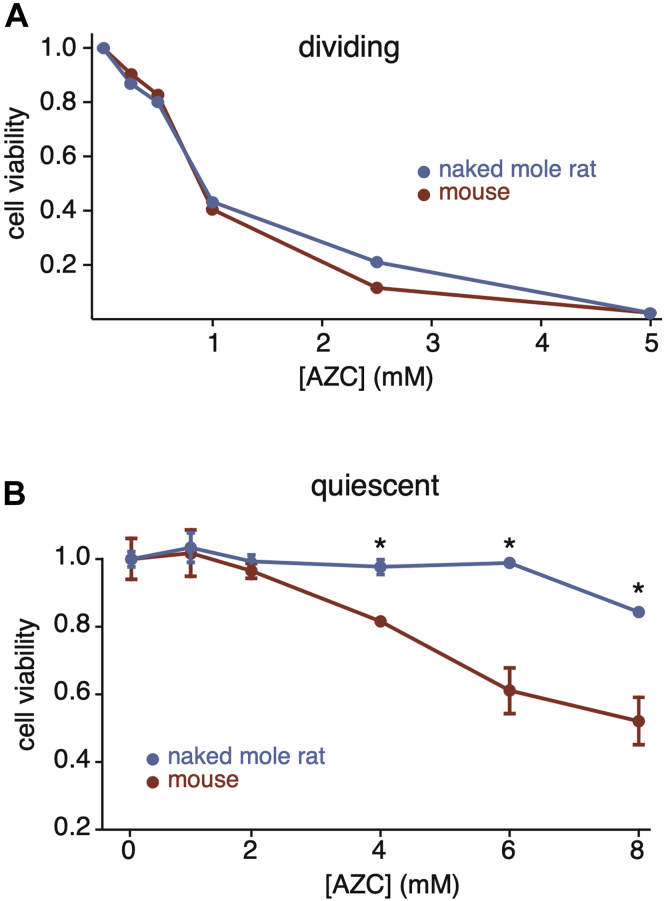
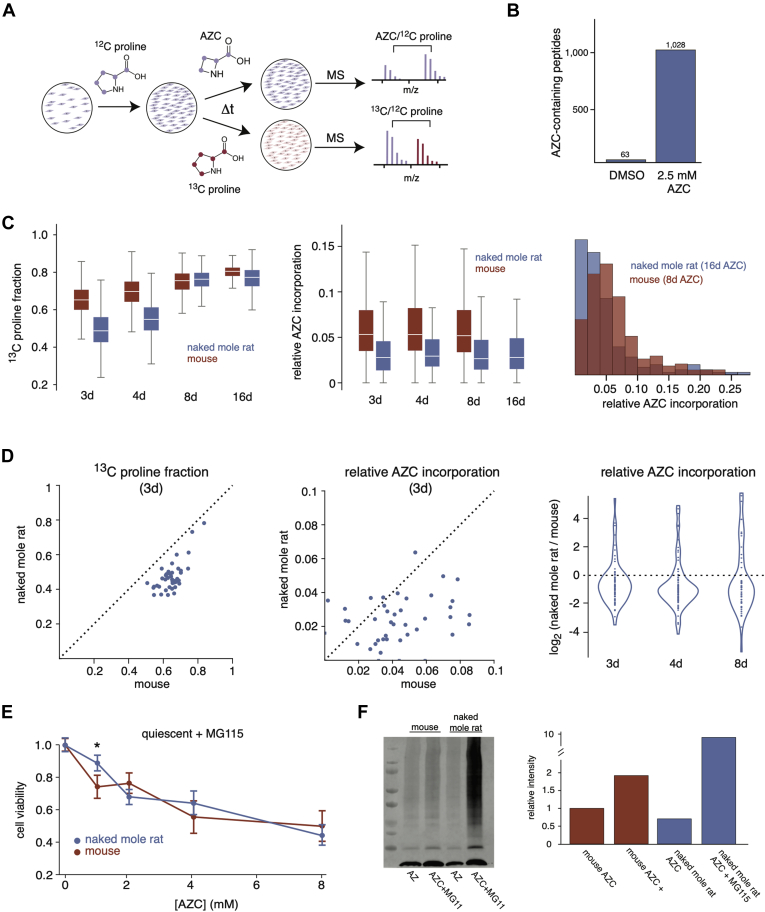
Cells continually degrade and replace damaged proteins. However, the high energetic demand of protein turnover generates reactive oxygen species that compromise the long-term health of the proteome. Thus, the relationship between aging, protein turnover, and energetic demand remains unclear. Here, we used a proteomic approach to measure rates of protein turnover within primary fibroblasts isolated from a number of species with diverse life spans including the longest-lived mammal, the bowhead whale. We show that organismal life span is negatively correlated with turnover rates of highly abundant proteins. In comparison with mice, cells from long-lived naked mole rats have slower rates of protein turnover, lower levels of ATP production, and reduced reactive oxygen species levels. Despite having slower rates of protein turnover, naked mole rat cells tolerate protein misfolding stress more effectively than mouse cells. We suggest that in lieu of a rapid constitutive turnover, long-lived species may have evolved more energetically efficient mechanisms for selective detection and clearance of damaged proteins.

Keywords: Protein turnove; aging; protein degradation; proteostasis; quantitative proteomics.


Conflict of interest statement

Conflict of interest The authors declare no competing interests.

Figures

None
Graphical abstract
Fig. 1
Fig. 1
Proteome-wide quantitation of kdegin mammalian fibroblasts.A, phylogenetic tree and maximal life spans of species analyzed in this study. Colors indicate distinct orders and suborders. B, dynamic SILAC experimental design. Blue and red colors indicate unlabeled and isotopically labeled spectra/cells, respectively. C, labeling kinetics of human HSP90B1 (endoplasmin) shown as an example of protein-level determination of kdeg values. Blue dots indicate the fraction labeled for all peptides mapped to the protein, and red dots indicate the median fraction labeled for all peptides. The blue curve is a least squares fit to a first-order exponential equation used to measure the indicated kdeg value. D, pairwise comparison of kdeg measurements in biological replicates of bowhead whale cells. The solid line indicates the identity line. The r value indicates the Pearson correlation coefficient. E, distribution of kdeg measurements for each species. The box plots indicate the median (white line), the interquartile range (box), and complete range (whiskers) of kdeg measurements excluding far outliers (>2 SD). The number in each box indicates the number of protein-level kdeg measurements. Red and blue boxes distinguish data collected in this study and the previous study by Swovick et al. (21), respectively. SILAC, stable isotopic labeling in cell culture.
Fig. 2
Fig. 2
Cross-species comparison of kdegmeasurements.AD, pairwise comparisons of kdeg measurements for representative pairs of species with variable life spans and evolutionary divergence times. Solid lines indicate lines of identity, and dotted lines indicate lines of best fit. Red arrows highlight global shifts in distributions of kdeg. rS values indicate Spearman rank correlation coefficients. E, correlation between species’ median kdeg values and maximal life spans. The r value indicates the Pearson correlation coefficient.
Fig. 3
Fig. 3
Differences in protein kdegvalues between species are correlated with protein abundance.A, correlation between kdeg values of two example proteins (Ptk7 and Rps26) and maximum life spans across species. The turnover–life span slope (TLS) measurements refer to slopes of the log-log plots. B, distribution of protein TLS values. Steep and shallow TLS values are most enriched in proteins mapped to red and cyan GO terms, respectively. C, correlation between protein TLS values and abundances (measured in mouse cells). The line indicates the line of best fit. The rS and p-values indicate the Spearman rank correlation coefficient and significance, respectively. D, correlation between median kdeg values and maximum life spans across species for the 500 most (red) and least (cyan) abundant proteins in the data set. CCT, chaperonin-containing tailless complex; GO, gene ontology.
Fig. 4
Fig. 4
Differences in ATP production rates between mouse and naked mole rat cells.A, rates of oxygen consumption (top) and proton efflux (bottom) of mouse (red) and naked mole rat (blue) fibroblasts. Solid vertical lines indicate the injection time of the specified inhibitor. B, measurements of ATP production from glycolysis and oxidative phosphorylation in mouse (red) and naked mole rat (blue) cells. Error bars indicate SD. ∗∗∗p-value < 0.0005. OCR, oxygen consumption rate; PER, proton efflux rate.
Fig. 5
Fig. 5
Proteome-wide differences in steady-state protein levels between mouse and naked mole rat cells.A, the volcano plot of the p-value versus log2 ratio of expression levels in naked mole rat and mouse cells. Blue points represent all proteins, and red points highlight proteins involved in glycolysis and oxidative phosphorylation with significantly altered expression levels. B, distribution of log2 expression level ratios for specified protein subsets. The box plot representations are as described in Figure 1. Red boxes highlight GO terms involved in ATP production. ∗, and ∗∗∗ indicate p-values of less than 0.05, 0.005, and 0.0005, respectively, in comparison with the global distribution using the Mann–Whitney U test. C, western blots of selected proteins from respiratory chain complexes (Uqcrc1, Atp512, Cox4) and glycolysis (Eno1, Gapdh). D, measurements of geometric mean intensities of MitoTracker mitochondrial staining of naked mole rat and mouse cells. GO, gene ontology.
Fig. 6
Fig. 6
Differences in cellular ROS levels between mouse and naked mole rat cells.A, flow cytometry analysis of CellROX fluorescence (ROS levels) and forward scatter (cell size) for mouse (red) and naked mole rat (blue) cells. B, geometric mean intensities of CellROX fluorescence in mouse (red) and naked mole rat (blue) cells. Biological replicates represent cell lines cultured from individual organisms. The two pairs of measurements for biological replicates 2 represent measurements of distinct growths of the same cell line. The two biological replicates were measured using different flow cytometers as described in Experimental Procedures. ROS, reactive oxygen species.
Fig. 7
Fig. 7
Cellular survival in the presence of protein misfolding stress.A, the response to AZC treatment in dividing mouse (red) and naked mole rat (blue) cells. Cell viability represents the fraction of live cells in treated cells relative to untreated cells. B, the response to AZC treatment in quiescent mouse (red) and naked mole rat (blue) cells. Cell viability represents the fraction of cells that excluded trypan blue. Error bars indicate SD. ∗p-value < 0.05. AZC, azetidine-2-carboxylic acid.
Fig. 8
Fig. 8
Accumulation of AZC in the proteomes of mouse and naked mole rat cells.A, the experimental design of proteomic experiments for measurement of AZC incorporation. Blue and red colors indicate 12C-proline and either AZC or 13C-proline, respectively. B, the number of AZC-containing peptides that were quantified in mouse cells treated with either DMSO or 2.5-mM AZC. C, incorporation of 13C-proline (left) and AZC (center, right) in mouse (red) and naked mole rat (blue) cells over time. The box plot representations are as described in Figure 1. The histogram to the right compares AZC incorporation in naked mole rats after 16 days of treatment with mouse cells after 8 days of treatment. D, comparisons of 13C-proline (left) and AZC (center, right) incorporation for individual peptides in mouse and naked mole rat cells. For pairwise comparisons (left, middle), peptides that could be quantified in both mouse and naked mole rat cells at 3 d were compared. Similar plots for other time points are shown in supplemental Fig. S8. For the violin plot (right), log2 ratios of incorporation in mouse and naked mole rat cells are plotted for all peptides for which AZC incorporation could be measured in both species. E, the response to AZC and MG115 treatment in quiescent mouse (red) and naked mole rat (blue) cells. Cells were treated with 5-μM MG115 proteasome inhibitor and varying concentrations of AZC for 4 days. Cell viability represents the fraction of cells that excluded trypan blue, normalized to viability when treated solely with MG115 within each species. Error bars represent SD. ∗p-value < 0.05. F, accumulation of ubiquitinated proteins upon proteasomal inhibition and AZC treatment in mouse and naked mole rat cells. Cells were treated with 5-μM MG115 proteasome inhibitor and 2.5-mM AZC for 4 days, and the extracts were analyzed by Western blots using an anti-ubiquitin antibody. The right plot represents the quantification of the Western blot. The level of ubiquitin in MG115-treated samples for each species was normalized to the level of ubiquitin in the just AZC-treated mouse cells. AZC, azetidine-2-carboxylic acid.

Similar articles

Cited by

References

    1. Klaips C.L., Jayaraj G.G., Hartl F.U. Pathways of cellular proteostasis in aging and disease. J. Cell Biol. 2018;217:51–63. - PMC - PubMed
    1. Labbadia J., Morimoto R.I. The biology of proteostasis in aging and disease. Annu. Rev. Biochem. 2015;84:435–464. - PMC - PubMed
    1. Sontag E.M., Samant R.S., Frydman J. Mechanisms and functions of spatial protein quality control. Annu. Rev. Biochem. 2017;86:97–122. - PubMed
    1. Pratt J.M., Petty J., Riba-Garcia I., Robertson D.H., Gaskell S.J., Oliver S.G., Beynon R.J. Dynamics of protein turnover, a missing dimension in proteomics. Mol. Cell. Proteomics. 2002;1:579–591. - PubMed
    1. Basisty N., Holtz A., Schilling B. Accumulation of “old proteins” and the critical need for MS-based protein turnover measurements in aging and longevity. Proteomics. 2019;20 - PMC - PubMed

Publication types

LinkOut - more resources