

Levodopa affects spike and local field synchronisation in the pedunculopontine nucleus of a rat model of Parkinson's disease
- PMID: 33639616
- PMCID: PMC7993725
- DOI: 10.18632/aging.202585
Levodopa affects spike and local field synchronisation in the pedunculopontine nucleus of a rat model of Parkinson's disease
Abstract
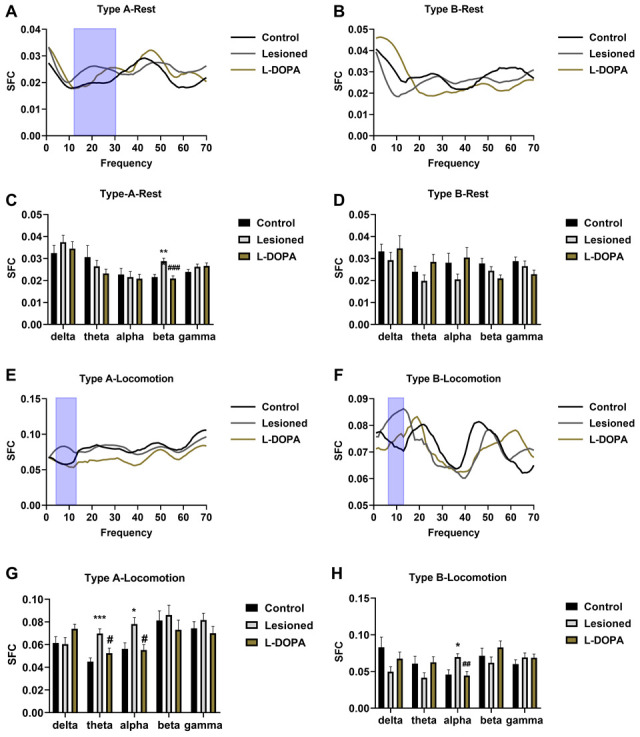
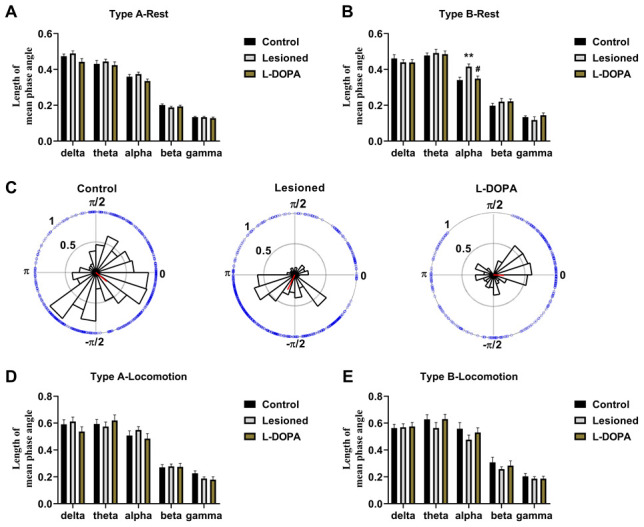
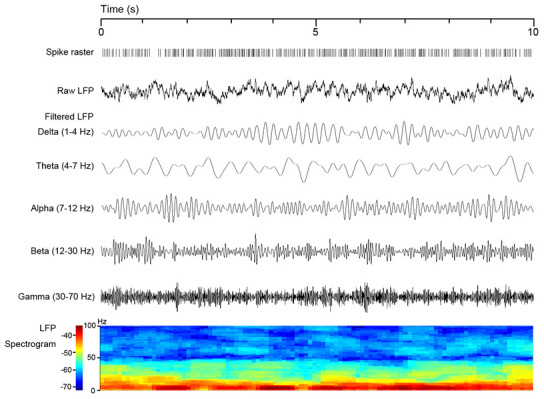
The pedunculopontine nucleus (PPN) undergoes significant anatomic and electrophysiological alterations in Parkinson's disease (PD), severely impacting locomotion. However, the effect of 6-hydroxydopamine (6-OHDA) lesion and levodopa (L-DOPA) therapy on the relationships between spike activities and local field potential (LFP) within the PPN is not well-understood. Synchronisation between the spike activity of individual neurones and LFP of neuronal ensembles is a crucial problem in the pathogenesis of PD. In this study, LFP signals and spikes in the PPN of rats in control, lesioned, and L-DOPA groups were recorded synchronously with a multi-unit electrical signal acquisition system and analysed for their coherence value, spike-field coherence, and phase-lock relationship. The spike-LFP relationship in the PPN was markedly increased in specific frequency bands because of the 6-OHDA lesion but differed depending on the animal locomotion state and neuronal type. L-DOPA had a limited therapeutic effect on the 6-OHDA-induced increase in the coherence value. Our study demonstrates that the PPN spike-LFP relationship is involved in the pathogenesis of PD and is critical for the effects of L-DOPA, providing a basis for the clinical treatment of refractory PD symptoms.
Keywords: Parkinson’s disease; coherence; local field potential; pedunculopontine nucleus; spike.
Conflict of interest statement
Figures
Similar articles
-
Spike and Local Field Synchronization Between the Pedunculopontine Nucleus and Primary Motor Cortex in a Rat Model of Parkinson's Disease.Neuroscience. 2019 Apr 15;404:470-483. doi: 10.1016/j.neuroscience.2019.01.044. Epub 2019 Jan 31. Neuroscience. 2019. PMID: 30710670
-
Effect of l-DOPA on local field potential relationship between the pedunculopontine nucleus and primary motor cortex in a rat model of Parkinson's disease.Behav Brain Res. 2016 Dec 15;315:1-9. doi: 10.1016/j.bbr.2016.08.018. Epub 2016 Aug 8. Behav Brain Res. 2016. PMID: 27515286
-
Altered neuronal activity in the pedunculopontine nucleus: An electrophysiological study in a rat model of Parkinson's disease.Behav Brain Res. 2016 May 15;305:57-64. doi: 10.1016/j.bbr.2016.02.026. Epub 2016 Feb 26. Behav Brain Res. 2016. PMID: 26924016
-
Reciprocal interaction between monoaminergic systems and the pedunculopontine nucleus: Implication in the mechanism of L-DOPA.Neurobiol Dis. 2019 Aug;128:9-18. doi: 10.1016/j.nbd.2018.08.014. Epub 2018 Aug 24. Neurobiol Dis. 2019. PMID: 30149181 Review.
-
What is the therapeutic mechanism of pedunculopontine nucleus stimulation in Parkinson's disease?Neurobiol Dis. 2019 Aug;128:67-74. doi: 10.1016/j.nbd.2018.06.014. Epub 2018 Jun 19. Neurobiol Dis. 2019. PMID: 29933055 Review.
Cited by
-
Assessing the Safety and Therapeutic Efficacy of Cannabidiol Lipid Nanoparticles in Alleviating Metabolic and Memory Impairments and Hippocampal Histopathological Changes in Diabetic Parkinson's Rats.Pharmaceutics. 2024 Apr 8;16(4):514. doi: 10.3390/pharmaceutics16040514. Pharmaceutics. 2024. PMID: 38675175 Free PMC article.
-
A novel curcumin oil solution can better alleviate the motor activity defects and neuropathological damage of a Parkinson's disease mouse model.Front Aging Neurosci. 2022 Jul 29;14:984895. doi: 10.3389/fnagi.2022.984895. eCollection 2022. Front Aging Neurosci. 2022. PMID: 35966793 Free PMC article.
-
The dosage of curcumin to alleviate movement symptoms in a 6-hydroxydopamine-induced Parkinson's disease rat model.Heliyon. 2023 Jun 7;9(6):e16921. doi: 10.1016/j.heliyon.2023.e16921. eCollection 2023 Jun. Heliyon. 2023. PMID: 37484231 Free PMC article.
References
Publication types
MeSH terms
Substances
LinkOut - more resources
Full Text Sources
Other Literature Sources
