. 2021 Mar:65:103243.
doi: 10.1016/j.ebiom.2021.103243. Epub 2021 Feb 24.

Increased apolipoprotein-B:A1 ratio predicts cardiometabolic risk in patients with juvenile onset SLE

Affiliations

Increased apolipoprotein-B:A1 ratio predicts cardiometabolic risk in patients with juvenile onset SLE

George A Robinson et al. EBioMedicine. 2021 Mar.

Abstract

Background: Cardiovascular disease is a leading cause of mortality in patients with juvenile-onset systemic lupus erythematosus (JSLE). Traditional factors for cardiovascular risk (CVR) prediction are less robust in younger patients. More reliable CVR biomarkers are needed for JSLE patient stratification and to identify therapeutic approaches to reduce cardiovascular morbidity and mortality in JSLE.

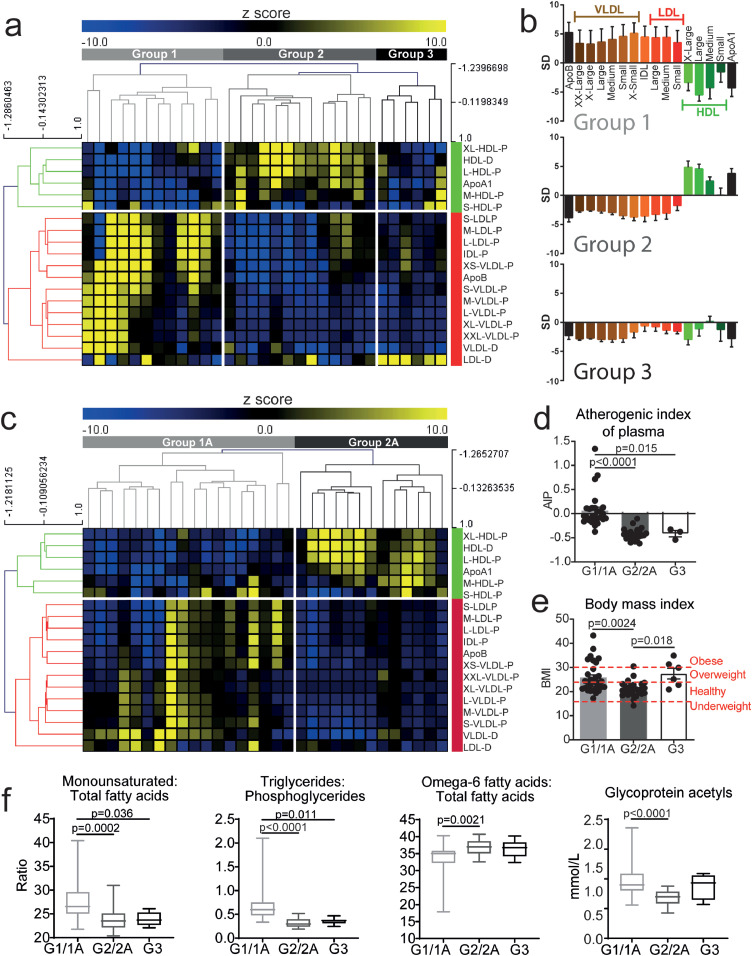
Methods: Serum metabolomic analysis (including >200 lipoprotein measures) was performed on a discovery (n=31, median age 19) and validation (n=31, median age 19) cohort of JSLE patients. Data was analysed using cluster, receiver operating characteristic analysis and logistic regression. RNA-sequencing assessed gene expression in matched patient samples.

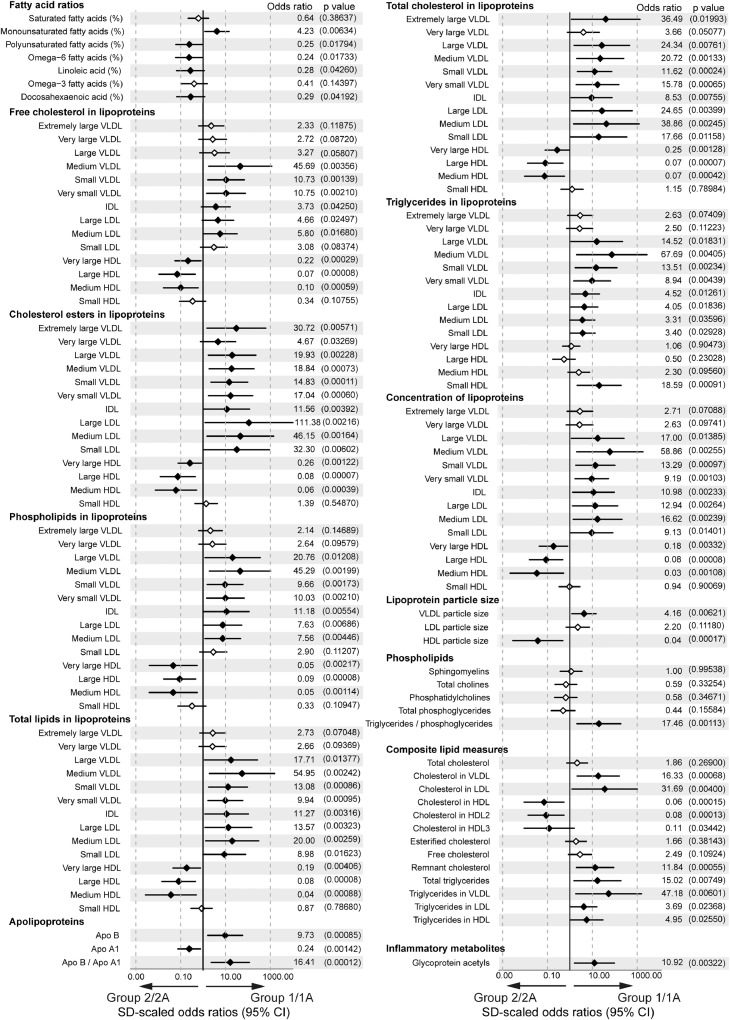
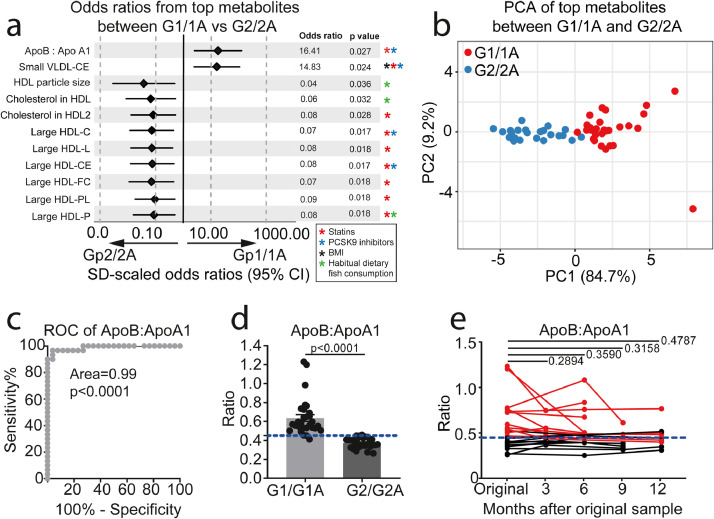
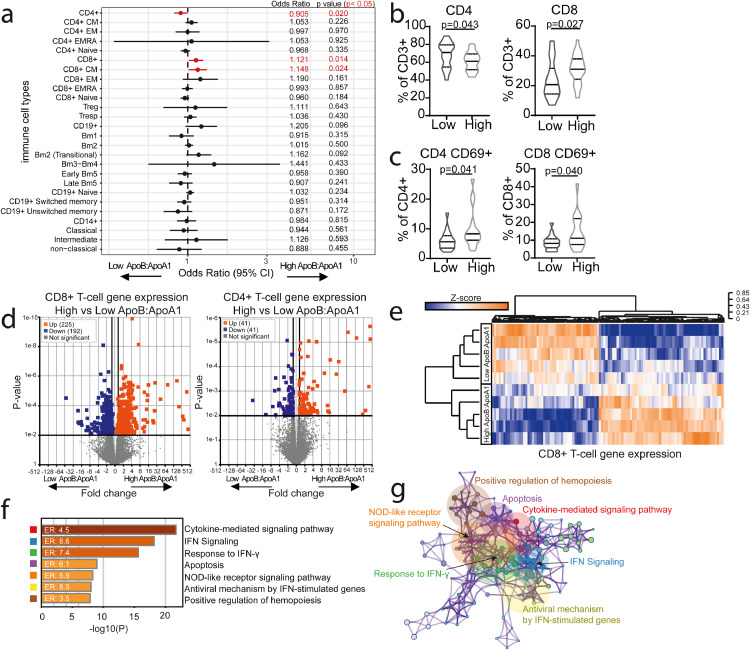
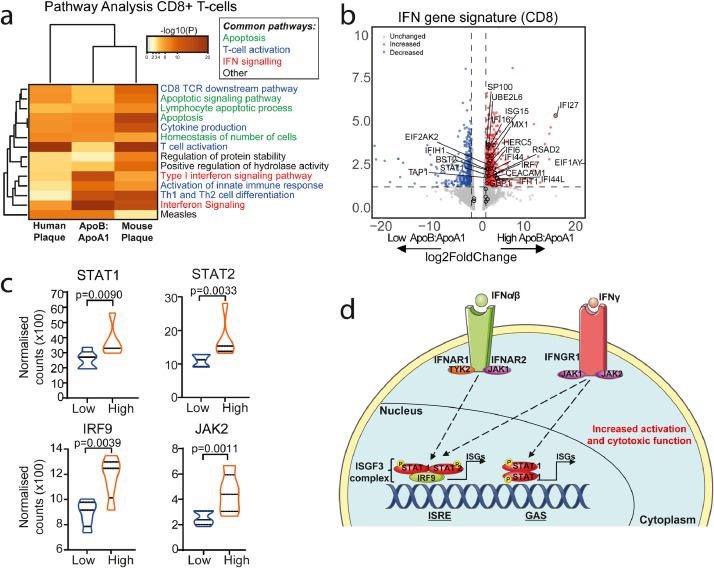
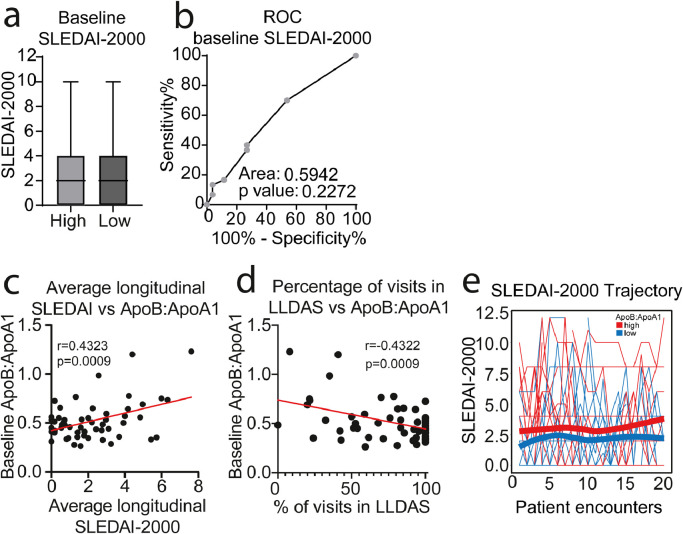
Findings: Hierarchical clustering of lipoprotein measures identified and validated two unique JSLE groups. Group-1 had an atherogenic and Group-2 had an atheroprotective lipoprotien profile. Apolipoprotein(Apo)B:ApoA1 distinguished the two groups with high specificity (96.2%) and sensitivity (96.7%). JSLE patients with high ApoB:ApoA1 ratio had increased CD8+ T-cell frequencies and a CD8+ T-cell transcriptomic profile enriched in genes associated with atherogenic processes including interferon signaling. These metabolic and immune signatures overlapped statistically significantly with lipid biomarkers associated with sub-clinical atherosclerosis in adult SLE patients and with genes overexpressed in T-cells from human atherosclerotic plaque respectively. Finally, baseline ApoB:ApoA1 ratio correlated positively with SLE disease activity index (r=0.43, p=0.0009) and negatively with Lupus Low Disease Activity State (r=-0.43, p=0.0009) over 5-year follow-up.

Interpretation: Multi-omic analysis identified high ApoB:ApoA1 as a potential biomarker of increased cardiometabolic risk and worse clinical outcomes in JSLE. ApoB:ApoA1 could help identify patients that require increased disease monitoring, lipid modification or lifestyle changes.

Funding: Lupus UK, The Rosetrees Trust, British Heart Foundation, UCL & Birkbeck MRC Doctoral Training Programme and Versus Arthritis.

Keywords: CD8+ T cells; Cardiovascular disease; Interferon; Juvenile-onset systemic lupus erythematosus; Lipids.


Conflict of interest statement

Declaration of Competing Interest The authors have declared that no conflict of interest exists.

Figures

Fig 1
Fig. 1
JSLE patient stratification by lipoprotein profile reveals unique and validated patient groups. Metabolomic analysis was performed on serum from a discovery cohort (n=31, a-b) and validation cohort (n=31, c). (a) Heat map showing unbiased hierarchical clustering of lipoprotein particle (P) concentrations and diameters (D) and apolipoproteins (Apo), z-score converted measurements. Groups are labelled; Group-1=light grey, Group-2=dark grey, Group-3=black. Anti- and pro- atherogenic lipoproteins clustered (labelled in green and red respectively). (b) Lipoprotein subclasses measurements from Group-1-3 (from A). Standard deviation (SD) units showing deviation from the mean value of the whole study population. Error bars indicate standard error. (c) Heat map showing unbiased hierarchical clustering of lipoproteins and apolipoproteins using z-score converted measurements. Two groups identified: Group-1A=light grey and Group-2A=dark grey. Anti- and pro- atherogenic lipoproteins clustered (labelled in green and red respectively). (d-e) Discovery and validation JSLE cohort data were combined (Group-1/1A (n=30), Group-2/2A (n=26)) and discovery cohort Group-3 (n=6). (d) Atherogenic index of plasma [Log(Triglycerides/HDL-Cholesterol)] and (e) Body Mass Index (BMI) of patients. Dashed red lines indicate the cut off BMI values for underweight, healthy, overweight and obese. (f) Levels of four metabolites identified previously in SLE patients with pre-clinical plaque in Group-1/1A (n=30), Group-2/2A (n=26)) and discovery cohort Group-3 (n=6). One-way ANOVA. Abbreviations: Apo, apolipoprotein; VLDL, IDL, LDL, HDL, very low, intermediate, low and high-density lipoproteins; XX-large, chylomicrons and extremely large; X-Large, very large; X-small, very small.
Fig 2
Fig. 2
Lipoprotein stratified groups had distinct lipid and inflammatory metabolite profiles. Forest plot showing OR and 95% CI of serum metabolites between Group-1/1A (n=30) and Group-2/2A (n=26) adjusted for age, sex, ethnicity, BMI, disease parameters (CRP, dsDNA, C3, lymphocyte count, disease duration, SLEDAI-2000) and treatment (Hydroxychloroquine, Prednisolone, Mycophenolate Mofetil, Methotrexate, Azathioprine, and Vitamin D). Measurements include specific fatty acids (% of total fatty acids), cholesterol, triglycerides and phospholipids (mmol/l), apolipoproteins (g/l) and in-depth lipoprotein measurements including particle size (nm), concentration and lipid content (mmol/l). Statistically significant differences denoted by solid black diamond; non-statistically significant differences denoted by open diamond. Odds ratio and p values (in brackets) displayed to the right. Associated clinical and demographic parameters affecting metabolite expression are shown in Supplementary Data Table 1. Abbreviations: Apo, apolipoprotein; VLDL, very low-density lipoprotein; IDL, intermediate density lipoprotein; LDL, low density lipoprotein; HDL, high density lipoprotein.
Fig 3
Fig. 3
ApoB:ApoA1 as a clinical biomarker for stratified JSLE groups. (a) Forest plot from logistic regression analysis displaying the OR and 95% CI of 11 metabolites that passed p value correction for multiple testing between Group-1/1A (n=30) and Group-2/2A (n=26). Data was normalised for clinical parameters, demographic information, BMI, disease parameters (CRP, dsDNA, C3, lymphocyte count, disease duration, SLEDAI-2000) and treatment (Prednisolone, Hydroxychloroquine, Mycophenolate, Methotrexate, Azathioprine and Vitamin D). Corrected p-values (Holm-Sidak) displayed for each metabolite. Stars represent metabolites that are statistically significantly affected by BMI (Black), statins (Red)(38-40), PCSK9 inhibitors (Blue)(40) and habitual dietary fish consumption (Green)(41). (b) Principle component analysis using the 11 statistically significant metabolites between Group-1/1A (n=30, red) and Group-2/2A (n=26, blue) identified in (A). (c) ROC curve analysis of the ApoB:ApoA1 ratio of patients in Group-1/1A (n=30) compared to patients in Group-2/2A (n=26). Area under the curve (AUC) displayed. (d) ApoB:ApoA1 ratio (higher ratios=higher risk) measured in Group-1/1A (n=30) and Group-2/2A (n=26). Cut-off identified from the ROC analysis displayed as the blue dashed line. Mean, unpaired two-tailed t-tests. (e) Longitudinal analysis of ApoB:ApoA1 ratio at 3 month intervals over 12 months (baseline (n=22), 3 months (n=9), 6 months (n=12), 9 months (n=6) and 12 months (n=9)). The cut off identified from the ROC curve analysis is displayed as the blue dashed line. Red points/lines represent patients that started with a baseline ApoB:ApoA1 ratio above the cut off. Paired t-tests.
Fig 4
Fig. 4
High ApoB:ApoA1 ratio patients have a unique T-cell phenotype and transcriptomic signature. Peripheral blood mononuclear cells (PBMC's) from high (n=29) and low (n=25) ApoB:ApoA1 ratio JSLE patients were stained ex-vivo to evaluate expression of 28 immune cell subsets by flow cytometry (Supplementary Fig. 1 for gating strategy). (a) Forest plot showing ORs and 95% CIs of 28 immunological parameters analysed by logistic regression adjusted for BMI, sex, age, ethnicity, disease duration, treatment, SLEDAI-2000, CRP, dsDNA, C3. Dotted line represents no effect (OR=1), statistically significant differences between high and low ApoB:ApoA1 patients (in red). iNKT and PDC data is not shown due to very different CI values. See Supplementary Data Table 2 for CIs. (b-c) Violin plots displaying CD4+ and CD8+ T-cell frequencies (b) and CD69 expression (c) between high and low ApoB:ApoA1 ratio groups. T test. FACS-sorted CD8+ (n=5/group) and CD4+ (n=6/group) T-cells from JSLE patients with high and low ApoB:ApoA1 ratio were analysed by RNA-sequencing and whole genome expression compared between the groups. (d) Volcano plots displaying fold changes and p-values, where coloured points represent statistically significantly regulated genes. (e-g) RNA-sequencing analysis for CD8+ T cells. (e) Clustered heatmap of normalised gene counts of statistically significantly altered genes with adjusted p-value threshold (<0.01) (f) Bar charts plotting cluster significance and enrichment ratio (ER) of enriched pathway ontology terms between high and low ApoB:ApoA1 JSLE patients. (g) Network diagram illustrating statistically significantly enriched genetic pathway ontology terms between high and low ApoB:ApoA1 JSLE patients. Similar terms with a high degree of redundancy were clustered into groups as depicted. Each node represents a statistically significantly enriched term, with node size proportional to the number of input genes annotated with this term. See Supplementary Fig. 8.
Fig 5
Fig. 5
High ApoB:ApoA1 ratio patients have a CD8+ T-cell transcriptomic profile associated with atherosclerosis and interferon signalling.(a) Heatmap displaying -log10 p values of statistically significantly enriched genetic pathway ontology terms that overlap in CD8+ T-cell gene list analysis from human atherosclerotic plaques (left), JSLE patients with high vs low ApoB:ApoA1 ratio (n=5/group) (middle), and mouse atherosclerotic plaques (right). (b) Volcano plot (VolcaNoseR https://huygens.science.uva.nl/VolcaNoseR, date last accessed July 2020) showing genes associated with the Interferon (IFN) gene pathway ontology term identified in (a) in CD8+ T-cells from JSLE patients with high vs low ApoB:ApoA1 ratio (n=5/group). Genes overlapping with the SLE-associated IFN signature described in are labelled. Log2 Fold change and p-value plotted, coloured points represent statistically significantly regulated genes. (c) Violin plots comparing normalised CD8+ T-cell gene counts from JSLE patients with high vs low ApoB:ApoA1 (n=5/group) in the IFN-stimulated gene factor 3 transcription complex (ISGF3) complex IFN signaling pathway. Unpaired t test. (d) Summary diagram of ISGF3 signaling. Abbreviations: Interferon-α/β/γ (IFNα/β/γ), interferon regulatory factor 9 (IRF9), interferon stimulated genes (ISGs). Janus kinase 2 (JAK2), signal transducer and activator of transcription 1/2 (STAT1/2), tyrosine kinase 2 (TYK2), interferon alpha and beta receptor subunit 1/2 (IFNAR1/2), interferon gamma receptor 1 (IFNGR1), interferon sensitive response element (ISRE), gamma-activated sequence (GAS), phosphate group (P) (also see Supplementary Fig. 9).
Fig 6
Fig. 6
Longitudinal analysis of disease activity differs between high and low ApoB:ApoA1 ratio groups. (a) Systemic Lupus Erythematosus Disease Activity index (SLEDAI-2000) comparison between high (n=30, red) and low (n=26, blue) ApoB:ApoA1 ratio JSLE patients. Box and Whisker plot showing mean and 1st/3rd quartiles and minimum/maximum values, T test. (b) ROC curve analysis of baseline SLEDAI-2000 score of patients in Group-1/1A (n=30) compared to patients in Group-2/2A (n=26). Area under the curve (AUC) displayed. (c) Pearson's correlation between baseline ApoB:ApoA1 ratio and average SLEDAI-2000 of JSLE patients (n=56) measured over 3-7 years of follow up (mean years of follow-up per patient=4.9, mean number of visits per patient=17.1). (d) Pearson's correlation between baseline ApoB:ApoA1 ratio and longitudinal Lupus Low Disease Activity State (LLDAS) (n=56). (e) Longitudinal assessment of JSLE patient (n=56) SLEDAI-2000 score trajectories over 20 clinical encounters displayed as spaghetti plots. Each line represents one JSLE patient. Red=patients with high baseline ApoB:ApoA1; Blue=patients with low baseline ApoB:ApoA1. Smoothing lines were added to indicate the trend of high and low ApoB:ApoA1 groups.

Comment in

Similar articles

Cited by

References

    1. Ambrose N, Morgan TA, Galloway J, Ionnoau Y, Beresford MW, Isenberg DA. Differences in disease phenotype and severity in SLE across age groups. Lupus. 2016;25(14):1542–1550. - PMC - PubMed
    1. Hersh AO, Trupin L, Yazdany J, Panopalis P, Julian L, Katz P. Childhood-onset disease as a predictor of mortality in an adult cohort of patients with systemic lupus erythematosus. Arthritis Care Res (Hoboken) 2010;62(8):1152–1159. - PMC - PubMed
    1. Bakshi J, Segura BT, Wincup C, Rahman A. Unmet needs in the pathogenesis and treatment of systemic lupus erythematosus. Clin Rev Allergy Immun. 2018;55(3):352–367. - PMC - PubMed
    1. Bernatsky S, Boivin J-F, Joseph L, Manzi S, Ginzler E, Gladman DD. Mortality in systemic lupus erythematosus. Arthritis Rheumatism. 2006;54(8):2550–2557. - PubMed
    1. Nossent J, Cikes N, Kiss E, Marchesoni A, Nassonova V, Mosca M. Current causes of death in systemic lupus erythematosus in Europe, 2000—2004: relation to disease activity and damage accrual. Lupus. 2007;16(5):309–317. - PubMed

MeSH terms