

New Insights Into Understanding Rotor Versus Focal Activation in Patients With Persistent Atrial Fibrillation
- PMID: 33640352
- PMCID: PMC8319037
- DOI: 10.1016/j.jacep.2020.12.010
New Insights Into Understanding Rotor Versus Focal Activation in Patients With Persistent Atrial Fibrillation
Abstract
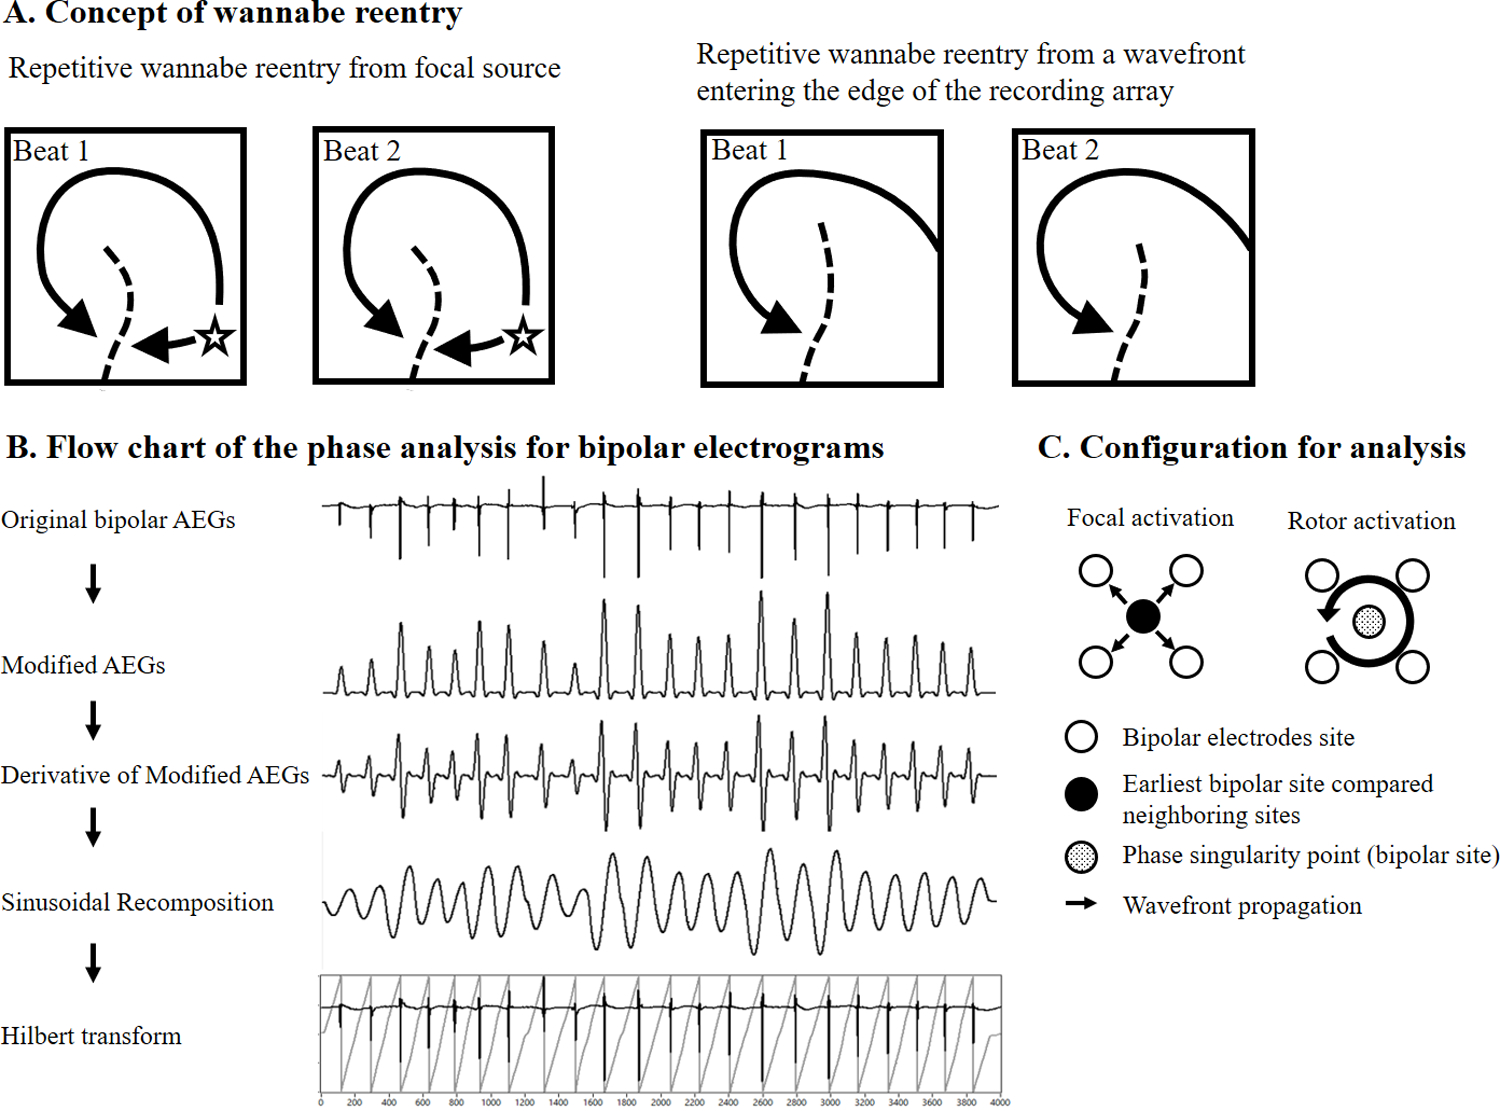
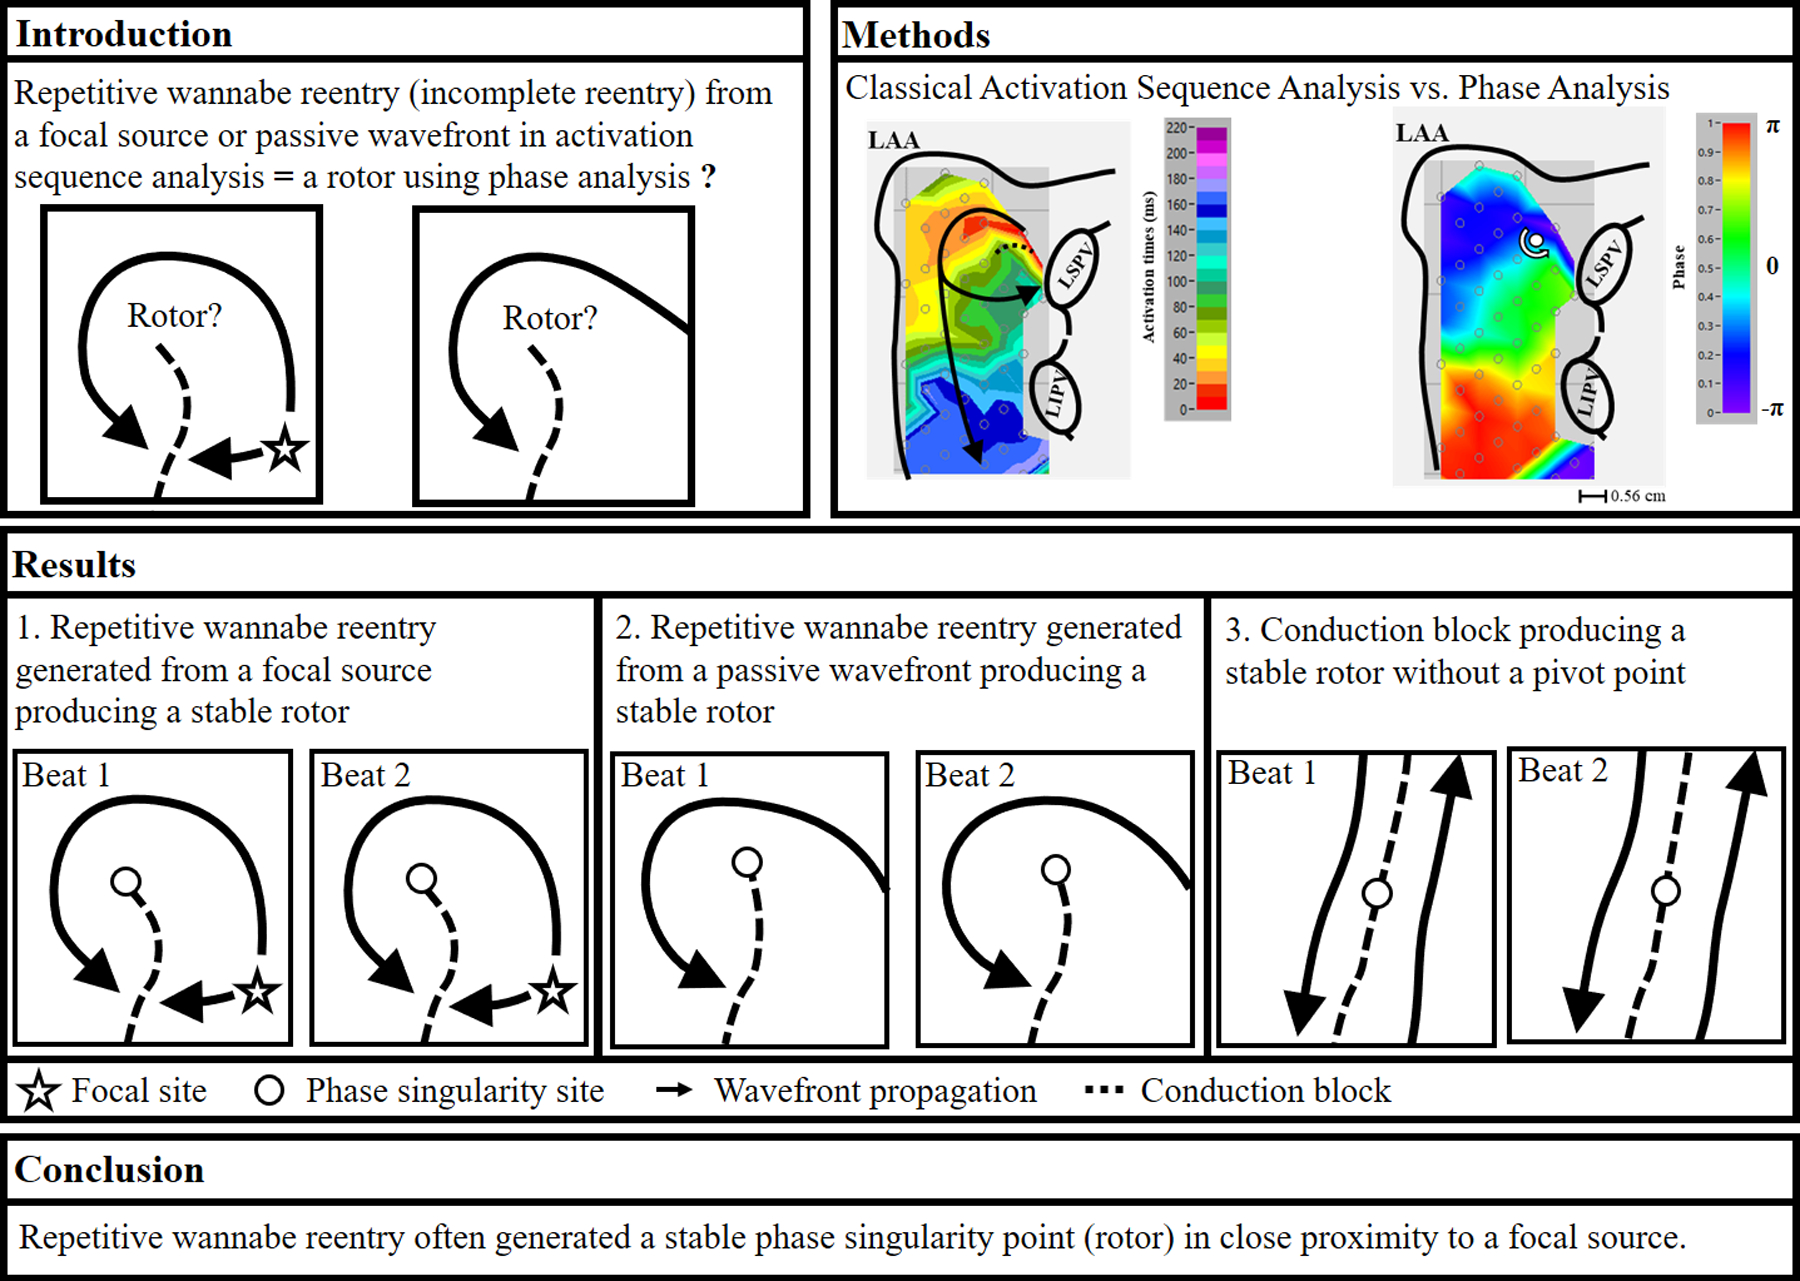
Objectives: This study was to test the hypotheses that: 1) when using phase analysis, repetitive Wannabe re-entry produces a phase singularity point (i.e., a rotor); and 2) the location of the stable rotor is close to the focal source.
Background: Recent contact mapping studies in patients with persistent atrial fibrillation (AF) demonstrated that phase analysis produced a different mechanistic result than classical activation sequence analysis. Our studies in patients with persistent AF showed that focal sources sometimes produced repetitive Wannabe re-entry, that is, incomplete re-entry.
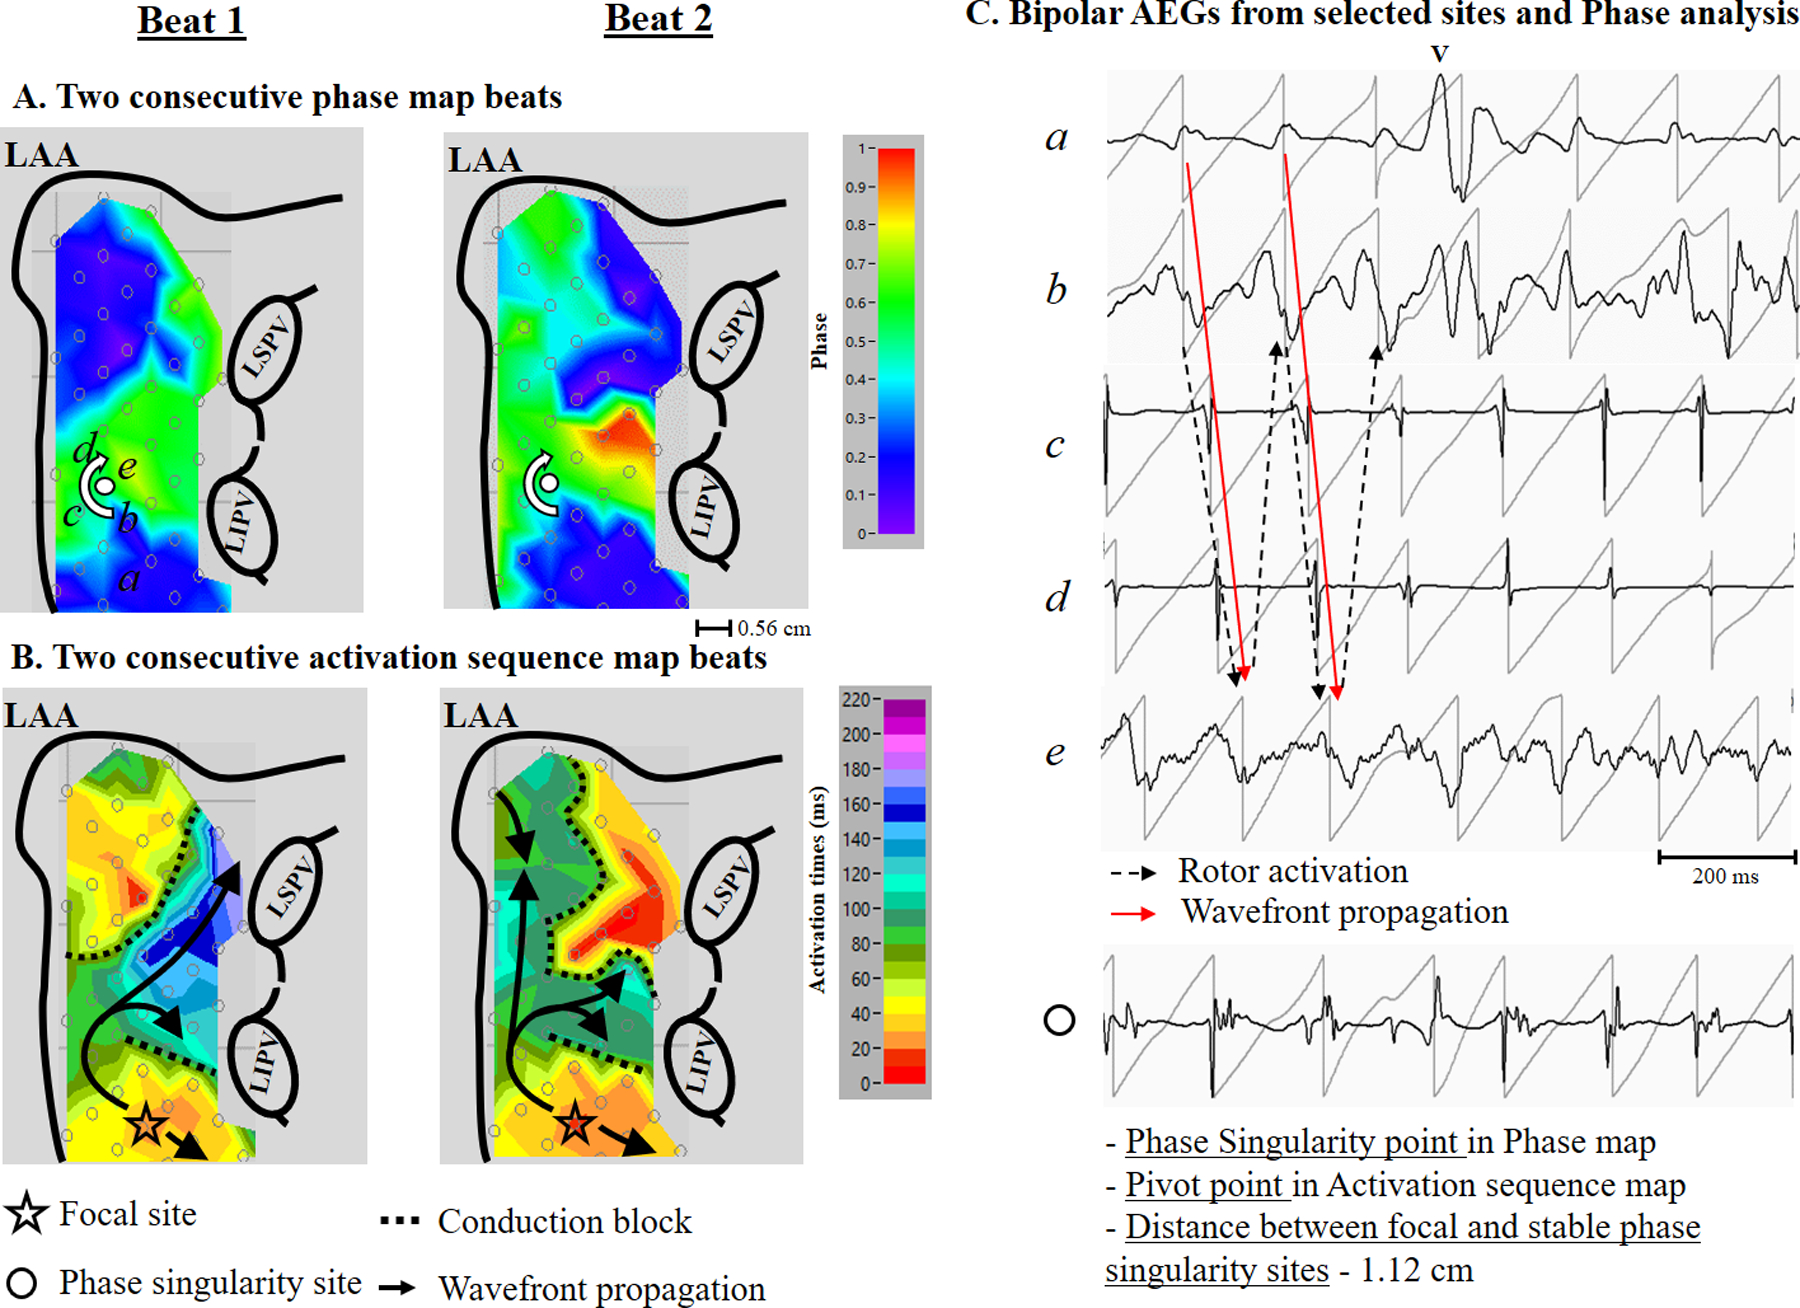
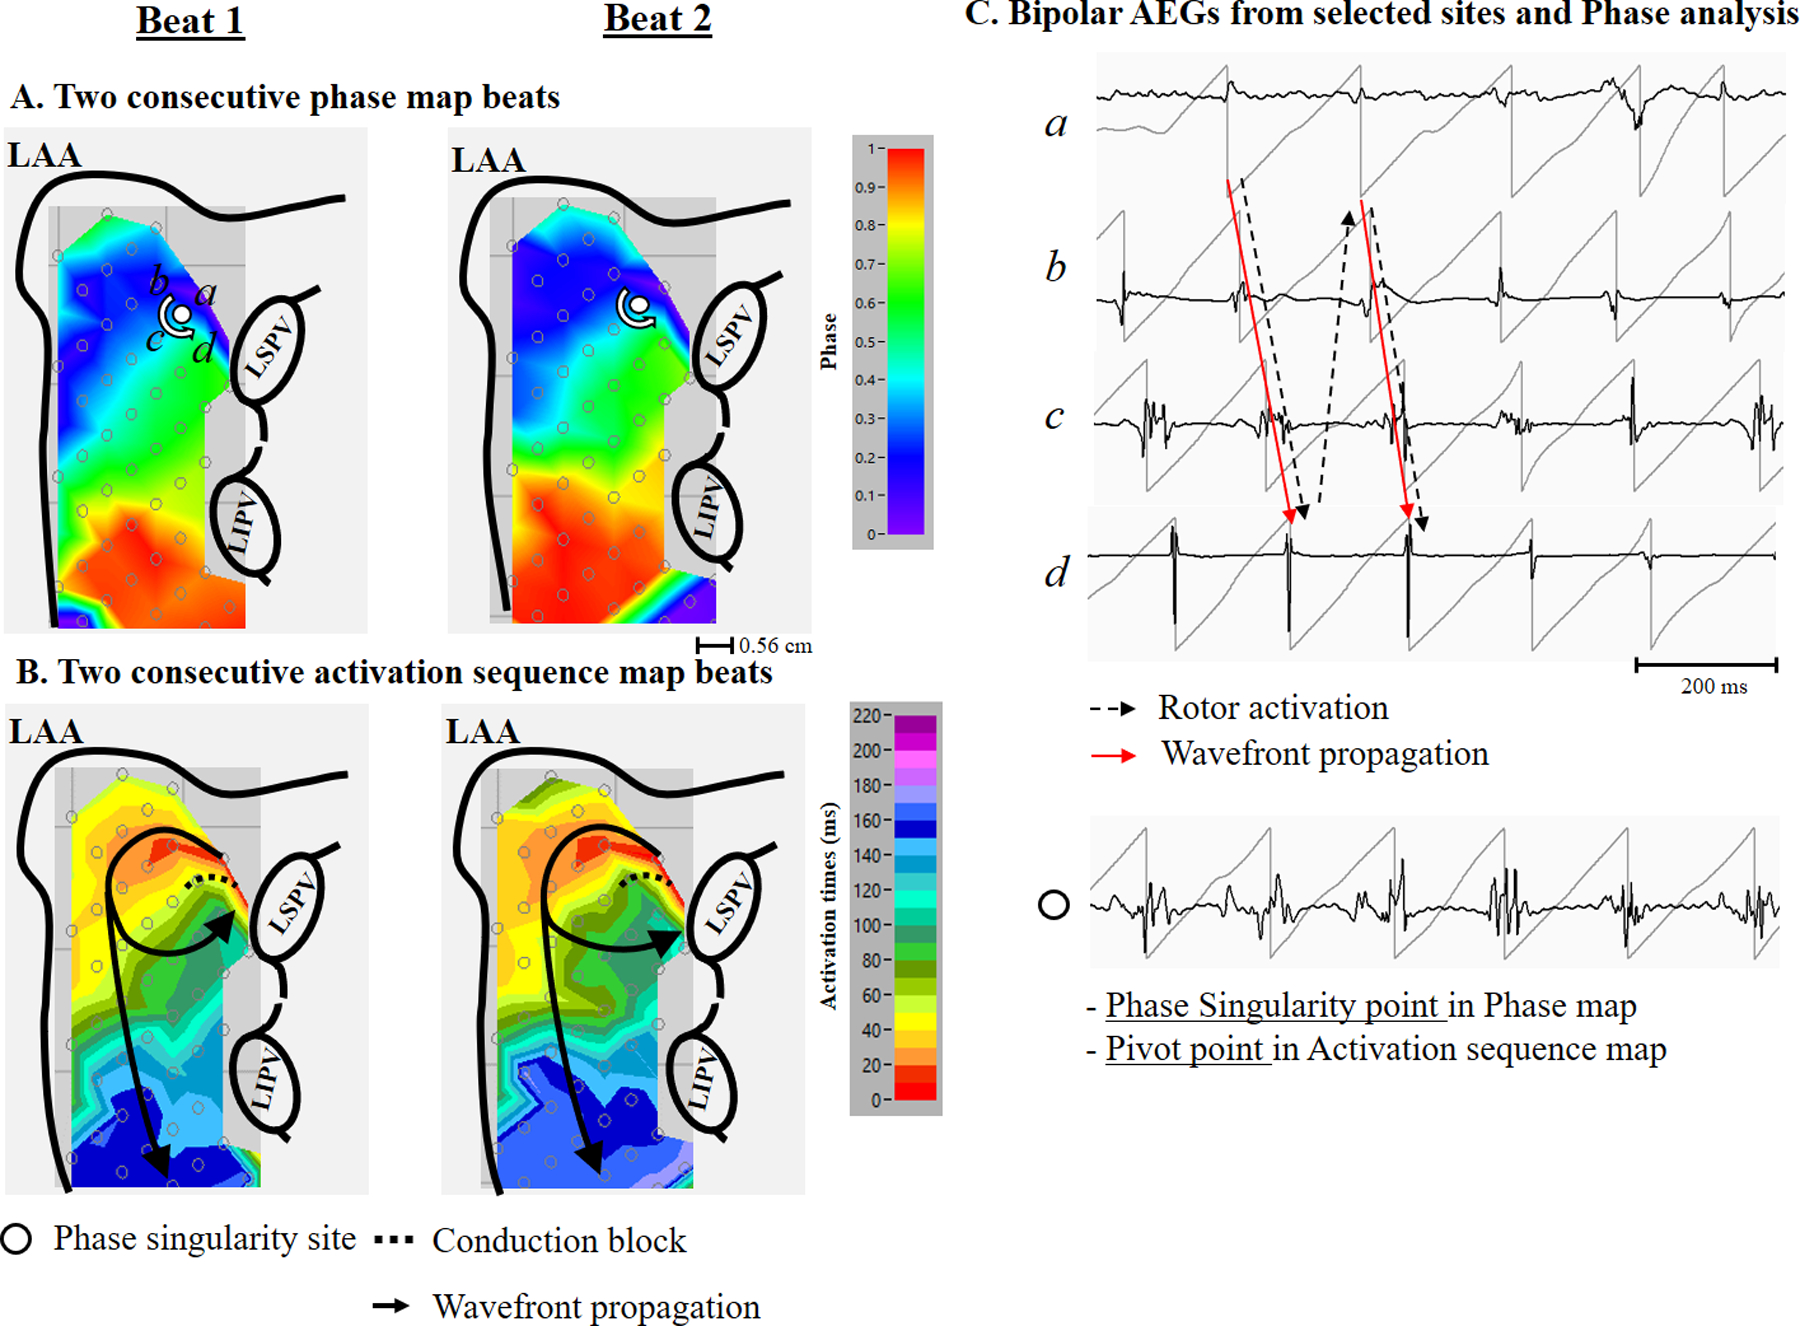
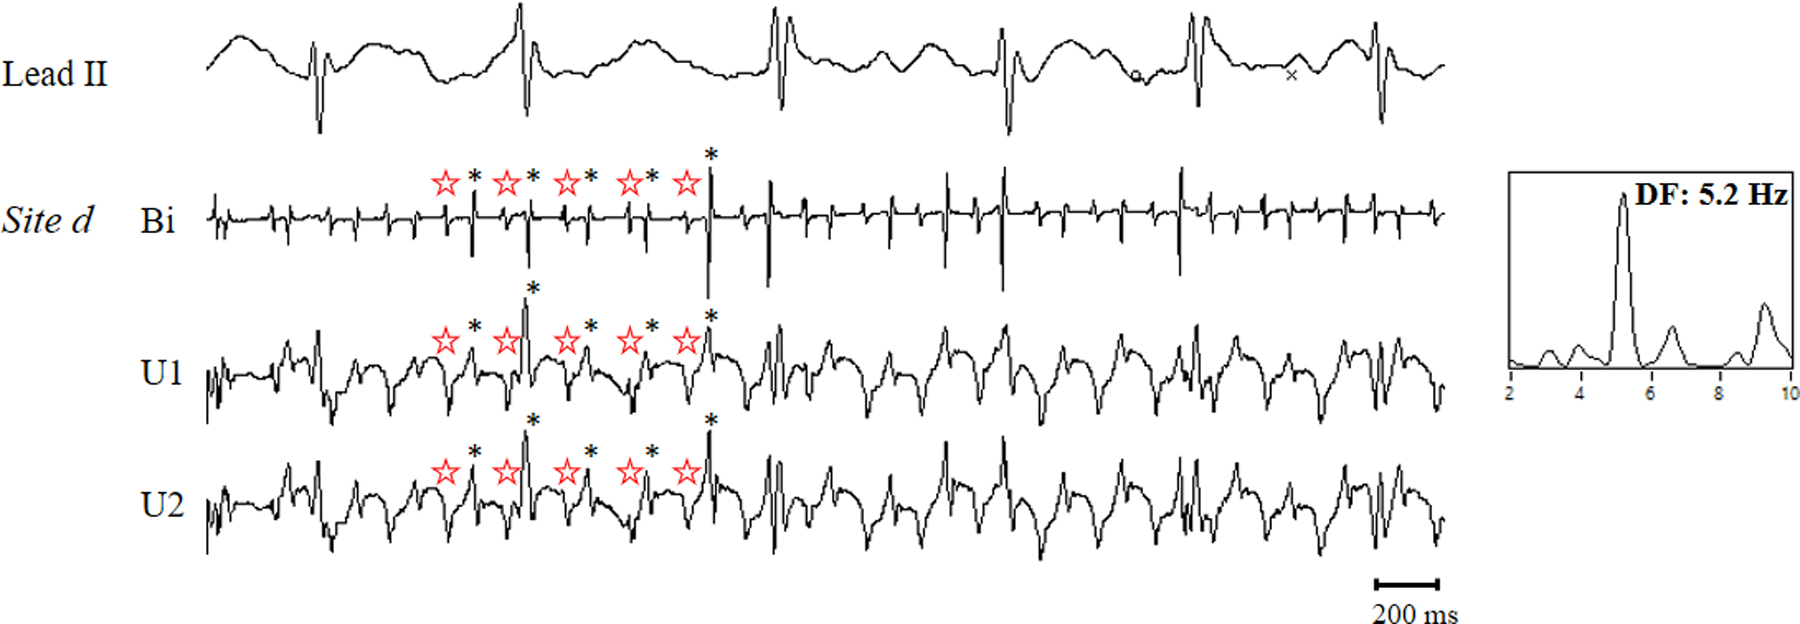
Methods: During open heart surgery, we recorded activation from both atria simultaneously using 510 to 512 electrodes in 12 patients with persistent AF. We performed activation sequence mapping and phase analyses on 4 s of mapped data. For each detected stable rotor (>2 full rotations [720°] recurring at the same site), the corresponding activation patterns were examined from the activation sequence maps.
Results: During AF, phase singularity points (rotors) were identified in both atria in all patients. However, stable phase singularity points were only present in 6 of 12 patients. The range of stable phase singularity points per patient was 0 to 6 (total 14). Stable phase singularity points were produced due to repetitive Wannabe re-entry generated from a focal source or by passive activation. A conduction block sometimes created a stable phase singularity point (n = 2). The average distance between a focal source and a stable rotor was 0.9 ± 0.3 cm.
Conclusions: Repetitive Wannabe re-entry generated stable rotors adjacent to a focal source. No true re-entry occurred.
Keywords: atrial fibrillation; focal sources; mapping; reentry; rotors.
Copyright © 2021 American College of Cardiology Foundation. Published by Elsevier Inc. All rights reserved.
Conflict of interest statement
Funding Support and Author Disclosures This work was supported in part by grants from R01 HL146463 from the National Institutes of Health, National Heart, Lung, and Blood Institute; and by the Elisabeth Severance Prentiss Foundation. The authors have reported that they have no relationships relevant to the contents of this paper to disclose.
Figures

Comment in
-
Role of Scar and Rotors in Persistent Atrial Fibrillation: Miles to Go Before We Sleep.JACC Clin Electrophysiol. 2021 Jul;7(7):920-922. doi: 10.1016/j.jacep.2021.06.005. JACC Clin Electrophysiol. 2021. PMID: 34294390 No abstract available.
Similar articles
-
An Evaluation of Phase Analysis to Interpret Atrial Activation Patterns during Persistent Atrial Fibrillation for Targeted Ablation.J Clin Med. 2022 Sep 30;11(19):5807. doi: 10.3390/jcm11195807. J Clin Med. 2022. PMID: 36233675 Free PMC article.
-
Stability of rotors and focal sources for human atrial fibrillation: focal impulse and rotor mapping (FIRM) of AF sources and fibrillatory conduction.J Cardiovasc Electrophysiol. 2014 Dec;25(12):1284-92. doi: 10.1111/jce.12559. Epub 2014 Nov 11. J Cardiovasc Electrophysiol. 2014. PMID: 25263408
-
Non-invasive identification of stable rotors and focal sources for human atrial fibrillation: mechanistic classification of atrial fibrillation from the electrocardiogram.Europace. 2013 Sep;15(9):1249-58. doi: 10.1093/europace/eut038. Epub 2013 Feb 28. Europace. 2013. PMID: 23449925 Free PMC article.
-
Demystifying rotors and their place in clinical translation of atrial fibrillation mechanisms.Nat Rev Cardiol. 2017 Sep;14(9):509-520. doi: 10.1038/nrcardio.2017.37. Epub 2017 Apr 6. Nat Rev Cardiol. 2017. PMID: 28383023 Review.
-
Mapping and ablating stable sources for atrial fibrillation: summary of the literature on Focal Impulse and Rotor Modulation (FIRM).J Interv Card Electrophysiol. 2014 Sep;40(3):237-44. doi: 10.1007/s10840-014-9889-8. Epub 2014 Mar 20. J Interv Card Electrophysiol. 2014. PMID: 24647673 Review.
Cited by
-
"Pharmacological" analysis of atrial fibrillation maintenance mechanism: reentry, wavelets, or focal?Front Cardiovasc Med. 2025 Jan 24;12:1447542. doi: 10.3389/fcvm.2025.1447542. eCollection 2025. Front Cardiovasc Med. 2025. PMID: 39925977 Free PMC article. Review.
-
Asymptomatic left circumflex artery stenosis is associated with higher arrhythmia recurrence after persistent atrial fibrillation ablation.Front Cardiovasc Med. 2022 Sep 26;9:873135. doi: 10.3389/fcvm.2022.873135. eCollection 2022. Front Cardiovasc Med. 2022. PMID: 36225960 Free PMC article.
-
An Evaluation of Phase Analysis to Interpret Atrial Activation Patterns during Persistent Atrial Fibrillation for Targeted Ablation.J Clin Med. 2022 Sep 30;11(19):5807. doi: 10.3390/jcm11195807. J Clin Med. 2022. PMID: 36233675 Free PMC article.
-
Atrial fibrillation nomenclature, definitions, and mechanisms: Position paper from the international Working Group of the Signal Summit.Heart Rhythm. 2025 Jun;22(6):1480-1491. doi: 10.1016/j.hrthm.2024.11.012. Epub 2024 Nov 17. Heart Rhythm. 2025. PMID: 39561931 Free PMC article. Review.
-
Reliable pace termination of postoperative atrial fibrillation in the canine sterile pericarditis model: Implications for atypical atrial flutter.Heart Rhythm O2. 2022 Jan 13;3(1):91-96. doi: 10.1016/j.hroo.2022.01.003. eCollection 2022 Feb. Heart Rhythm O2. 2022. PMID: 35243440 Free PMC article.
References
-
- Narayan SM, Krummen DE, Clopton P, Shivkumar K, Miller JM. Direct or Coincidental Elimination of Stable Rotors or Focal Sources May Explain Successful Atrial Fibrillation AblationOn-Treatment Analysis of the CONFIRM Trial (Conventional Ablation for AF With or Without Focal Impulse and Rotor Modulation). Journal of the American College of Cardiology 2013;62:138–147. - PMC - PubMed
-
- Miller JM, Kalra V, Das MK et al. Clinical Benefit of Ablating Localized Sources for Human Atrial Fibrillation: The Indiana University FIRM Registry. Journal of the American College of Cardiology 2017;69:1247–1256. - PubMed
-
- Lim HS, Hocini M, Dubois R et al. Complexity and Distribution of Drivers in Relation to Duration of Persistent Atrial Fibrillation. J Am Coll Cardiol 2017;69:1257–1269. - PubMed
-
- Gizurarson S, Dalvi R, Das M, Ha ACT, Suszko A, Chauhan VS. Hierarchical Schema for Identifying Focal Electrical Sources During Human Atrial FibrillationImplications for Catheter-Based Atrial Substrate Ablation. JACC: Clinical Electrophysiology 2016;2:656–666. - PubMed
-
- Haissaguerre M, Hocini M, Denis A et al. Driver Domains in Persistent Atrial Fibrillation. Circulation 2014;130:530–538. - PubMed
Publication types
MeSH terms
Grants and funding
LinkOut - more resources
Full Text Sources
Other Literature Sources
Medical
