. 2021 Jun:147:106483.
doi: 10.1016/j.ypmed.2021.106483. Epub 2021 Feb 26.

Temporal changes in allostatic load patterns by age, race/ethnicity, and gender among the US adult population; 1988-2018

Affiliations

Temporal changes in allostatic load patterns by age, race/ethnicity, and gender among the US adult population; 1988-2018

Justin Xavier Moore et al. Prev Med. 2021 Jun.

Abstract

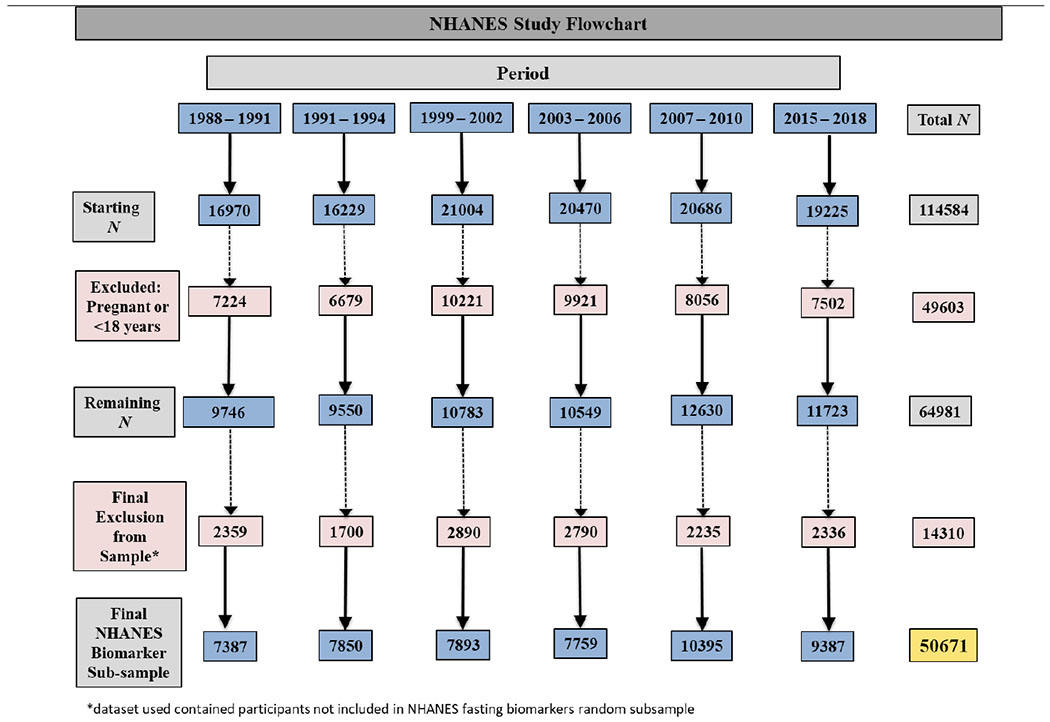
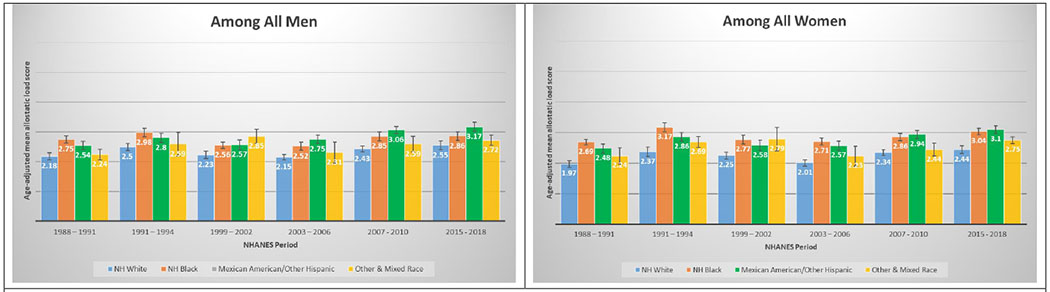
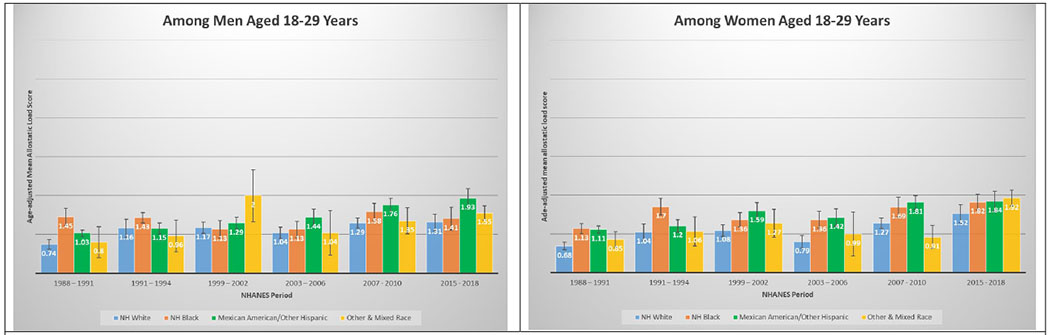
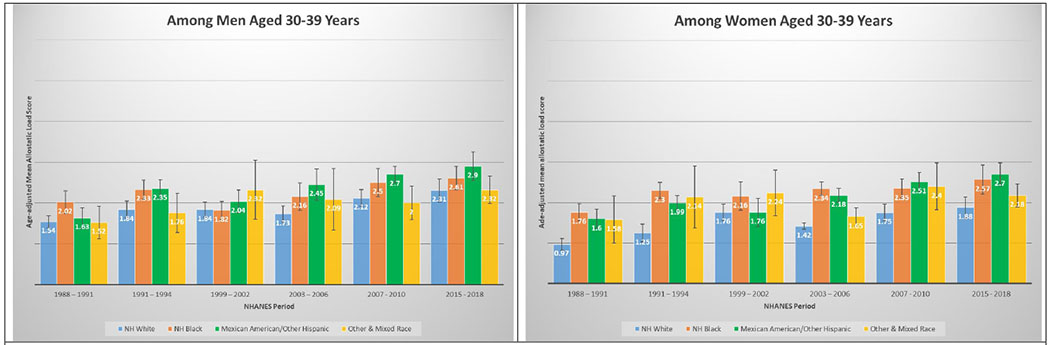
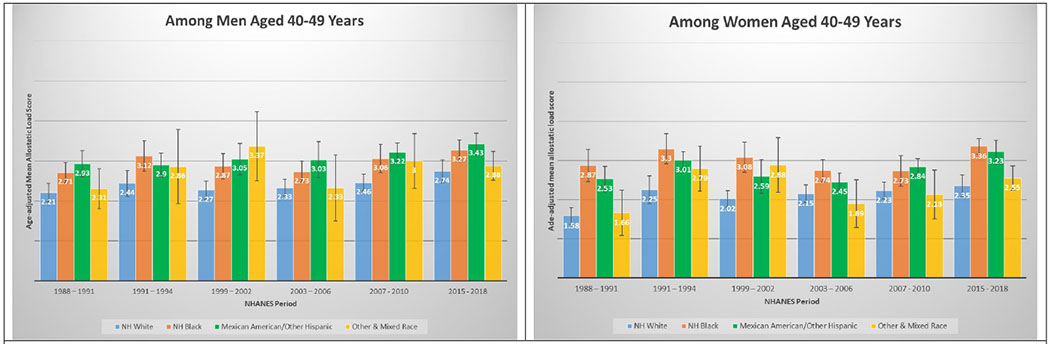
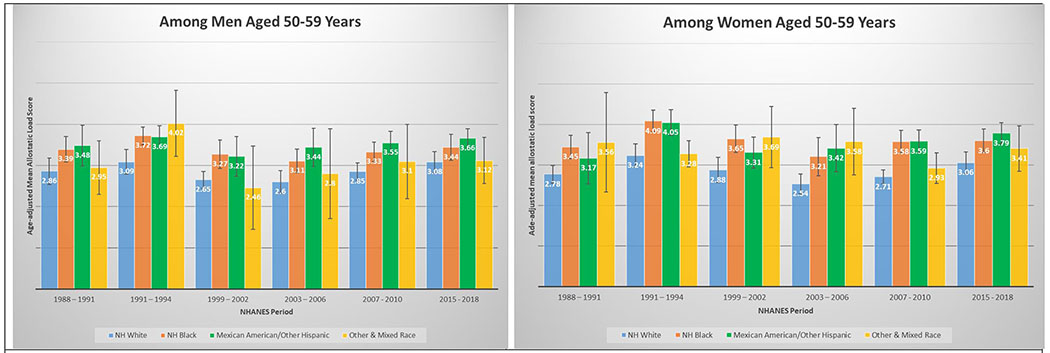
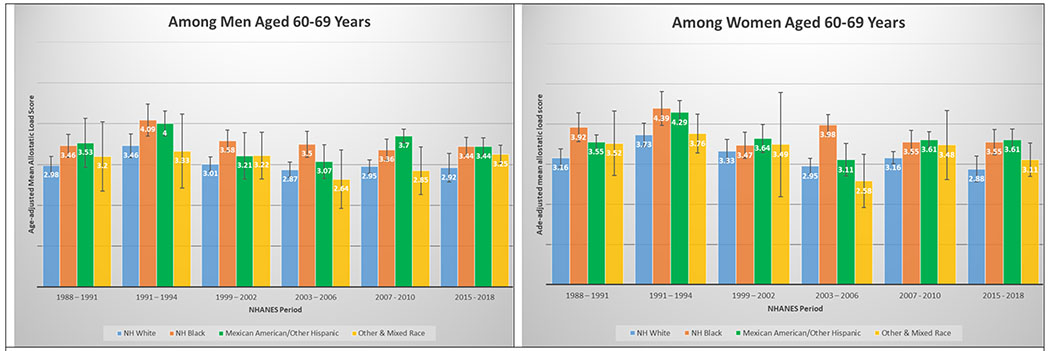
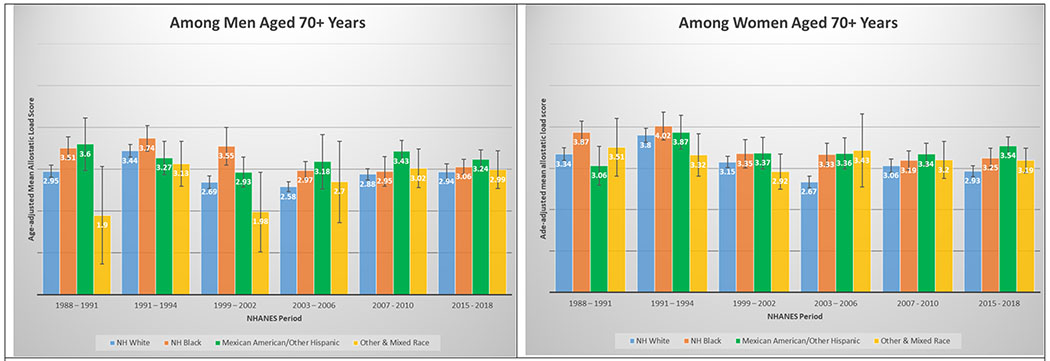
The objective of this study is to provide an assessment of allostatic load (AL) burden among US adults across race/ethnicity, gender, and age groups over a 30-year time period. We analyzed data from 50,671 participants of the National Health and Nutrition Examination Survey (NHANES) years 1988 through 2018. AL score was defined as the sum total for abnormal measures of the following components: serum albumin, body mass index, serum C - reactive protein, serum creatinine, diastolic blood pressure, glycated hemoglobin, systolic blood pressure, total cholesterol, and serum triglycerides. We performed modified Poisson regression to estimate the adjusted Relative Risks (aRRs) of allostatic load, and generalized linear models to determine adjusted mean differences accounting for NHANES sampling weights. Among US adults aged 18 or older, the prevalence of high AL increased by more than 45% from 1988 to 1991 to 2015-2018, from 33.5% to 48.6%. By the latest period, 2015-2018, Non-Hispanic Black women (aRR: 1.292; 95% CI: 1.290-1.293) and Latina women (aRR: 1.266; 95% CI: 1.265-1.267) had higher risks of AL than non-Hispanic White women. Similar trends were observed among men. Age-adjusted mean AL score among NH-Black and Latinx adults was higher than for NH-Whites of up to a decade older regardless of gender. From 1988 through 2018, Adults aged 40 years old and older had over 2-fold increased risks of high AL when compared to adults 18-29 years old. After 30-years of collective data, racial disparities in allostatic load persist for NH-Black and Latinx adults.

Keywords: Cumulative stress; Disparities; Life-course; Psychosocial stress; Race.


Figures

Figure 1:
Figure 1:
Flowchart of exclusion criteria and final study population of NHANES participants by study periods.
Figures 2
Figures 2
2A and 2B. Age-adjusted mean allostatic load scores among US adults, National Health and Nutrition Examination Survey (NHANES), 1988–2018. Panel A represents age-adjusted mean allostatic load scores among men, and panel B represents age-adjusted mean allostatic load scores among women. Based on the sum total of components with high-risk thresholds: albumin, BMI, C-reactive protein, creatinine clearance, diastolic blood pressure, glycated hemoglobin, systolic blood pressure, total cholesterol, triglycerides. Score range from 0 to 9 for all NHANES years.
Figures 3
Figures 3
3A and 3B. Age-adjusted mean allostatic load scores among US adults aged 18 – 29, National Health and Nutrition Examination Survey (NHANES), 1988–2018. Panel A represents age-adjusted mean allostatic load scores among men, and panel B represents age-adjusted mean allostatic load scores among women. Based on the sum total of components with high-risk thresholds: albumin, BMI, C-reactive protein, creatinine clearance, diastolic blood pressure, glycated hemoglobin, systolic blood pressure, total cholesterol, triglycerides. Score range from 0 to 9 for all NHANES years. 3C and 3D. Age-adjusted mean allostatic load scores among US adults aged 30 – 39, National Health and Nutrition Examination Survey (NHANES), 1988–2018. Panel A represents age-adjusted mean allostatic load scores among men, and panel B represents age-adjusted mean allostatic load scores among women. 3E and 3F. Age-adjusted mean allostatic load scores among US adults aged 40 – 49, National Health and Nutrition Examination Survey (NHANES), 1988–2010. Panel A represents age-adjusted mean allostatic load scores among men, and panel B represents age-adjusted mean allostatic load scores among women. 3G and 3H. Age-adjusted mean allostatic load scores among US adults aged 50 – 59, National Health and Nutrition Examination Survey (NHANES), 1988–2010. Panel A represents age-adjusted mean allostatic load scores among men, and panel B represents age-adjusted mean allostatic load scores among women. 3I and 3J. Age-adjusted mean allostatic load scores among US adults aged 60 – 69, National Health and Nutrition Examination Survey (NHANES), 1988–2010. Panel A represents age-adjusted mean allostatic load scores among men, and panel B represents age-adjusted mean allostatic load scores among women. 3K and 3L. Age-adjusted mean allostatic load scores among US adults aged 70+, National Health and Nutrition Examination Survey (NHANES), 1988–2010. Panel A represents age-adjusted mean allostatic load scores among men, and panel B represents age-adjusted mean allostatic load scores among women.
Figures 3
Figures 3
3A and 3B. Age-adjusted mean allostatic load scores among US adults aged 18 – 29, National Health and Nutrition Examination Survey (NHANES), 1988–2018. Panel A represents age-adjusted mean allostatic load scores among men, and panel B represents age-adjusted mean allostatic load scores among women. Based on the sum total of components with high-risk thresholds: albumin, BMI, C-reactive protein, creatinine clearance, diastolic blood pressure, glycated hemoglobin, systolic blood pressure, total cholesterol, triglycerides. Score range from 0 to 9 for all NHANES years. 3C and 3D. Age-adjusted mean allostatic load scores among US adults aged 30 – 39, National Health and Nutrition Examination Survey (NHANES), 1988–2018. Panel A represents age-adjusted mean allostatic load scores among men, and panel B represents age-adjusted mean allostatic load scores among women. 3E and 3F. Age-adjusted mean allostatic load scores among US adults aged 40 – 49, National Health and Nutrition Examination Survey (NHANES), 1988–2010. Panel A represents age-adjusted mean allostatic load scores among men, and panel B represents age-adjusted mean allostatic load scores among women. 3G and 3H. Age-adjusted mean allostatic load scores among US adults aged 50 – 59, National Health and Nutrition Examination Survey (NHANES), 1988–2010. Panel A represents age-adjusted mean allostatic load scores among men, and panel B represents age-adjusted mean allostatic load scores among women. 3I and 3J. Age-adjusted mean allostatic load scores among US adults aged 60 – 69, National Health and Nutrition Examination Survey (NHANES), 1988–2010. Panel A represents age-adjusted mean allostatic load scores among men, and panel B represents age-adjusted mean allostatic load scores among women. 3K and 3L. Age-adjusted mean allostatic load scores among US adults aged 70+, National Health and Nutrition Examination Survey (NHANES), 1988–2010. Panel A represents age-adjusted mean allostatic load scores among men, and panel B represents age-adjusted mean allostatic load scores among women.

References

    1. Beckie TM. A systematic review of allostatic load, health, and health disparities. Biol Res Nurs. 2012;14(4):311–346. - PubMed
    1. Zavala VA, Bracci PM, Carethers JM, et al. Cancer health disparities in racial/ethnic minorities in the United States. Br J Cancer. 2021;124(2):315–332. - PMC - PubMed
    1. Krieger N, Waterman PD, Kosheleva A, et al. Racial discrimination & cardiovascular disease risk: my body my story study of 1005 US-born black and white community health center participants (US). PloS one. 2013;8(10):e77174. - PMC - PubMed
    1. Moore JX, Chaudhary N, Akinyemiju T. Metabolic Syndrome Prevalence by Race/Ethnicity and Sex in the United States, National Health and Nutrition Examination Survey, 1988-2012. Preventing chronic disease. 2017;14:E24. - PMC - PubMed
    1. Moore JX, Royston KJ, Langston ME, et al. Mapping hot spots of breast cancer mortality in the United States: place matters for Blacks and Hispanics. Cancer causes & control : CCC. 2018;29(8):737–750. - PMC - PubMed

Publication types