. 2021 Jun:201:102027.
doi: 10.1016/j.pneurobio.2021.102027. Epub 2021 Feb 25.

Human hippocampal connectivity is stronger in olfaction than other sensory systems

Affiliations

Human hippocampal connectivity is stronger in olfaction than other sensory systems

Guangyu Zhou et al. Prog Neurobiol. 2021 Jun.

Abstract

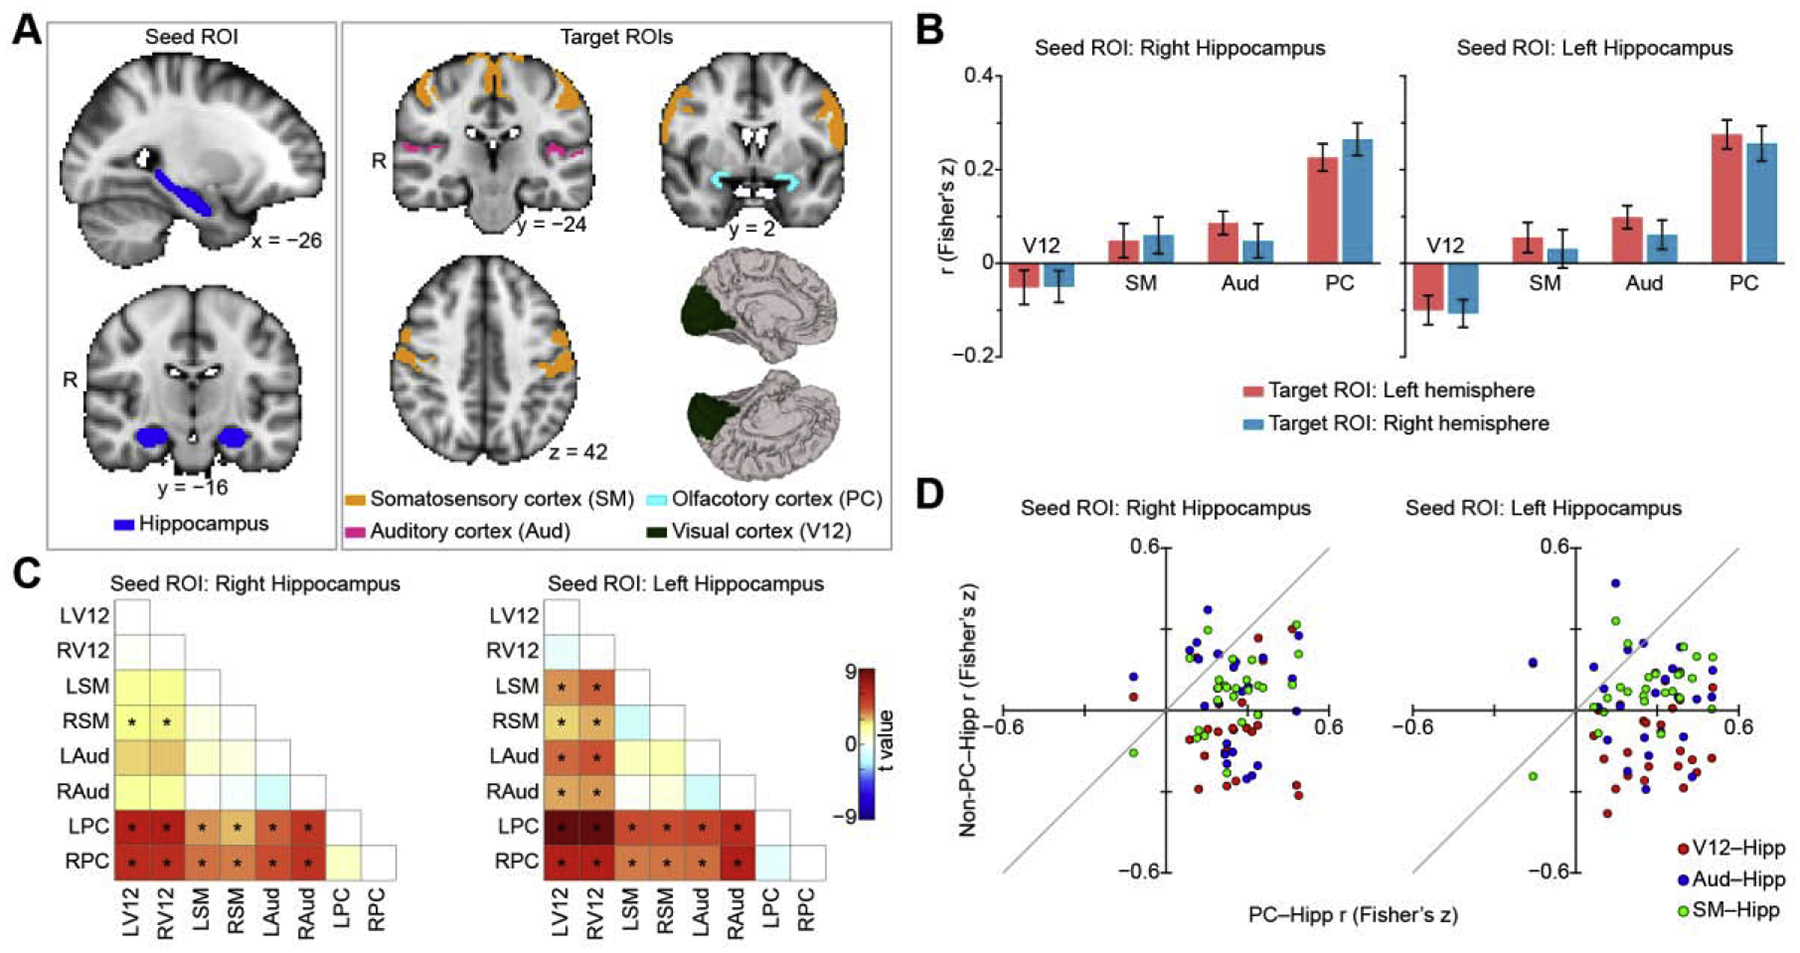
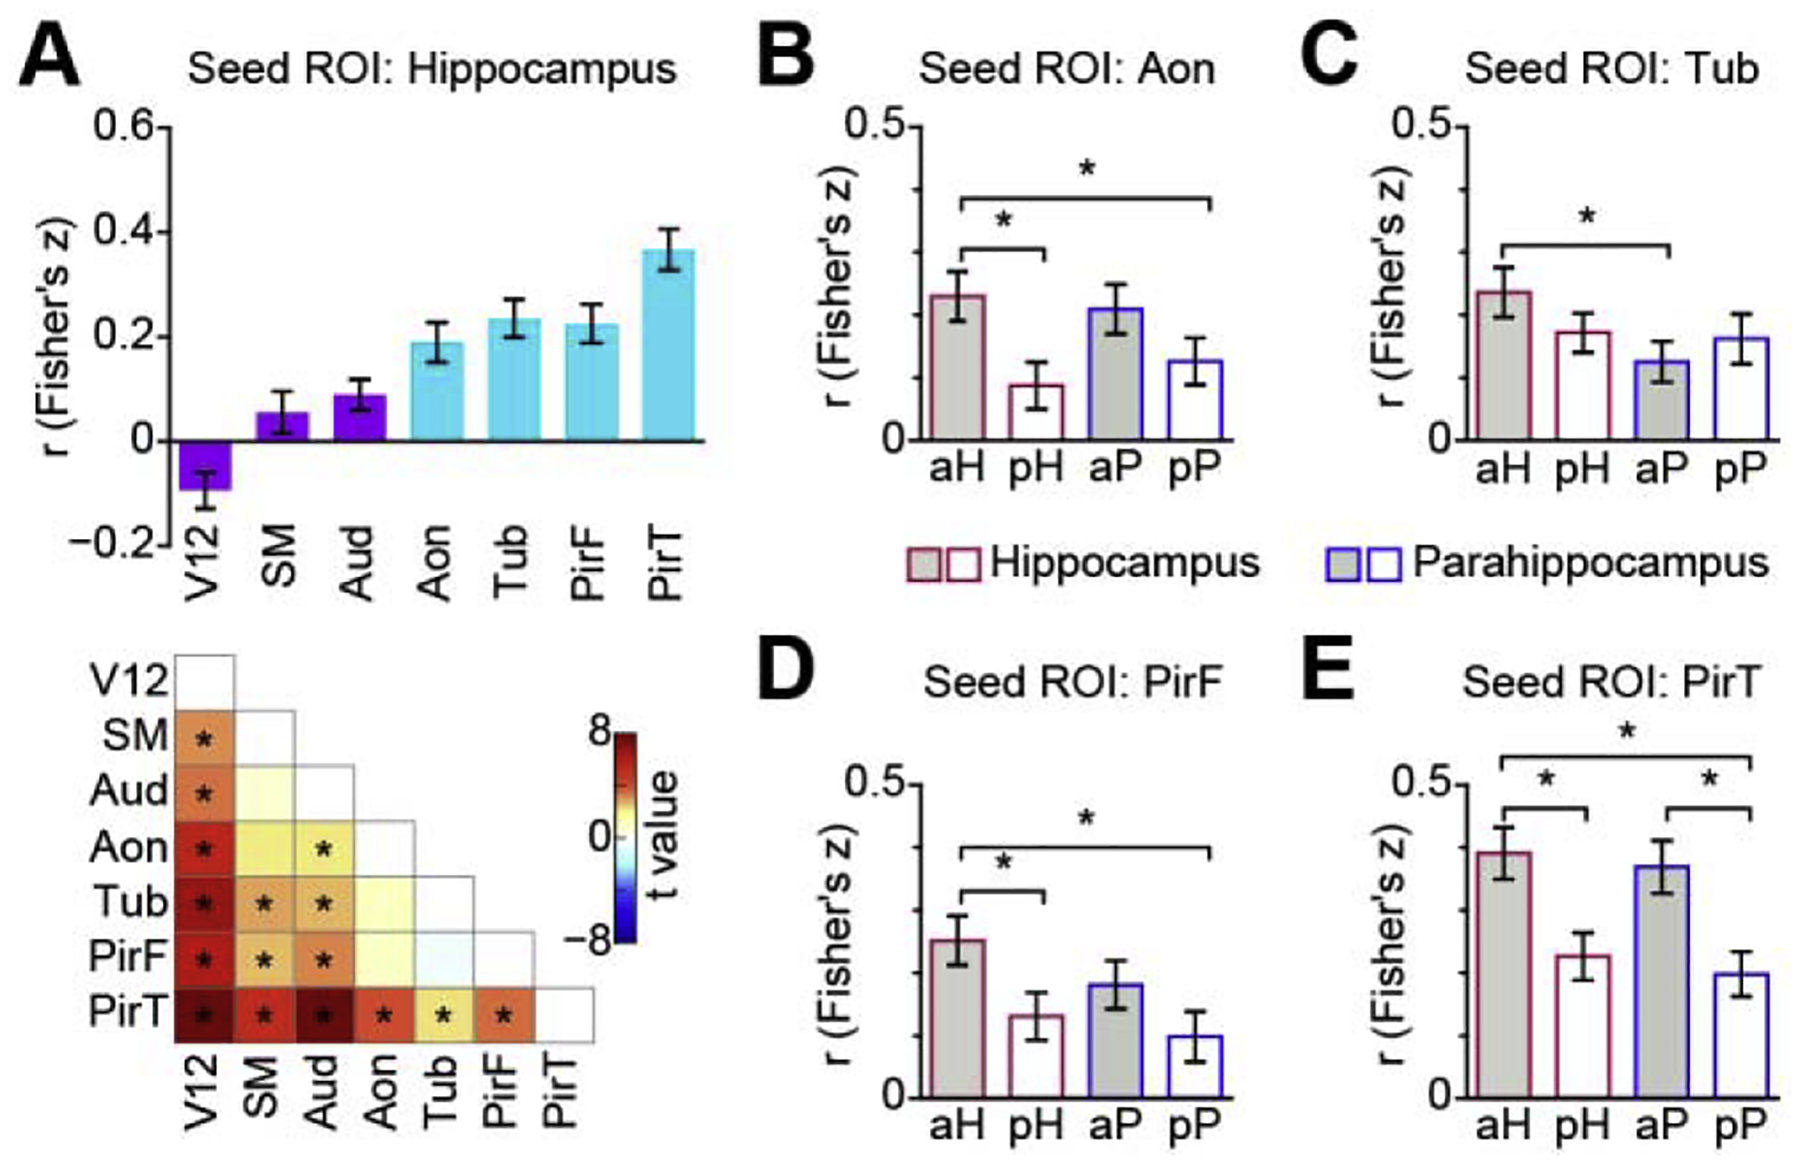
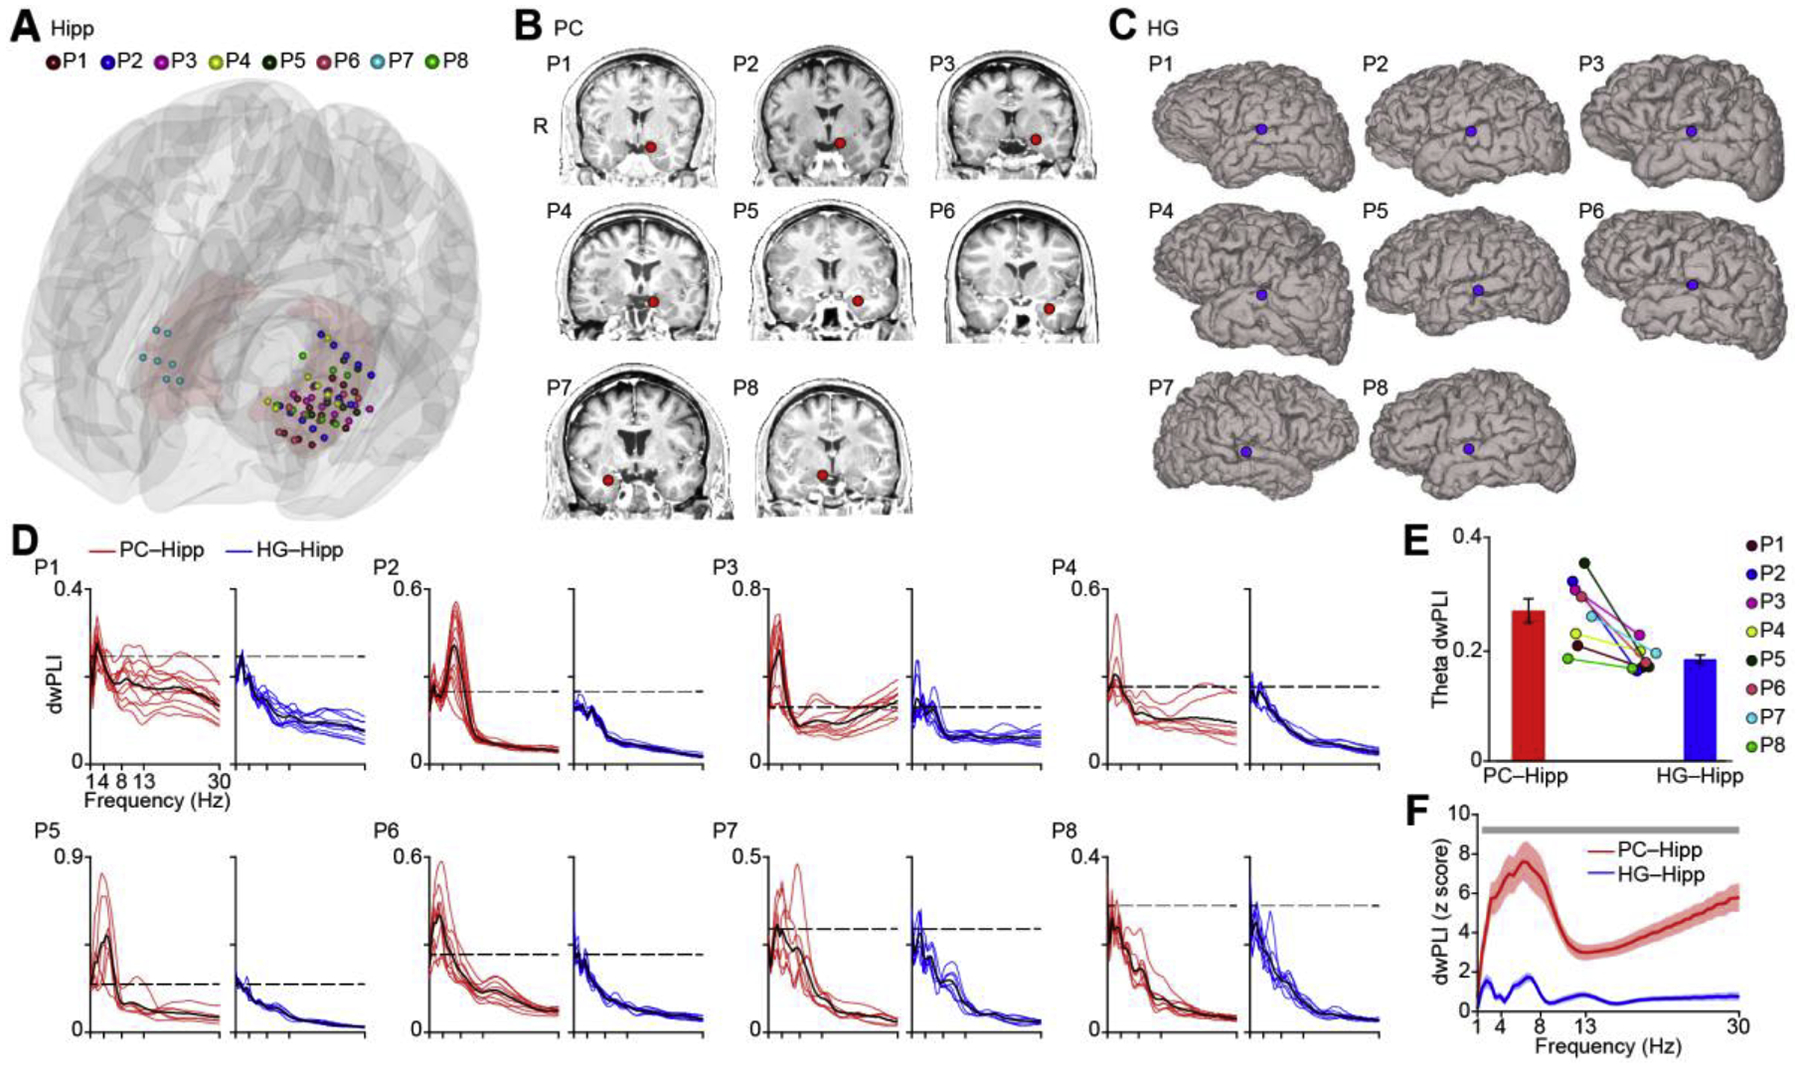
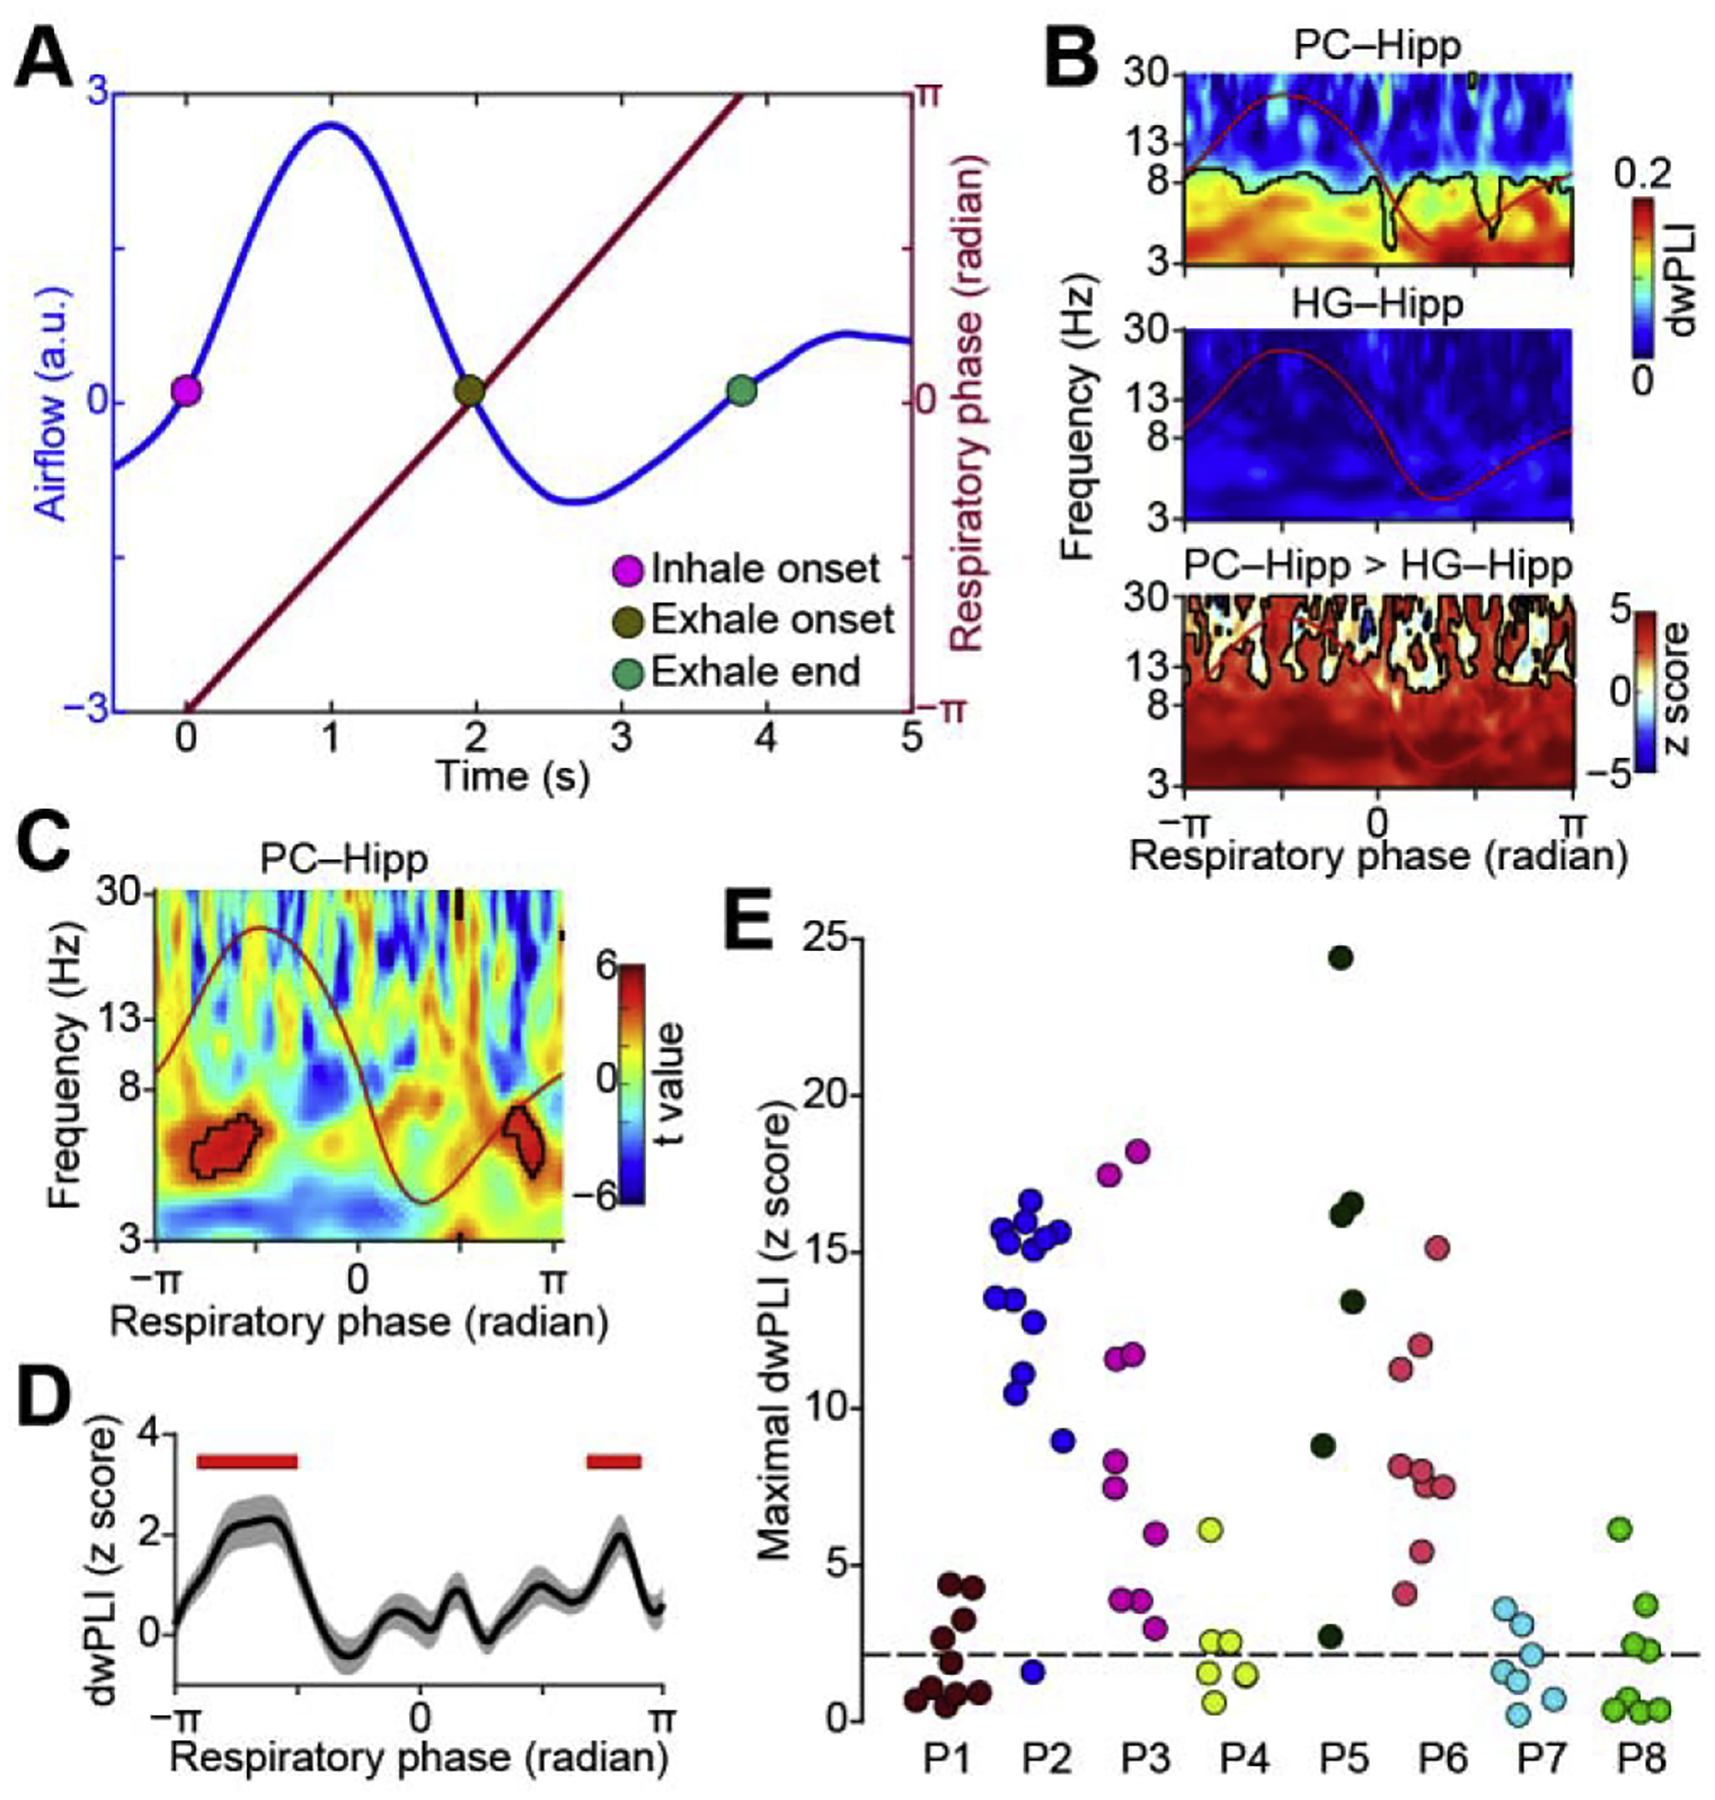
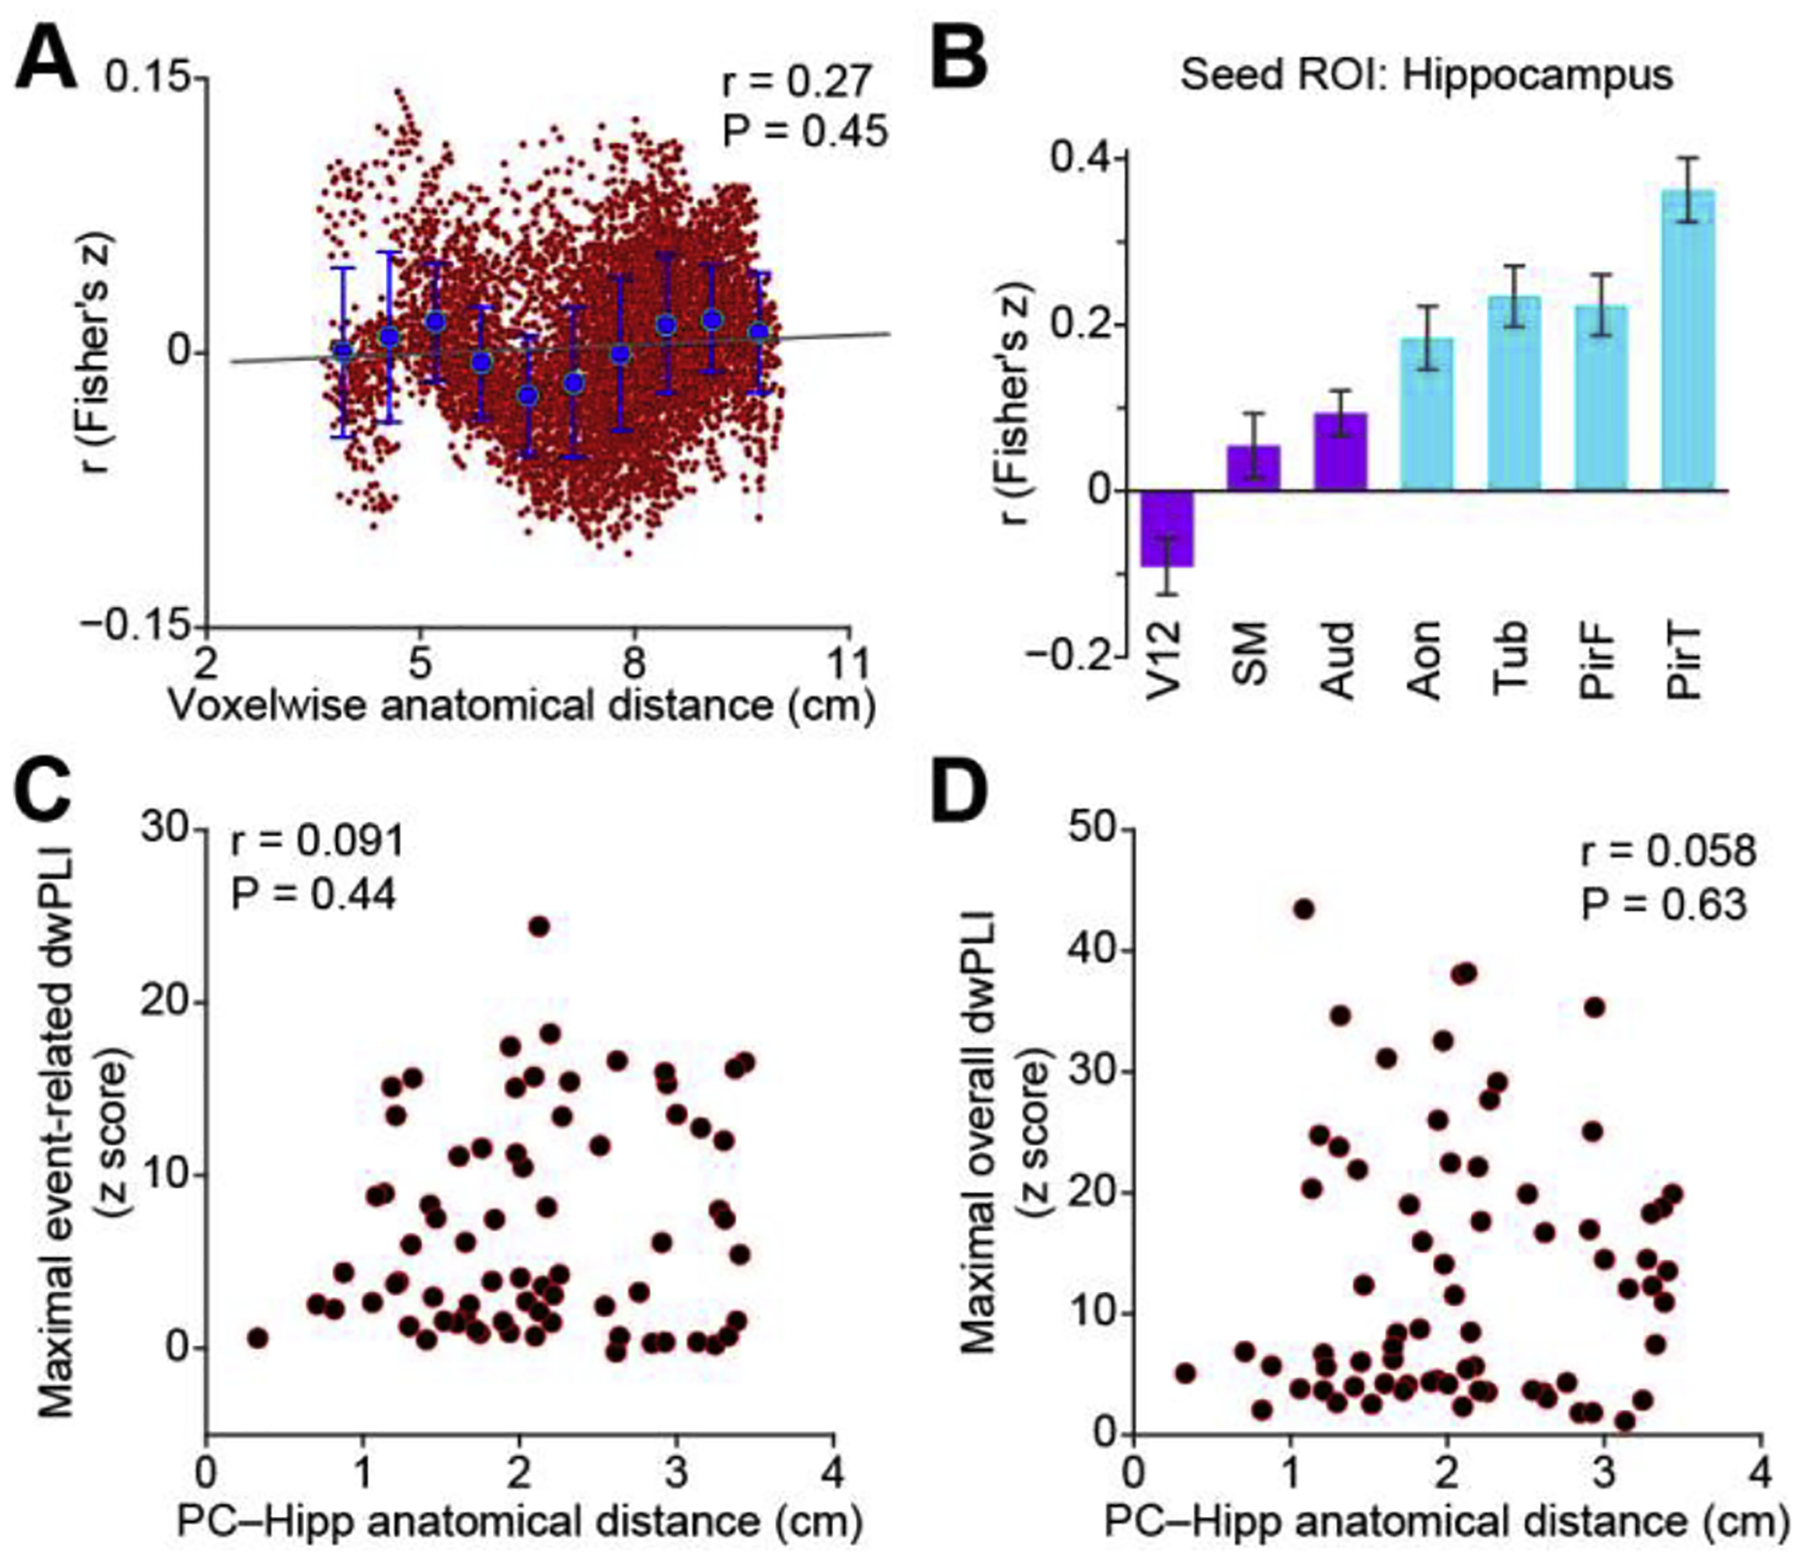
During mammalian evolution, primate neocortex expanded, shifting hippocampal functional networks away from primary sensory cortices, towards association cortices. Reflecting this rerouting, human resting hippocampal functional networks preferentially include higher association cortices, while those in rodents retained primary sensory cortices. Research on human visual, auditory and somatosensory systems shows evidence of this rerouting. Olfaction, however, is unique among sensory systems in its relative structural conservation throughout mammalian evolution, and it is unknown whether human primary olfactory cortex was subject to the same rerouting. We combined functional neuroimaging and intracranial electrophysiology to directly compare hippocampal functional networks across human sensory systems. We show that human primary olfactory cortex-including the anterior olfactory nucleus, olfactory tubercle and piriform cortex-has stronger functional connectivity with hippocampal networks at rest, compared to other sensory systems. This suggests that unlike other sensory systems, olfactory-hippocampal connectivity may have been retained in mammalian evolution. We further show that olfactory-hippocampal connectivity oscillates with nasal breathing. Our findings suggest olfaction might provide insight into how memory and cognition depend on hippocampal interactions.

Keywords: Functional connectivity; Hippocampal network; Olfactory system; fMRI; iEEG.


Conflict of interest statement

Conflict of interests

The authors declare no conflict of interest.

Figures

Figure 1.
Figure 1.
Resting fMRI functional connectivity between hippocampus and sensory cortices. (A). Regions of interest on a Montreal Neurological Institute standard brain. The seed regions include left and right hippocampus, and the target regions include left and right auditory, olfactory, somatosensory and visual cortices. (B). Hippocampal connectivity across sensory systems. Bar plots indicate the average correlation between seed and target region across participants (N = 25), and error bars indicate standard error. (C). T value maps of two-tailed paired t tests (N = 25). Asterisks indicate statistical significance (P < 0.05, FDR corrected). (D). Hippocampal connectivity at the individual level. A scatter plot of the olfactory-hippocampal functional connectivity (PC–Hipp) plotted against the non-olfactory-hippocampal functional connectivity (Non-PC–Hipp). Each dot represents a data point from one participant. The left and right hemispheres of each target region were averaged. Each participant has three data points (red (visual cortex); blue (auditory cortex); and green (somatosensory cortex)). Dots below the light gray diagonal line indicate olfactory-hippocampal connectivity is greater than non-olfactory-hippocampal connectivity. R, right hemisphere; Hipp, hippocampus; V12, V1 and V2; Aud, Heschl’s gyrus and planum temporale; PC, piriform cortex; SM, precentral and postcentral gyrus.
Figure 2.
Figure 2.
Resting fMRI functional connectivity between hippocampus and primary olfactory subregions. (A). Hippocampal connectivity strength across sensory systems and primary olfactory subregions. Bar plot (top) indicates average correlation between seed and target region across participants (N = 25), light blue bars indicate olfactory cortical areas, dark purple bars indicate non-olfactory cortical areas. Error bars indicate standard error. T value map (bottom) was calculated using a two-tailed paired t test. Asterisks indicate statistical significance (P < 0.05, FDR corrected). (B-E). Functional connectivity between olfactory cortical areas and anterior and posterior subregions of the hippocampal formation (hippocampus and parahippocampus); B: Anterior olfactory nucleus, C: Olfactory tubercle, D: Frontal piriform cortex, E: Temporal piriform cortex. Bar plots indicate the average correlation across participants (N = 25), and error bars indicate standard error. Asterisks indicate FDR corrected P < 0.05. Aon, anterior olfactory nucleus; Aud, Heschl’s gyrus and planum temporale; PirF, frontal piriform cortex; PirT, temporal piriform cortex; SM, precentral and postcentral gyrus; Tub, olfactory tubercle; V12, V1 and V2; aH, anterior hippocampus; pH, posterior hippocampus; aP, anterior parahippocampus; pP, posterior parahippocampus.
Figure 3.
Figure 3.
Local field potential phase synchrony between piriform and hippocampus and between Heschl’s gyrus and hippocampus. (A). Location of iEEG electrode contacts in hippocampus. Each color represents one participant, and each dot resents one electrode contact. The 3D model of the hippocampus (light red) is shown on a Montreal Neurological Institute standard brain. Dots represent electrode contact locations. Colors represent participants (P1–P8). (B). Location of iEEG electrode contacts (red dots) in the piriform cortex shown on each individual brain image for each participant (P1–P8). (C). Location of iEEG electrode contacts (blue dots) in auditory cortex shown on each individual brain surface for each participant (P1–P8). (D). Raw dwPLI for each participant (P1–P8) computed between piriform and hippocampus (red lines) and between auditory cortex and hippocampus (blue lines). The black dashed line indicates the significance threshold (95th percentile of the permuted dwPLIs, Bonferroni corrected) for each participant. (E). For each participant, theta-band phase synchrony between piriform and hippocampus is stronger than phase synchrony between auditory cortex and hippocampus. Each colored dot represents one participant; bar plots represent the average over participants. Differences between olfactory and auditory cortices were statistically significant (two-tailed t test, t7 = 4.00, P = 0.0052). (F). Phase synchrony between piriform and hippocampus (red line) is stronger than phase synchrony between auditory cortex and hippocampus (blue line) at each frequency. The solid line indicates the average over all electrode pairs across all participants (N = 72). The shaded area indicates standard error. Light gray bar indicates a statistically significant difference (P < 0.05, FDR corrected). R, right hemisphere; Hipp, hippocampus; HG, Heschl’s gyrus; PC, piriform cortex.
Figure 4.
Figure 4.
Respiration modulates phase synchrony between piriform cortex and hippocampus. (A). Diagram illustrating linear interpolation of respiratory phase to account for differences in respiratory rate across participants. The blue line indicates respiratory signal and the red line indicates the corresponding respiratory phase. (B). Event-related phase synchrony between piriform cortex and hippocampus (top), between Heschl’s gyrus and hippocampus (middle), and the difference between the two (bottom). Average respiration is overlaid (red line). Phase synchrony is significantly stronger between piriform and hippocampus over the entire respiratory period. Red areas with black outlines (bottom panel) indicate statistical significance (P < 0.05, FDR corrected. Note that black outlines blend with axes lines, as entire bottom area is significant.). (C). Inhale-induced increases in theta-band phase synchrony between the piriform cortex and hippocampus. Statistical comparison of pre- versus post-inhale phase locking across all electrode pairs and all participants (N = 72). Black outlines indicate a statistically significant increase in phase locking induced by inhalation (FDR corrected P < 0.005). Average respiration is overlaid (red line). (D). Theta-band phase synchrony between the piriform cortex and hippocampus across the respiratory cycle. The solid black line indicates the average of normalized dwPLI (z score) over all electrode pairs (N = 72) in the theta frequency range. Shaded area indicates the standard error. Red bars indicate statistical significance (two-tailed one-sample t test, P < 0005, FDR corrected). (E). Maximal phase synchrony in each participant’s piriform-hippocampus electrode pairs, in the significant cluster during inhale shown in panel C. The short-dashed line indicates the threshold of statistical significance (P < 0.05, FDR corrected). Each color represents one participant (P1–P8) and each dot represents one electrode pair. Hipp, hippocampus; HG, Heschl’s gyrus; PC, piriform cortex; dwPLI, debiased weighted phase lag index.
Figure 5.
Figure 5.
Correlation between anatomical distance and functional connectivity. (A). Voxel-wise correlation between anatomical distance to the hippocampus and fMRI-based functional connectivity, across all voxels included in the analysis. Red dots indicate correlation values between distance and functional connectivity for all voxels. Blue dots indicate the average correlation values within each of ten equally distanced bins. Black line is the linear trend line. (B). Bootstrapped resting hippocampal fMRI connectivity strength across sensory systems. Bar plots are the average correlation across participants (N = 25). Light blue bars indicate olfactory cortical areas, dark purple bars indicate non-olfactory cortical areas. Error bars indicate standard error. (C). Correlation between maximal event-related theta-band phase synchrony and anatomical distance between the piriform cortex and hippocampus. All piriform-hippocampus electrode pairs in all participants are shown (red dots). (D). Correlation between maximal raw phase synchrony and anatomical distance between the piriform cortex and hippocampus. All piriform-hippocampus electrode pairs in all participants are shown (red dots). Aon, anterior olfactory nucleus; Aud, Heschl’s gyrus and planum temporale; Hipp, hippocampus; PC, piriform cortex; V12, V1 and V2; SM, precentral gyrus and postcentral gyrus; PirF, frontal piriform cortex; PirT, temporal piriform cortex; Tub, olfactory tubercle, dwPLI, debiased weighted phase lag index.

Similar articles

Cited by

References

    1. Allen TA, Fortin NJ, 2013. The evolution of episodic memory. Proc. Natl. Acad. Sci. U. S. A 110, 10379–10386. 10.1073/pnas.1301199110 - DOI - PMC - PubMed
    1. Allison AC, 1954. The secondary olfactory areas in the human brain. J. Anat 88, 481–488. - PMC - PubMed
    1. Alvarez P, 2002. Hippocampal formation lesions impair performance in an odor-odor association task independently of spatial context. Neurobiol. Learn. Mem 78, 470–476. 10.1006/nlme.2002.4068 - DOI - PubMed
    1. Aqrabawi AJ, Kim JC, 2020. Olfactory memory representations are stored in the anterior olfactory nucleus. Nat. Commun 11, 1246. 10.1038/s41467-020-15032-2 - DOI - PMC - PubMed
    1. Arnold TC, You Y, Ding M, Zuo X-N, de Araujo I, Li W, 2020. Functional connectome analyses reveal the human olfactory network organization. eneuro 7, ENEURO.0551–19.2020. 10.1523/ENEURO.0551-19.2020 - DOI - PMC - PubMed

Publication types