Review
. 2021 Sep:84:100953.
doi: 10.1016/j.preteyeres.2021.100953. Epub 2021 Feb 25.

Adaptive responses to neurodegenerative stress in glaucoma

Affiliations
Review

Adaptive responses to neurodegenerative stress in glaucoma

David J Calkins. Prog Retin Eye Res. 2021 Sep.

Abstract

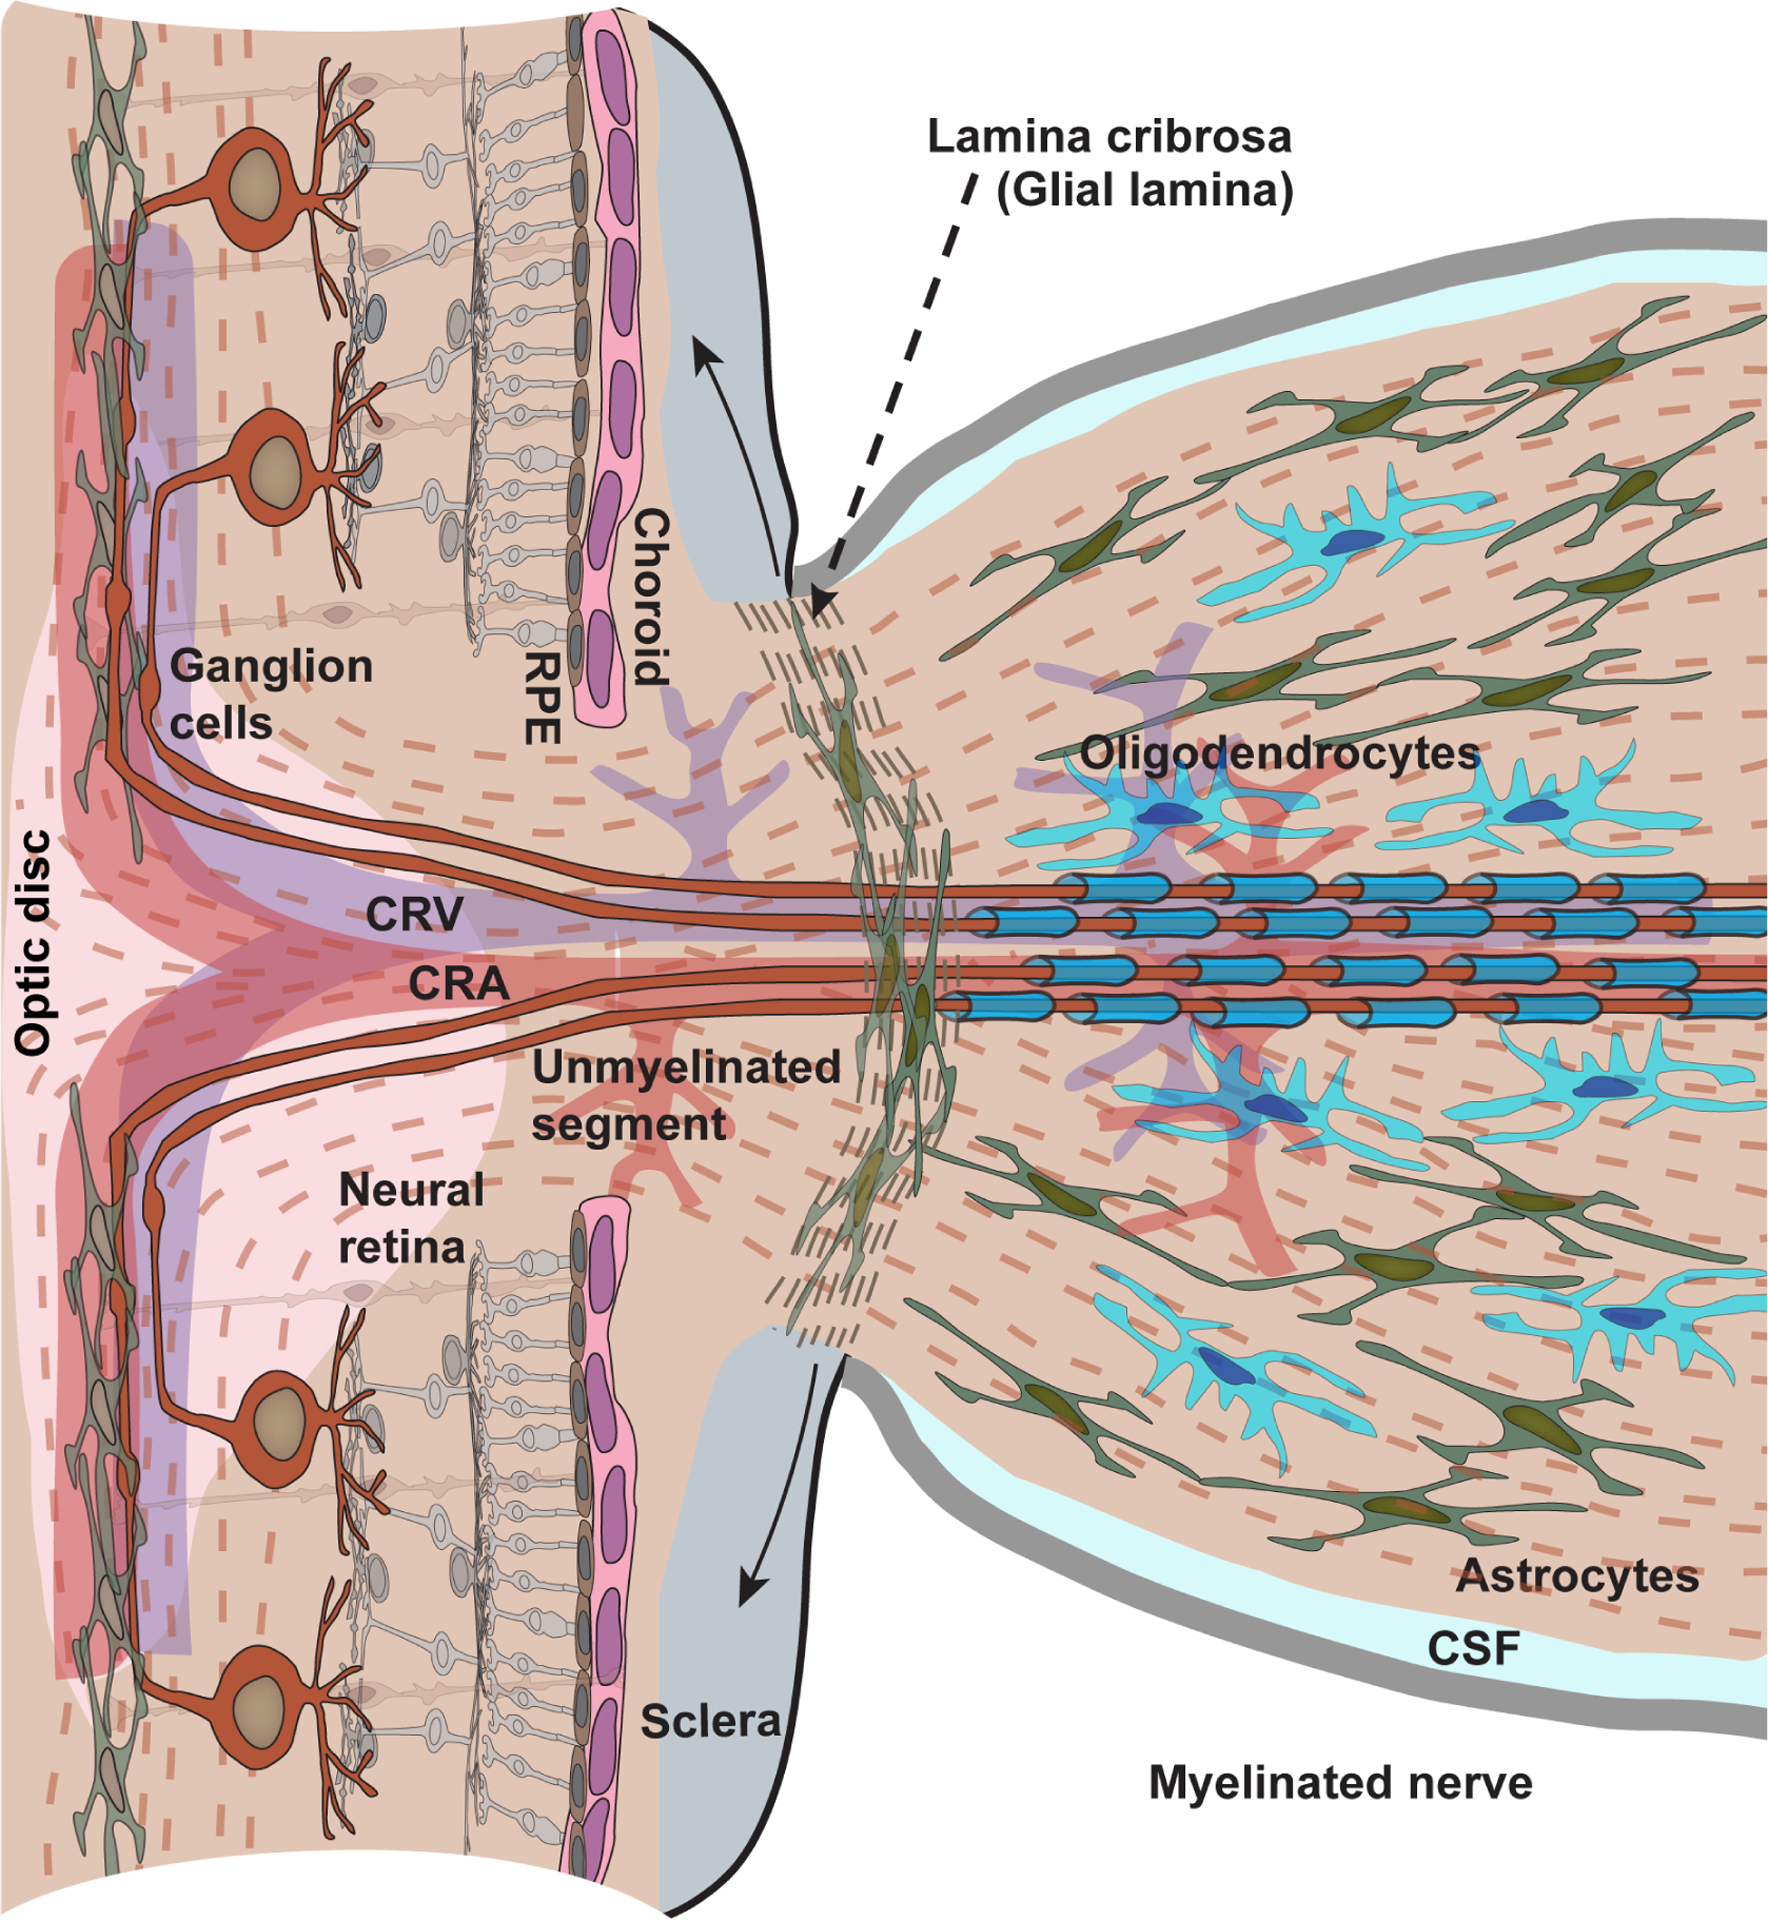
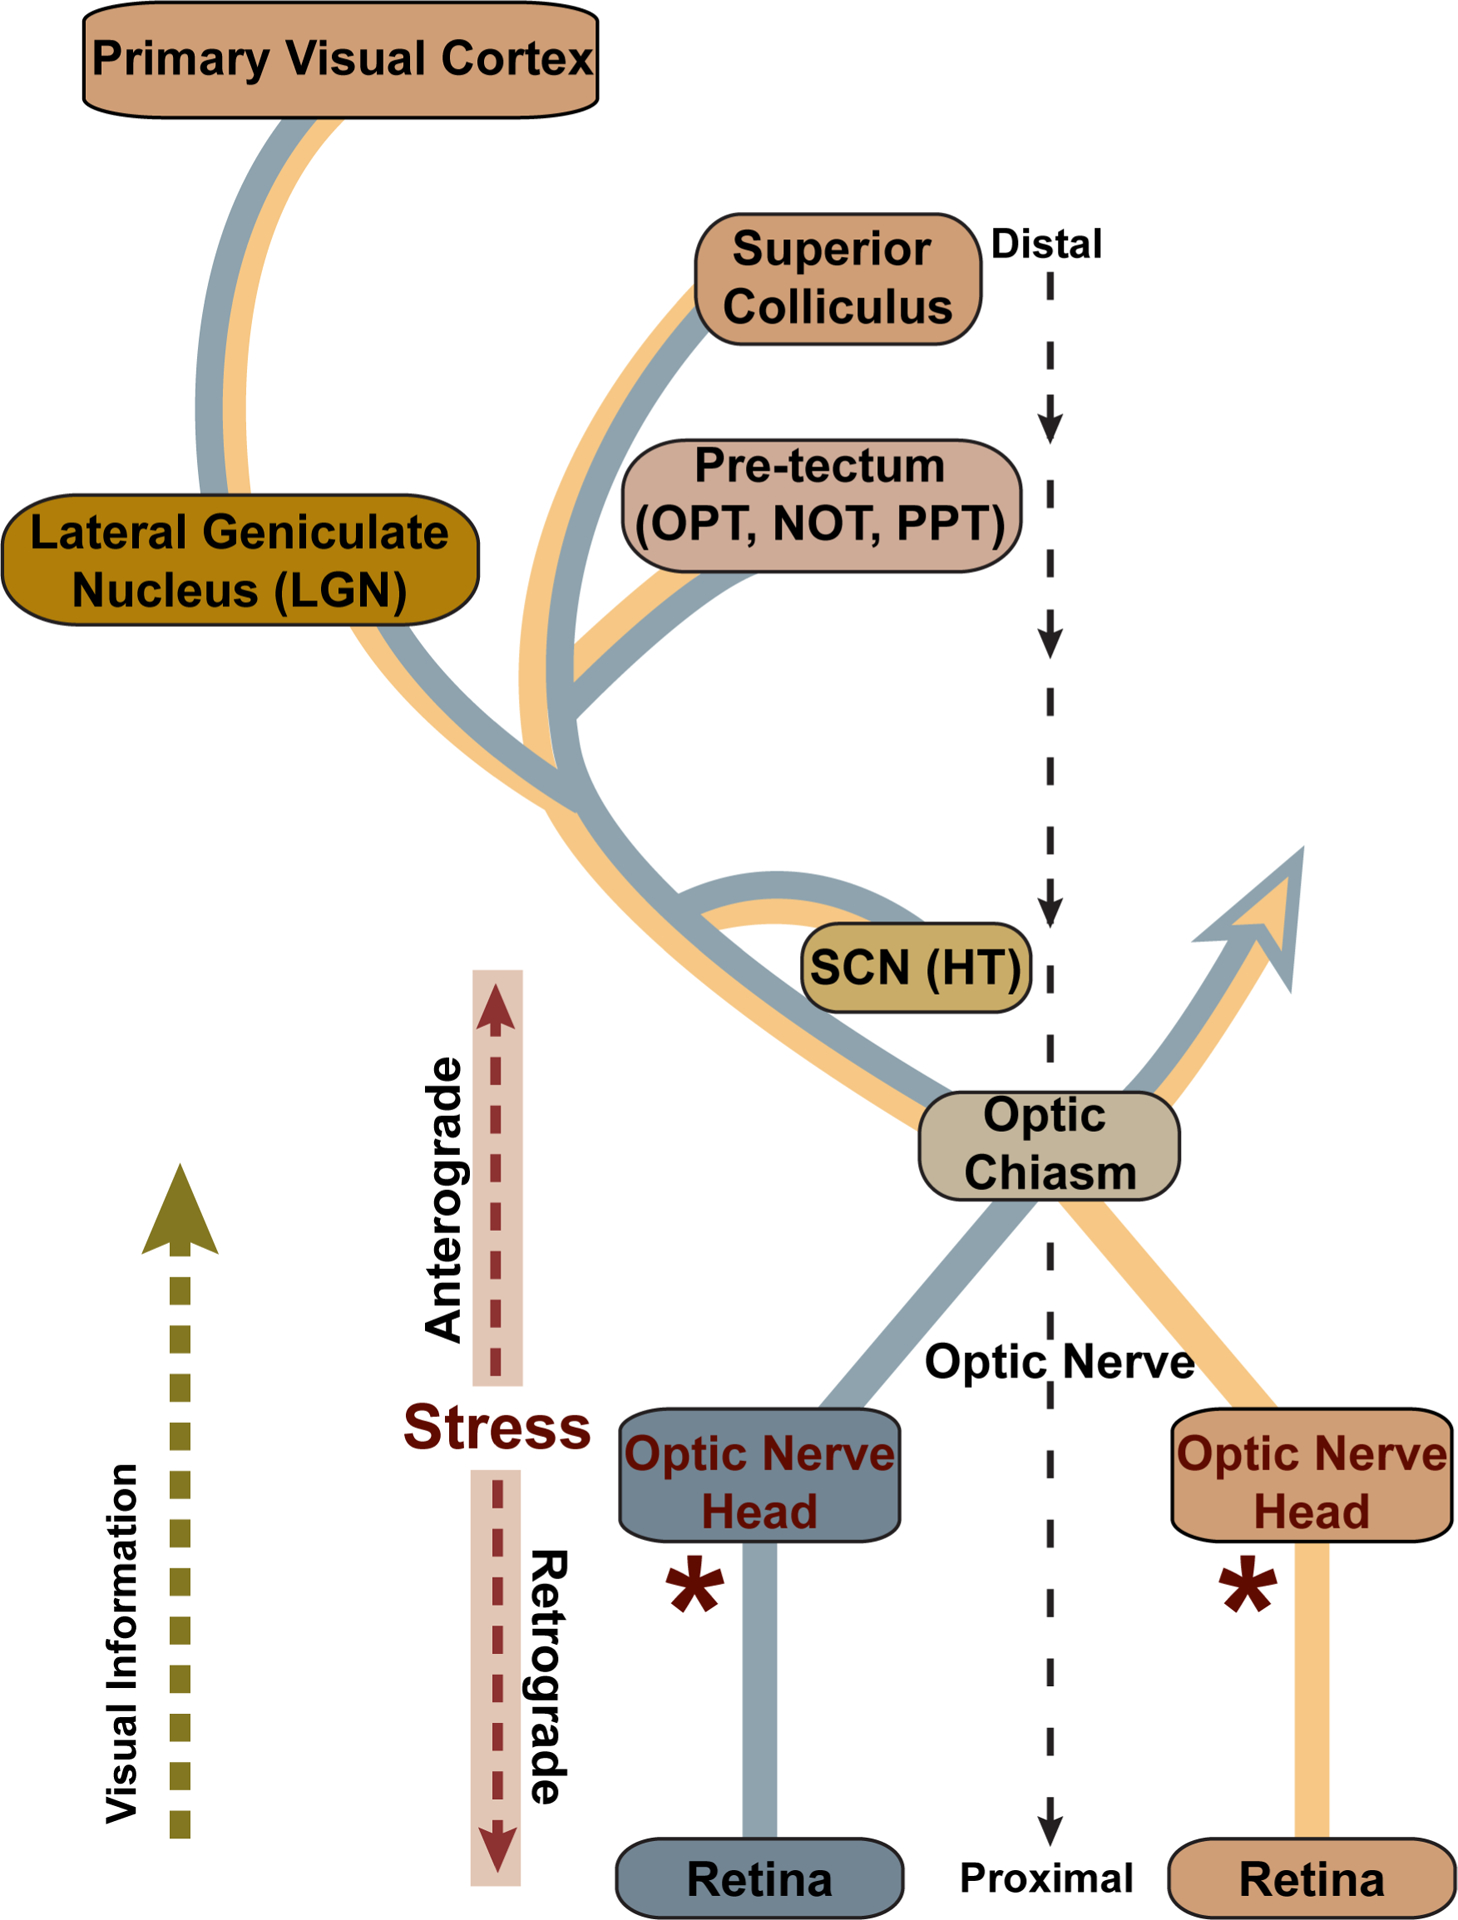
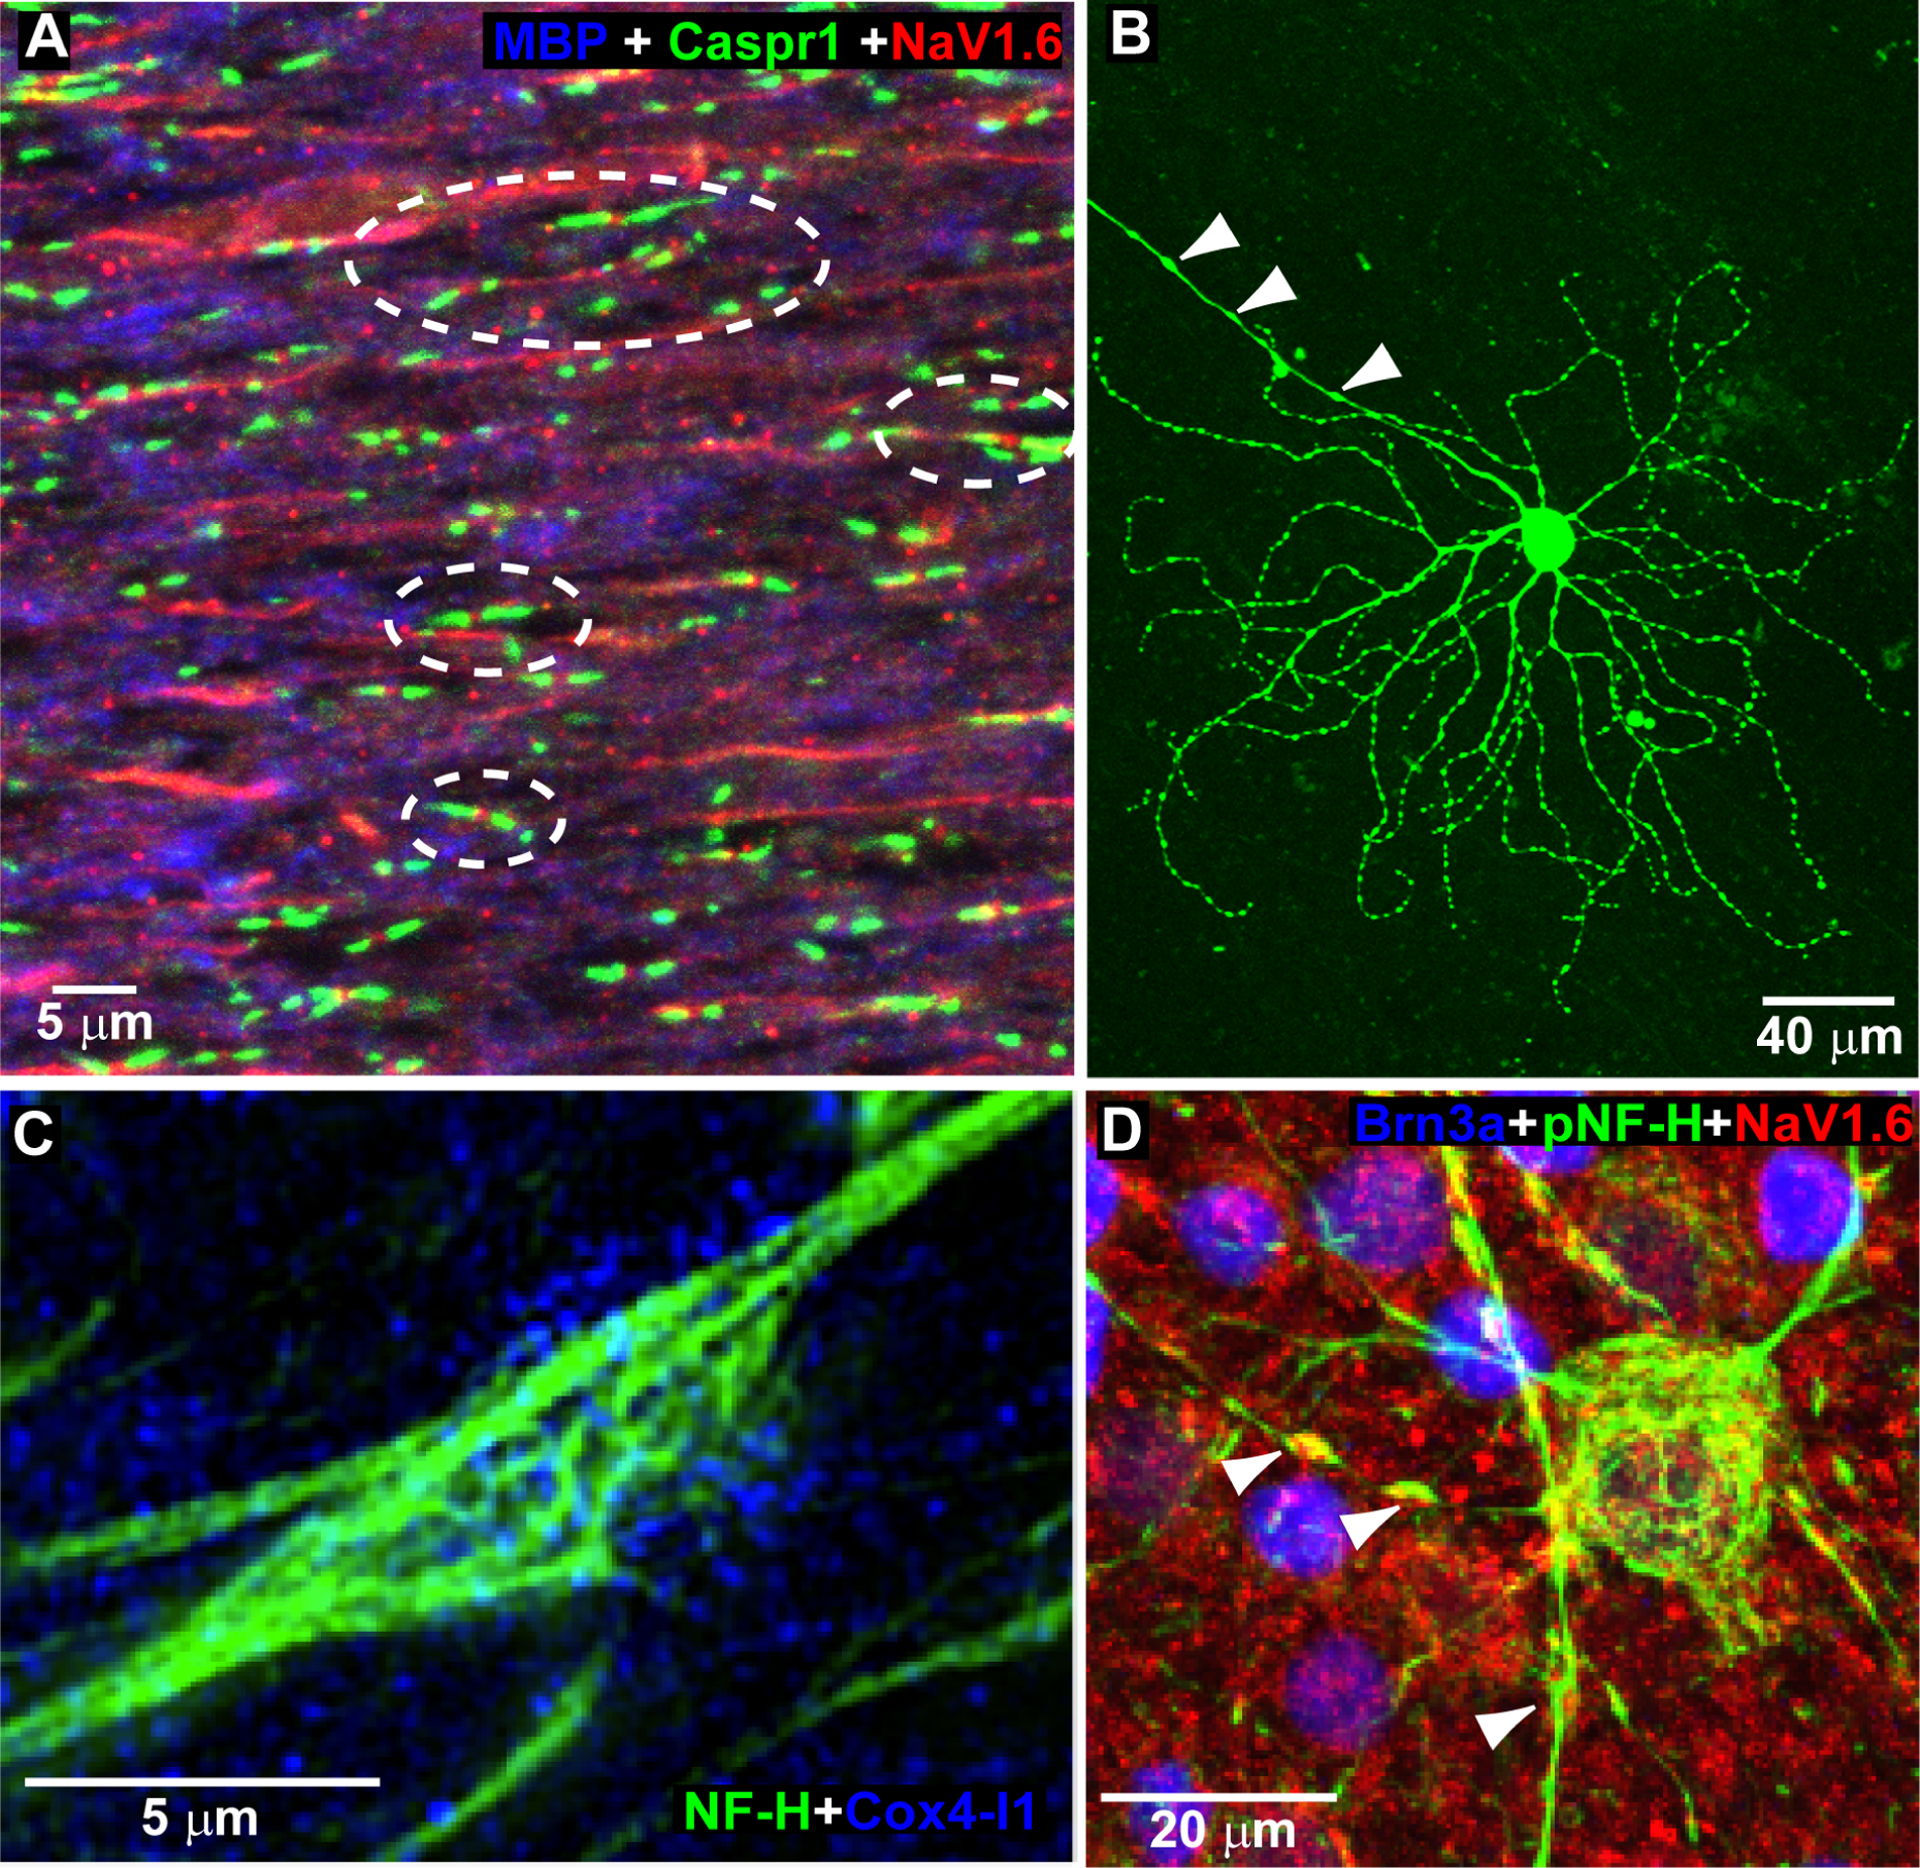
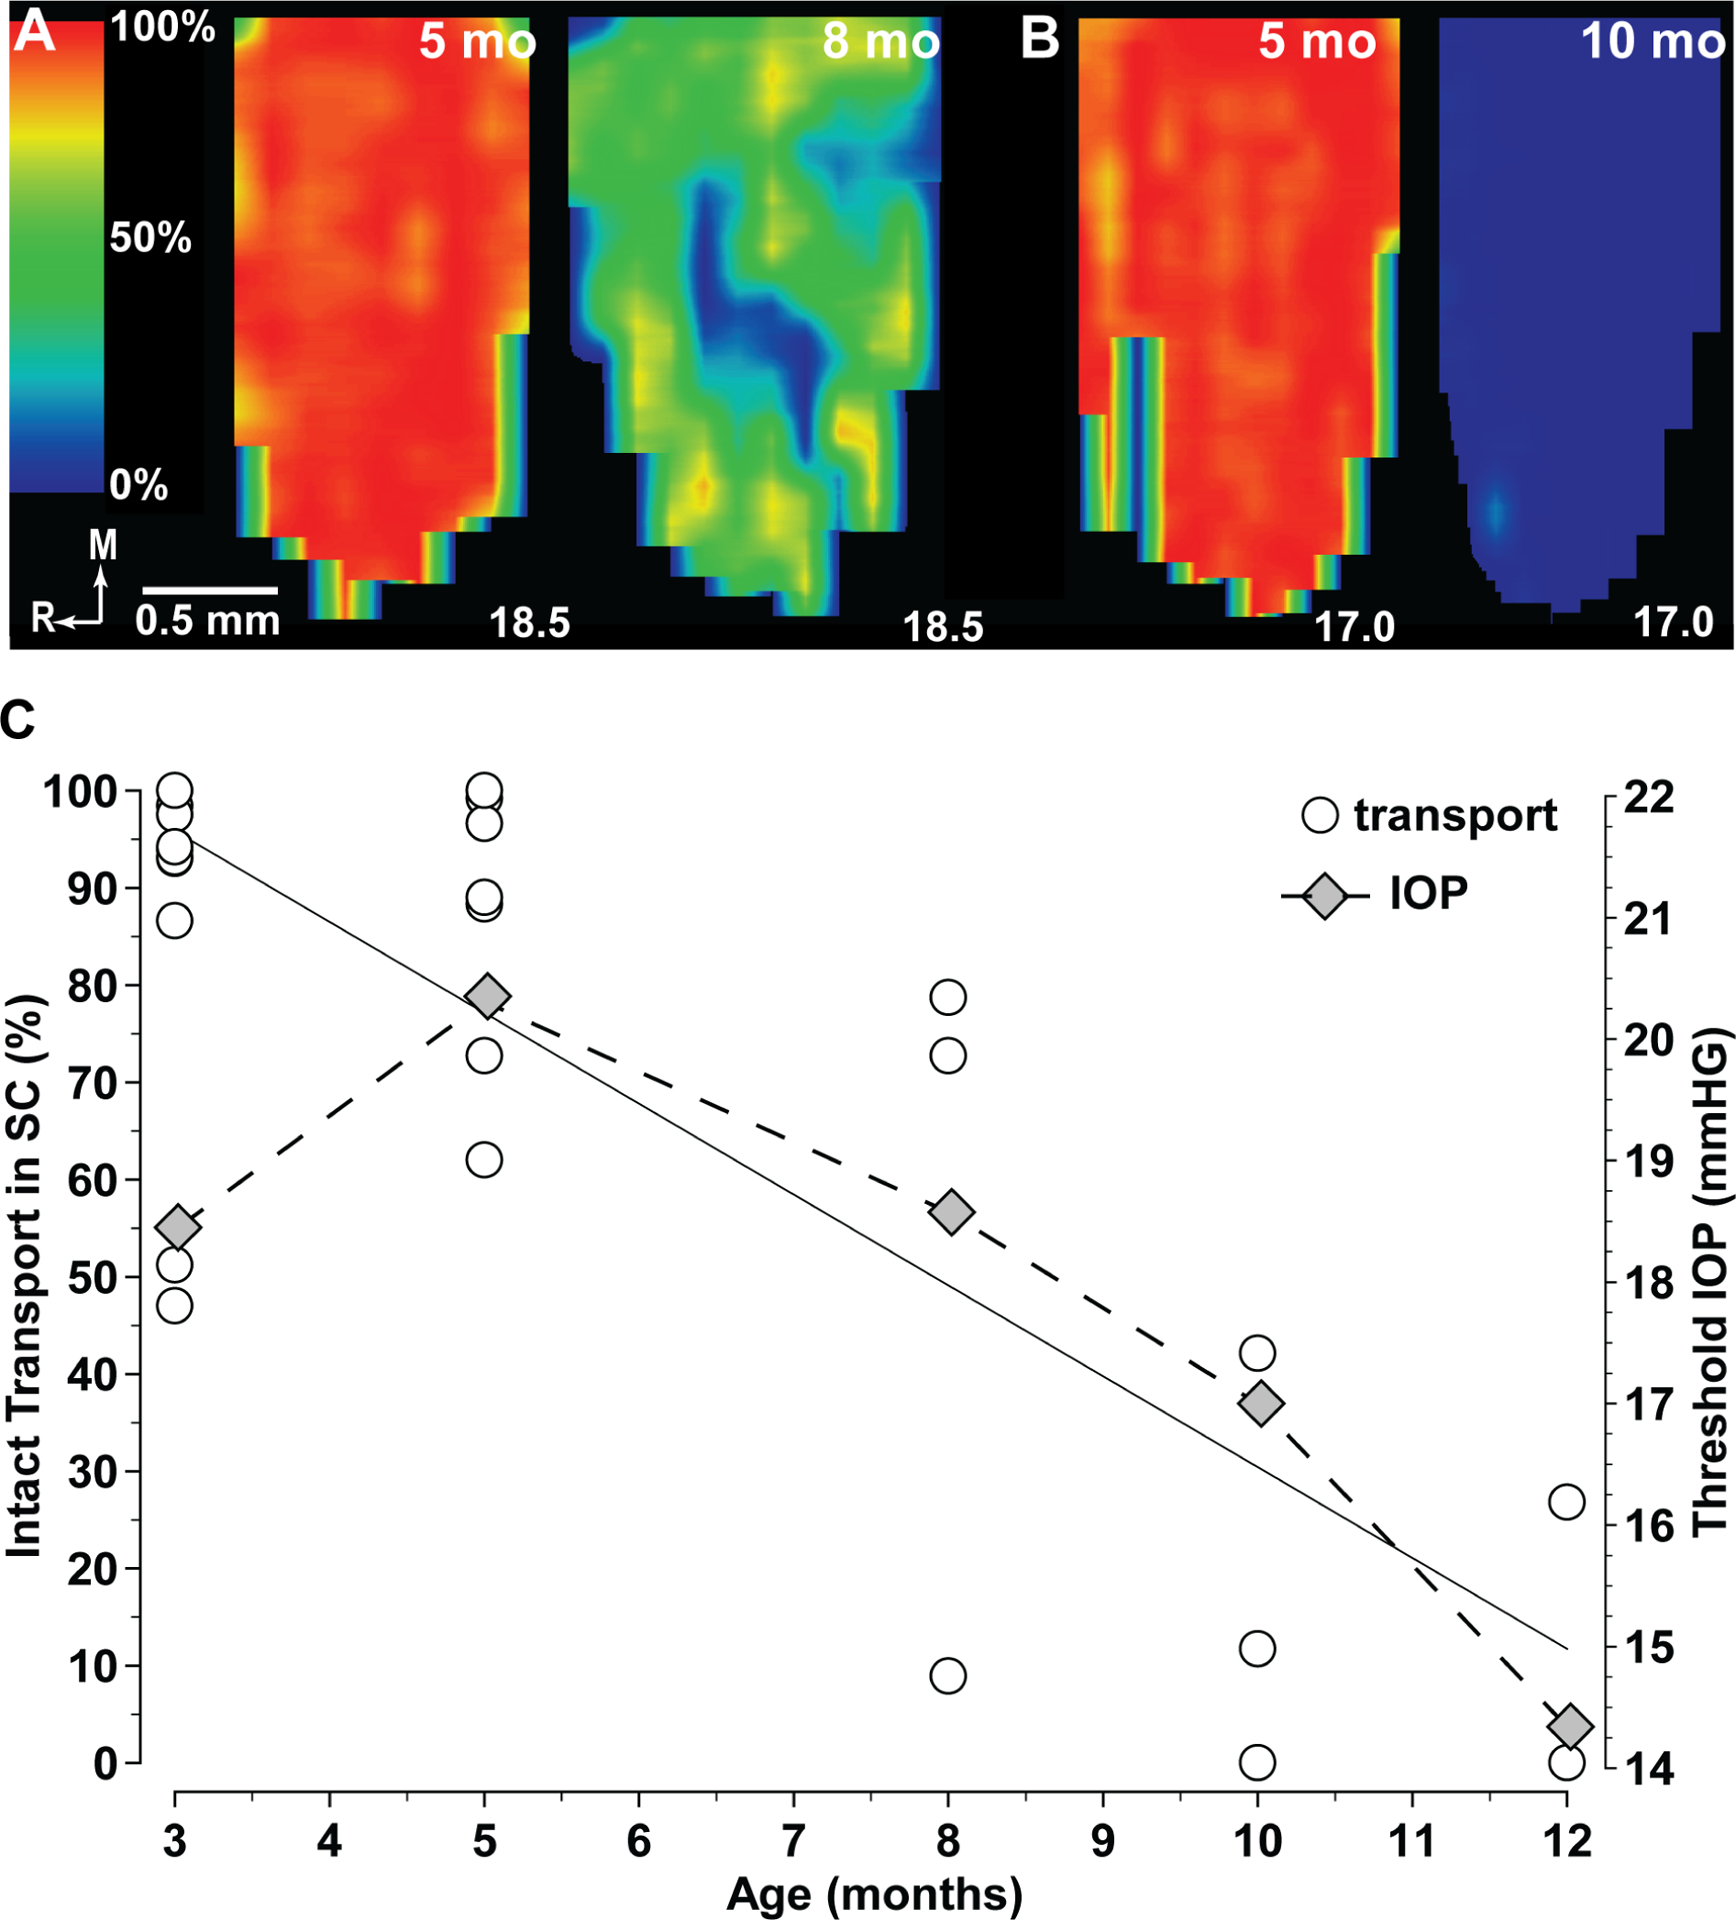
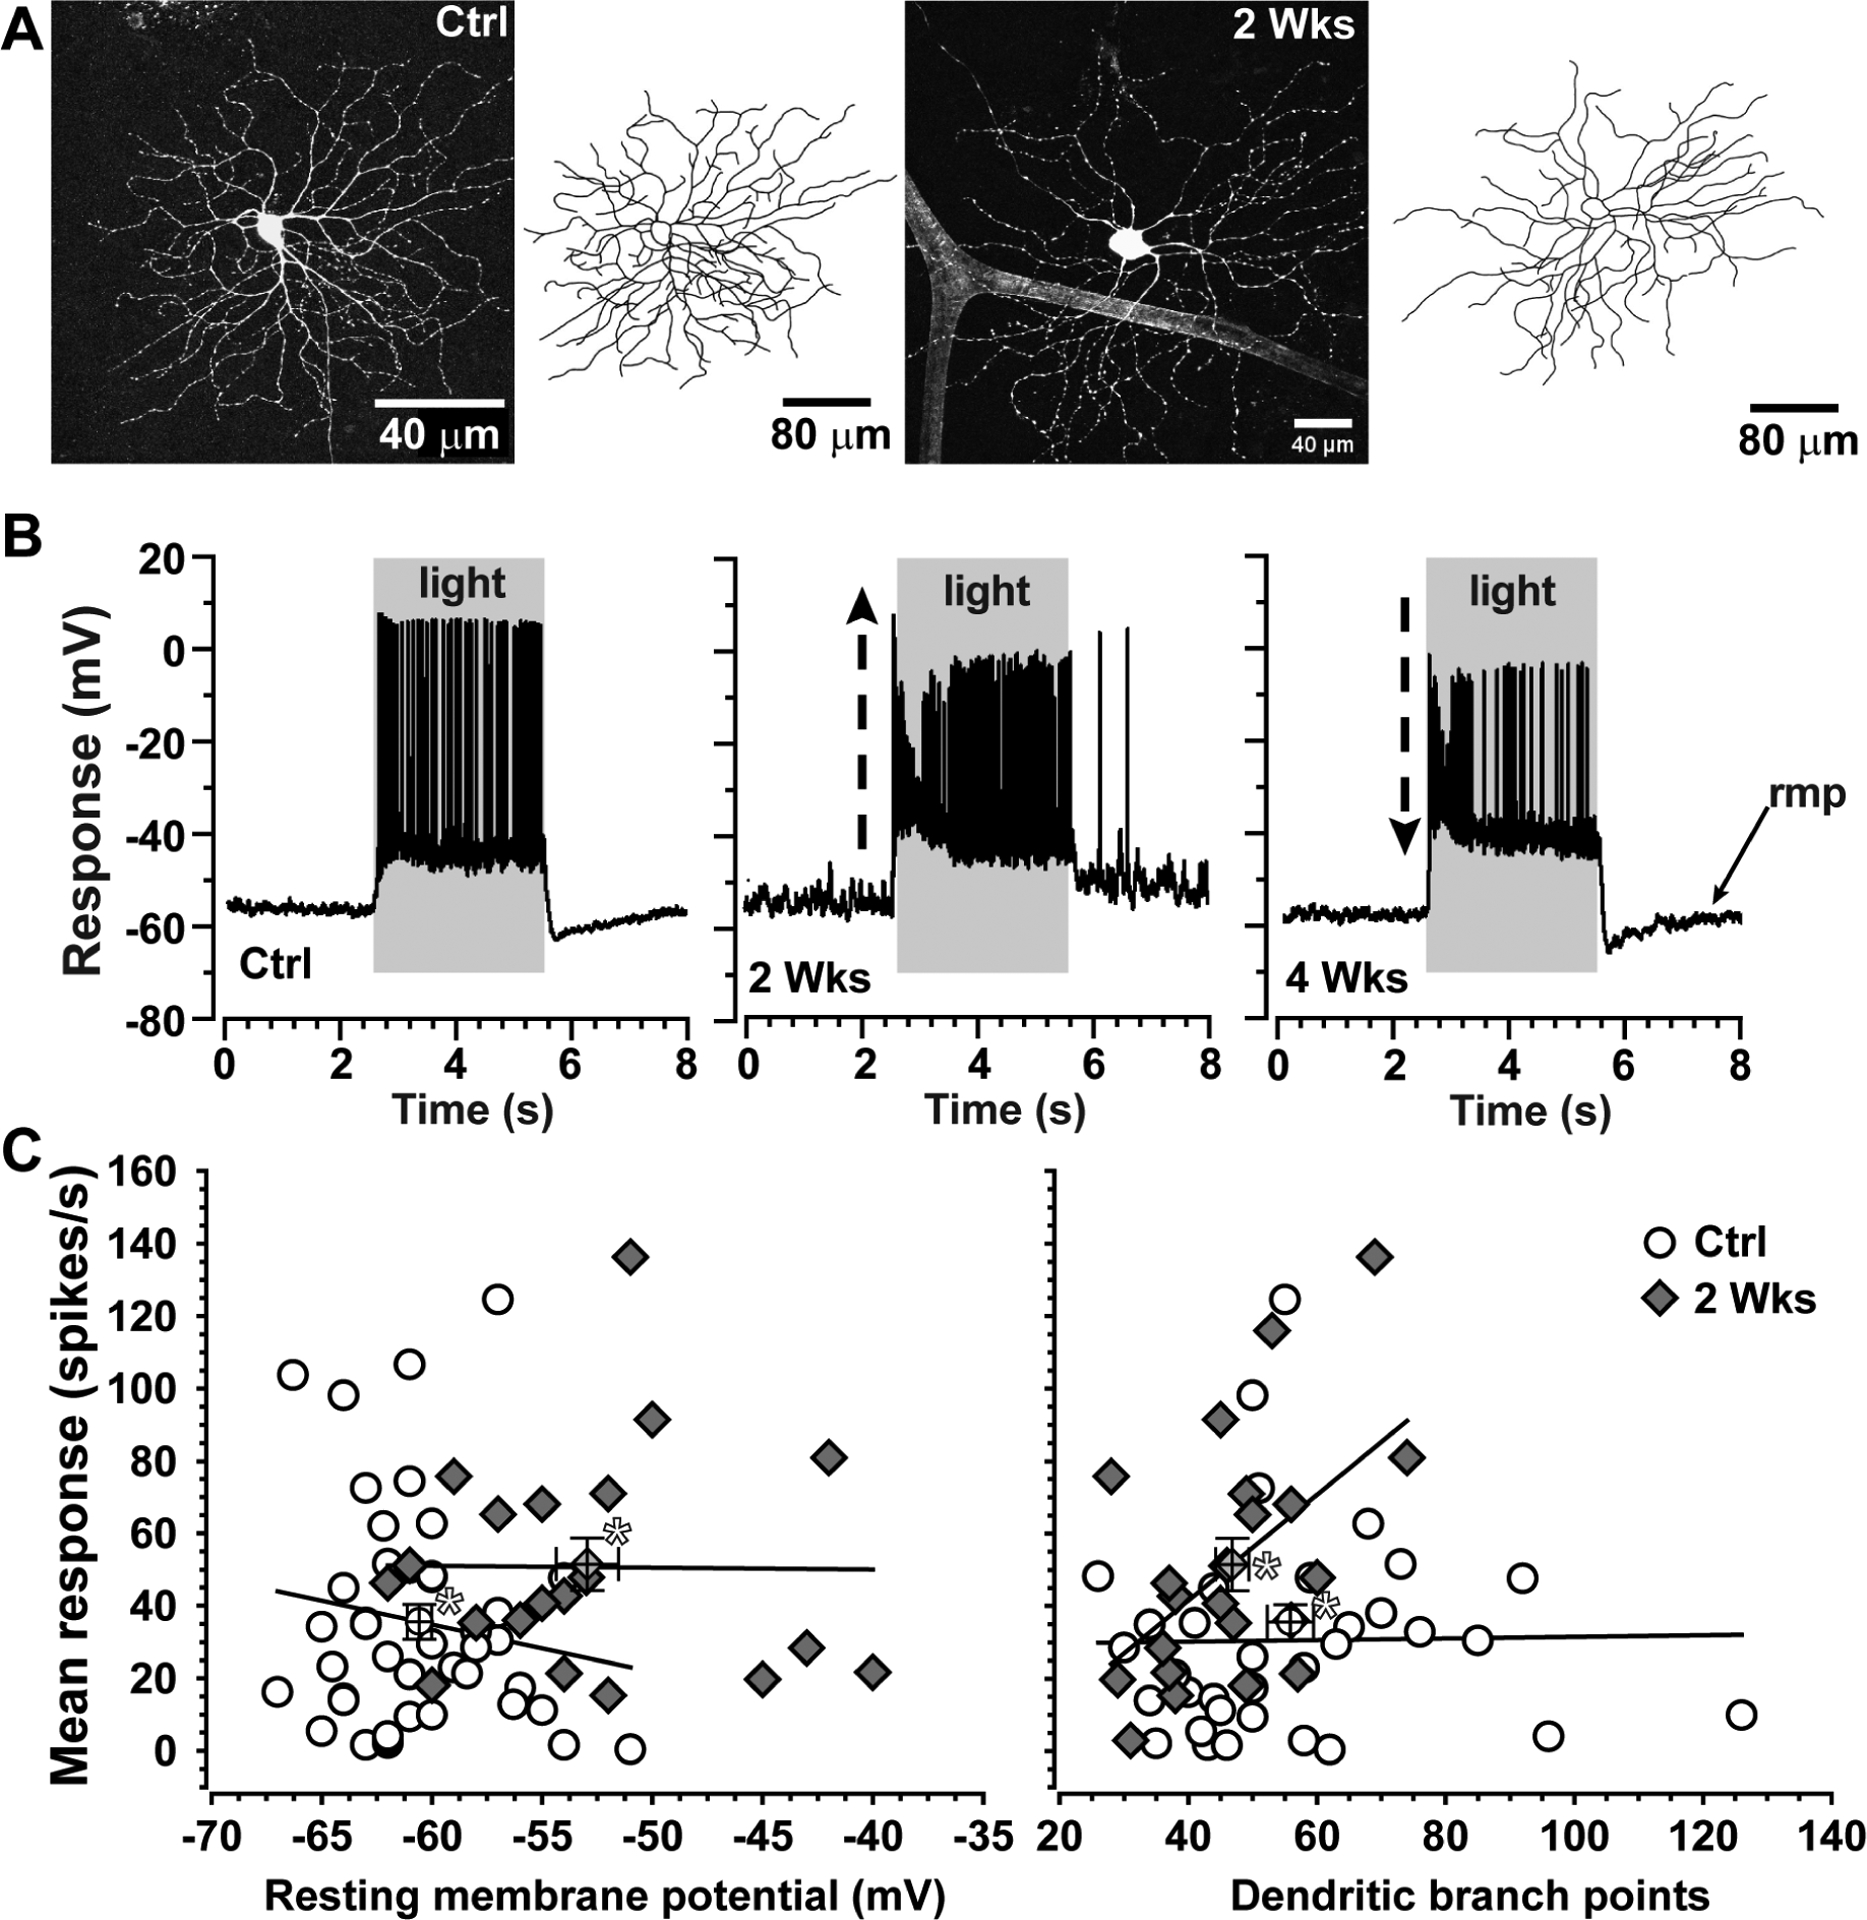
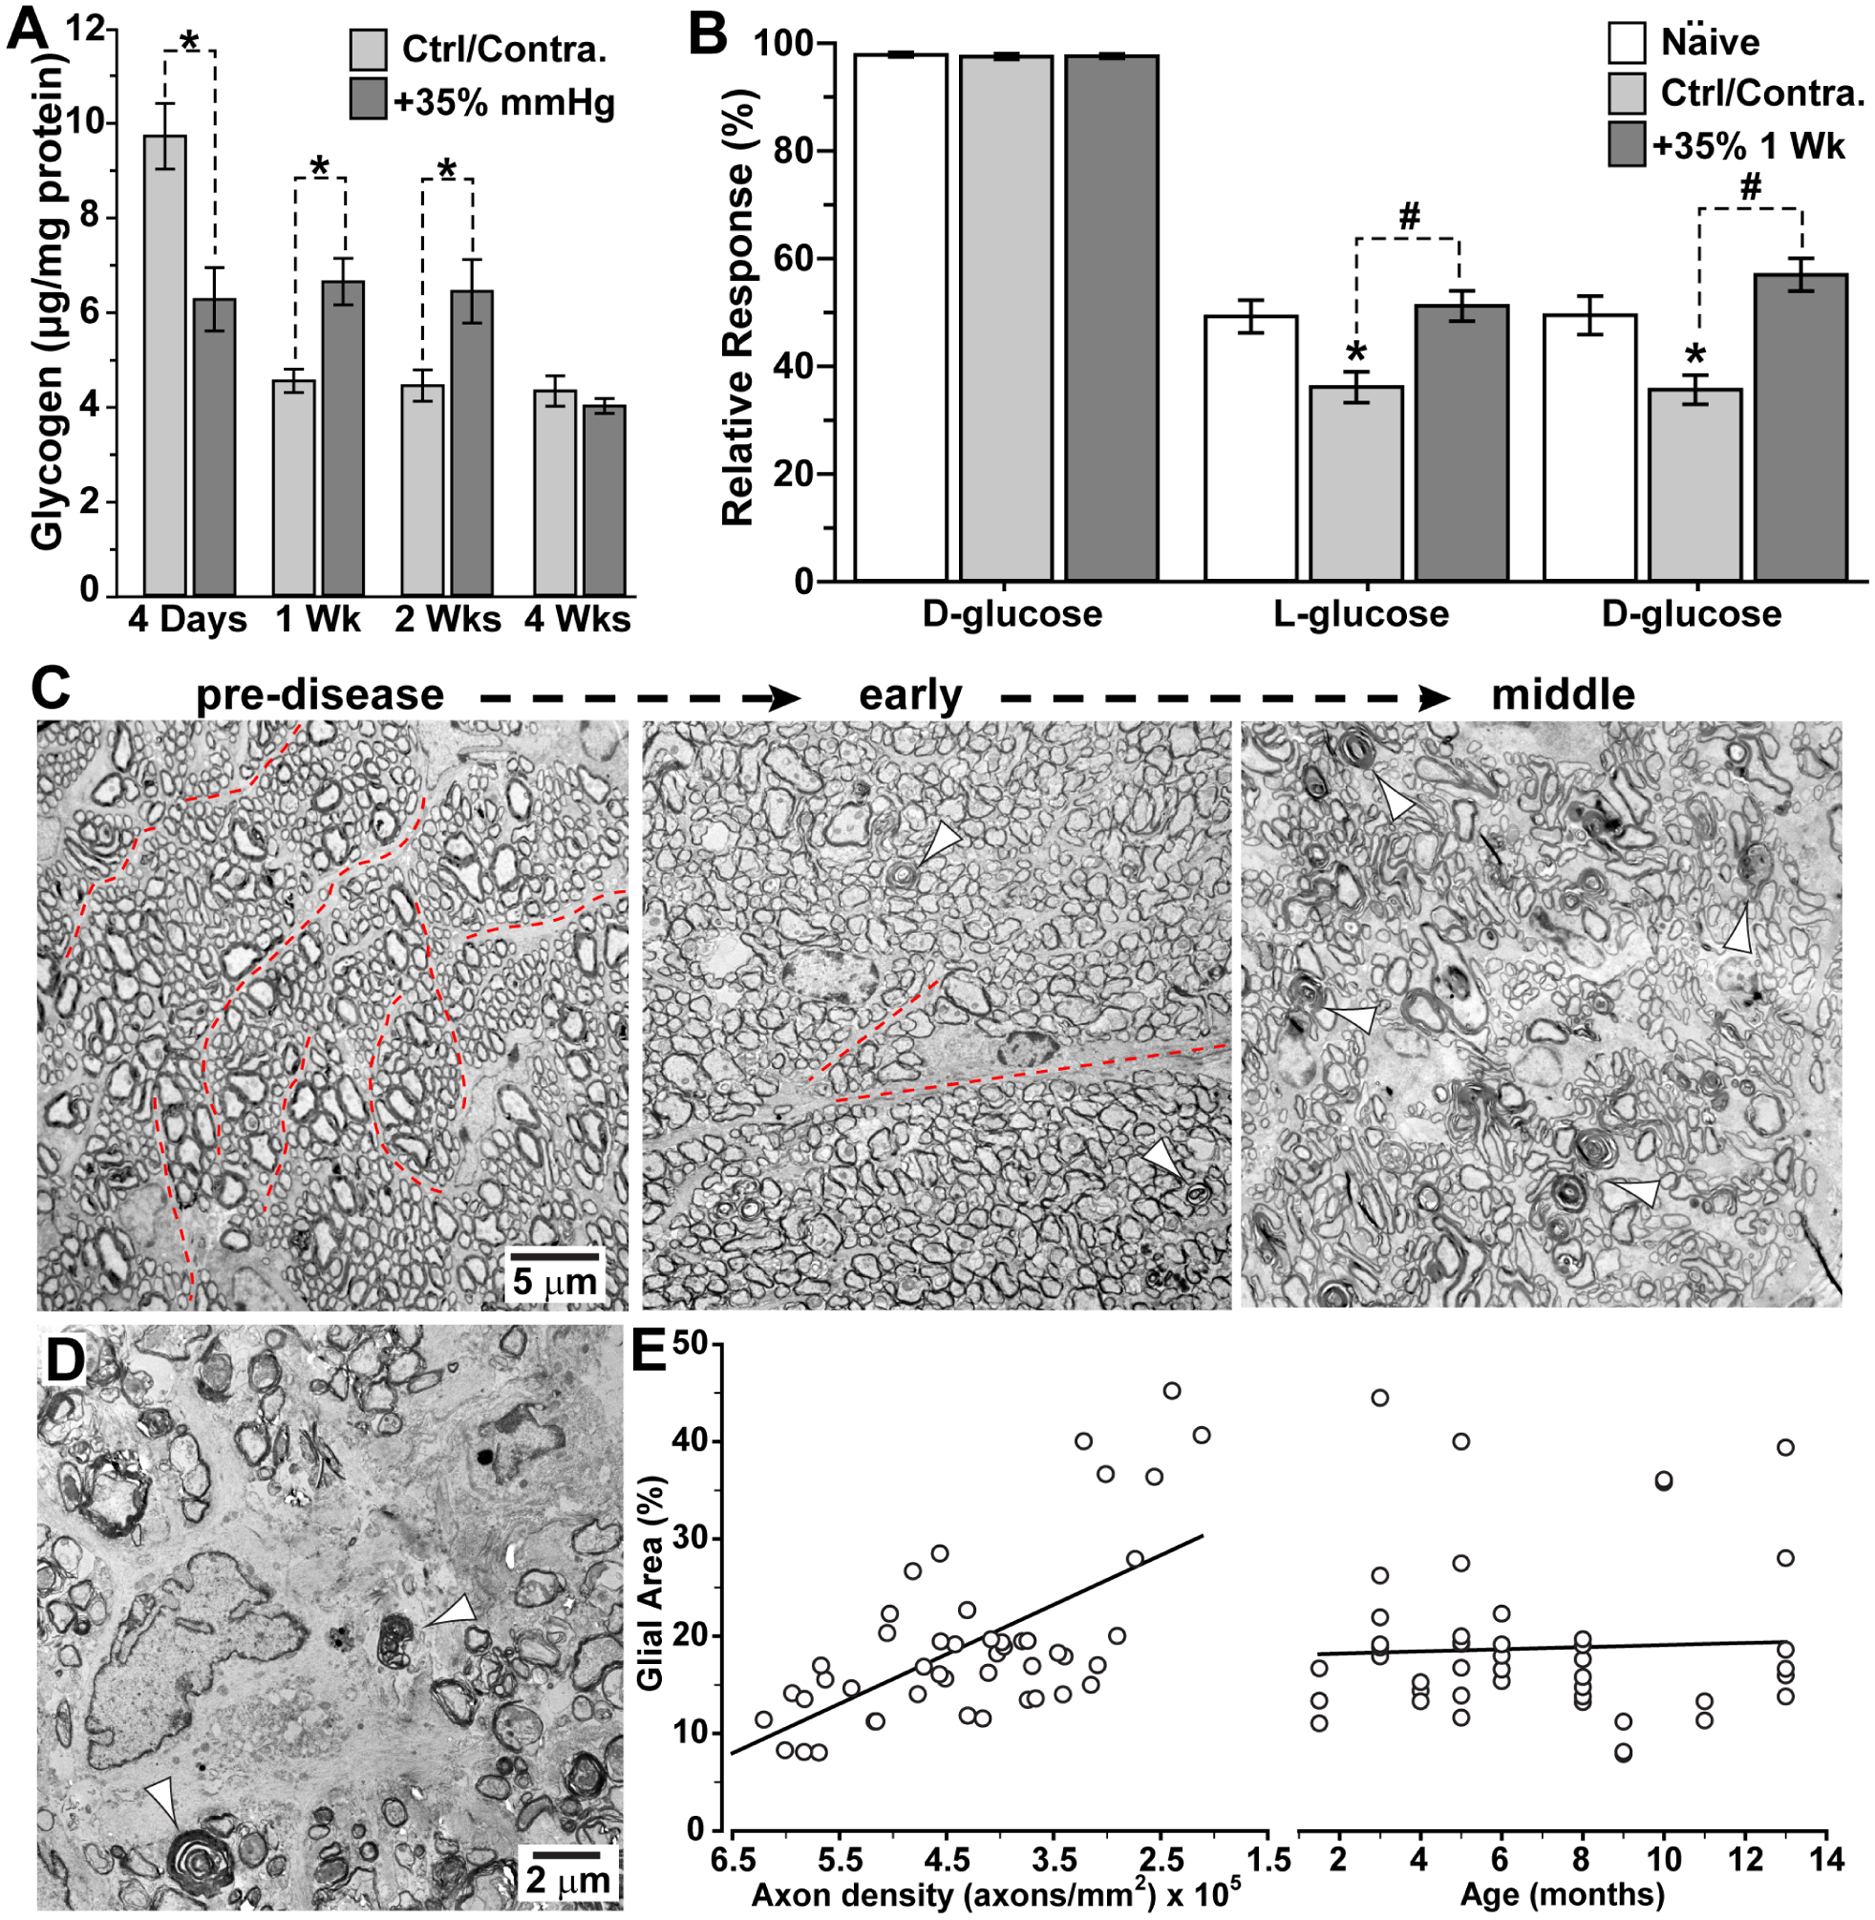
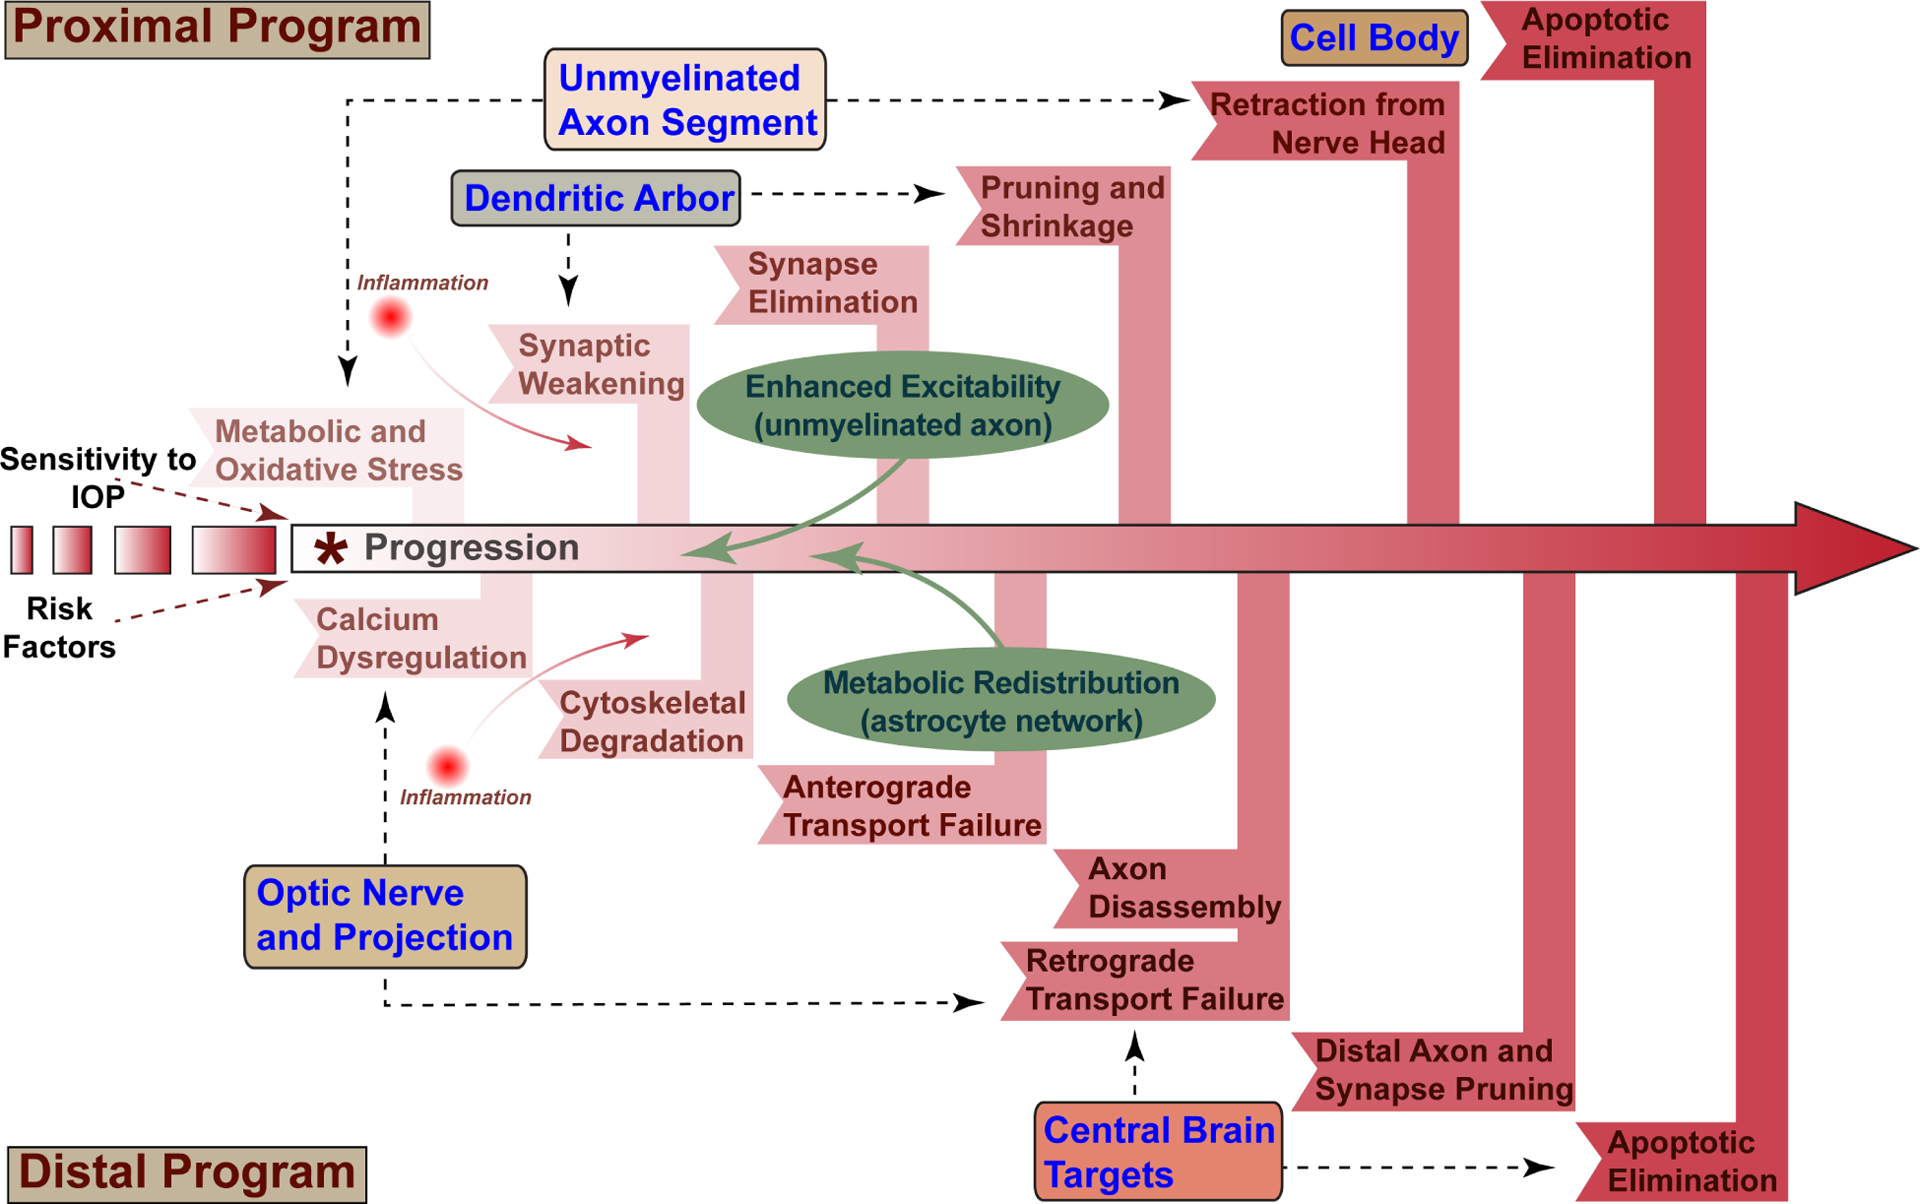
Glaucoma causes loss of vision through degeneration of the retinal ganglion cell (RGC) projection to the brain. The disease is characterized by sensitivity to intraocular pressure (IOP) conveyed at the optic nerve head, through which RGC axons pass unmyelinated to form the optic nerve. From this point, a pathogenic triumvirate comprising inflammatory, oxidative, and metabolic stress influence both proximal structures in the retina and distal structures in the optic projection. This review focuses on metabolic stress and how the optic projection may compensate through novel adaptive mechanisms to protect excitatory signaling to the brain. In the retina and proximal nerve head, the unmyelinated RGC axon segment is energy-inefficient, which leads to increased demand for adenosine-5'-triphosphate (ATP) at the risk of vulnerability to Ca2+-related metabolic and oxidative pressure. This vulnerability may underlie the bidirectional nature of progression. However, recent evidence highlights that the optic projection in glaucoma is not passive but rather demonstrates adaptive processes that may push back against neurodegeneration. In the retina, even as synaptic and dendritic pruning ensues, early progression involves enhanced excitability of RGCs. Enhancement involves depolarization of the resting membrane potential and increased response to light, independent of RGC morphological type. This response is axogenic, arising from increased levels and translocation of voltage-gated sodium channels (NaV) in the unmyelinated segment. During this same early period, large-scale networks of gap-junction coupled astrocytes redistribute metabolic resources to the optic projection stressed by elevated IOP to slow loss of axon function. This redistribution may reflect more local remodeling, as astrocyte processes respond to focal metabolic duress by boosting glycogen turnover in response to axonal activity in an effort to promote survival of the healthiest axons. Both enhanced excitability and metabolic redistribution are transient, indicating that the same adaptive mechanisms that apparently serve to slow progression ultimately may be too expensive for the system to sustain over longer periods.

Keywords: Adaptive remodeling; Astrocytes; Axon degeneration; Gap junctions; Glaucoma; Metabolic stress; Neurodegeneration; Oxidative stress.


Figures

Figure 1.
Figure 1.. Basic structure of the optic nerve head.
The vertebrate retina is inverted with respect to the path of light; the photoreceptor-renewing retinal pigment epithelium (RPE) and choroid are most proximal to the sclera. Retinal ganglion cell axons are unmyelinated in the retina and in entering the nerve head through to the prelaminar region. In passing through the lamina cribrosa, axons become myelinated by oligodendrocytes, first in the retrolaminar region and then throughout the optic nerve, which is bathed in cerebrospinal fluid (CSF). The cribrosa is a critical site of biomechanical coupling to ocular stress through attachments with the peripapillary region of the sclera (solid arrows); its normal backward bowing becomes dramatically more pronounced in glaucoma. In place of a well-defined cribrosa and retrolaminar region the rodent nerve head demonstrates a glial lamina of densely distributed astrocytes and a myelination transition zone, respectively. Astrocyte glia also interact with RGC axons in the retina and in the myelinated segment of the optic nerve. The central retina artery (CRA) and vein (CRV) enter the retina through the optic disc.
Figure 2.
Figure 2.. Visual projection in glaucoma.
Retinal ganglion cell axons project through the optic nerve head and at the optic chiasm join either the ipsilateral or contralateral optic tract to central brain targets. The strength of each projection varies by species; the rodent retina projects primarily contralaterally, while the primate retina projects equally to both. Central targets include the suprachiasmatic nucleus (SCN) of the hypothalamus (HT) and the olivary pretectal nucleus (OPT), nucleus of the optic tract (NOT), and posterior pretectal (PPT) nucleus of the pretectum. The lateral geniculate nucleus (LGN) of the thalamus is the primary RGC recipient in primates, while in rodents all or nearly all ganglion cells project to the superior colliculus (SC), while extending axon collaterals to nuclei more proximal to the retina. In all mammals the SC is the most distal direct target, while the LGN provides all direct projection to the primary visual cortex. In the glaucoma, stress at the optic nerve head (*) is conveyed along the ganglion cell axon both towards the brain, in the anterograde direction, and towards the retina, in the retrograde direction. Modified from Crish and Calkins (2015).
Figure 3.
Figure 3.. RGC axonal ultrastructure.
A. Mouse optic nerve labeled with antibodies against myelin basic protein (MBP) showing paranodal contactin-associated protein 1 (Caspr1) flanking nodes of Ranvier containing the voltage-gated sodium channel NaV1.6 subunit. B. Mouse ganglion cell in wholemount preparation following intracellular dye filling to illuminate dendritic arbor and unmyelinated axon segment rich in varicosities (arrowheads). C. High magnification micrograph of RGC axonal varicosity labeled for neurofilament heavy chains (NF-H) contains mitochondria rich in the enzyme cytochrome c oxidase subunit 4 isoform 1 (Cox4-I1). D. Phosphorylated neurofilament heavy chains (pNF-H) in Brn3a-labeled ganglion cell highlights varicosities in the unmyelinated axon segment containing NaV1.6 (arrowheads).
Figure 4.
Figure 4.. Age is predominating determinate of anterograde axonal transport.
A. Retinotopic maps of superior colliculus (SC) from five-month (left) and eight-month (right) DBA/2J mice, each receiving retinal projections from eyes with mean lifetime IOP of 18.5 mm Hg. Maps show levels of cholera toxin B transported from the retina varying from 100% (red) to 50% (green) to 0% (blue). B. Maps of five-month (left) and 10-month (right) DBA/2J SC, with corresponding mean IOP of 17.0 mm Hg. C. Intact anterograde transport of cholera toxin b to the DBA/2J SC expressed as the fraction of the retinotopic map with ≥ 70% signal density vs. age in months (top). All SC received retinal projection from eyes with mean lifetime IOP < 20 mm Hg. Best-fitting regression shows a significant correlation (r2=0.64; p<0.001). Threshold mean lifetime IOP to induce a 50% loss of intact anterograde transport to the DBA/2J SC diminishes with age (bottom).
Figure 5.
Figure 5.. Enhanced excitability is independent of dendritic pruning.
A. Dendritic arbor of an ON-Sustained RGC from control (left) mouse retina following intracellular filling during physiological recording. Same cell type following two weeks of microbead-induced IOP elevation (+35%) shows loss of dendritic branch points (right). B. Current-clamp recordings from single ON-Sustained RGCs from control mouse retina (left) and from retinas following two (middle) and four (right) weeks of elevated IOP. At two weeks, the RGC demonstrates enhanced response to light and a more depolarized resting membrane potential (rmp); by four weeks, response diminishes compared to control. C. Mean response to light after two weeks of elevated IOP increases as resting membrane potential becomes more depolarized (left) and dendritic branch points diminish (right) compared to control (* marks averages ± SEM). Despite having fewer branch points overall, the mean response of ON-Sustained RGCs at two weeks increases with dendritic complexity (p=0.01). Experiments described in Risner et al. (2018).
Figure 6.
Figure 6.. Astrocyte metabolism and remodeling in the optic nerve.
A. In C57 mice, microbead-induced elevations in IOP (+35%) initially diminish astrocyte-stored glycogen in the optic nerve compared to the control/contralateral control nerve; after one and two weeks, glycogen in the stressed nerve increases at the expense of the control nerve (*, p ≤ 0.05). By four weeks, glycogen equilibrates between the nerves. B. As a result of glycogen imbalance, compound action potential of C57 optic nerve following one week of elevated IOP responds stronger during and recovers faster from D-glucose deprivation than control/contralateral control nerve (#, p<0.001); control nerve also response more weakly than naïve nerve (*, p ≤ 0.002). C. Electron micrographs of cross-sections through DBA/2J optic nerve demonstrate intact axon fascicles bound by thin astrocyte processes (dotted lines) prior to progression (left). In the early stages, axons enlarge, and astrocyte processes withdraw with sparse examples of degenerating profiles (arrowheads). As progression continues (right), fascicles become disorganized as degeneration accelerates. D. In final stages, DBA/2J nerve demonstrates abundant degenerating profiles (arrowheads) as astrocyte hypertrophy predominates over intact axons. E. The density of intact RGC axons determines the extent of astrocyte hypertrophy in the DBA/2J more so than age (r2=0.42; p<0.001). A, B: modified from Cooper et al. (2020). C,D: see also Cooper et al., 2016; .
Figure 7.
Figure 7.. Progression involves adaptive responses slow progression.
Sensitivity to IOP and other risk factors combine to increase susceptibility to glaucomatous neurodegeneration through stress conveyed to the RGC axon within the optic nerve head (*). Progression comprises a proximal program influencing the unmyelinated axon segment, RGC dendritic arbor, and cell body and a distal program affecting the myelinated axon and its projection into central brain targets. Each program includes inflammatory signaling, which contributes in multiple ways to pathogenesis. In this model, early metabolic and oxidative stress originating in the unmyelinated axon segment leads to both calcium dysregulation and axonopathy in the optic nerve and synaptic and dendritic pruning in the retina. Enhanced excitability originating in the unmyelinated segment and astrocyte-mediated metabolic redistribution represent adaptive responses that impede proximal and distal programs, respectively.

Similar articles

Cited by

References

    1. AGIS Investigators. 2000. The Advanced Glaucoma Intervention study (AGIS): 7. The relationship between control of intraocular pressure and visual field deterioration. Am J Ophthalmol, 130:429–440. - PubMed
    1. Agostinone J, Alarcon-Martinez L, Gamlin C, Yu WQ, Wong ROL, Di Polo A, 2018. Insulin signalling promotes dendrite and synapse regeneration and restores circuit function after axonal injury. Brain 141, 1963–1980. - PMC - PubMed
    1. Agostinone J, Di Polo A, 2015. Retinal ganglion cell dendrite pathology and synapse loss: Implications for glaucoma. Prog Brain Res 220, 199–216. - PubMed
    1. Almasieh M, Wilson AM, Morquette B, Cueva Vargas JL, Di Polo A, 2012. The molecular basis of retinal ganglion cell death in glaucoma. Prog Retin Eye Res 31, 152–181. - PubMed
    1. Ames A 3rd, 2000. CNS energy metabolism as related to function. Brain Res Brain Res Rev 34, 42–68. - PubMed

Publication types