

Proximity to international airports and early transmission of COVID-19 in the United States-An epidemiological assessment of the geographic distribution of 490,000 cases
- PMID: 33640475
- PMCID: PMC7906855
- DOI: 10.1016/j.tmaid.2021.102004
Proximity to international airports and early transmission of COVID-19 in the United States-An epidemiological assessment of the geographic distribution of 490,000 cases
Abstract
Background: Identifying hotspots in a pandemic is essential for early containment. In the context of the rapid global dissemination of the Covid-19 pandemic, describing viral infection rates in relation to international air travel early during the pandemic can help inform future public health policy. The objective of this study is to determine whether proximity to an international airport predicted higher infection rates during the early phase of the Covid-19 pandemic in the United States (US).
Methods: In this cross-sectional study, the authors examined the incidence of Covid-19 in areas near US international airports in the first weeks after detection of Covid-19 in all 50 states, using publicly available county-level incidence of Covid-19 data. They performed a multiple regression to determine the relative effects of population density and air traffic in the Counties Containing Airports (CCA) and the number of Covid-19 cases, and determined the odds of Covid-19 in CCA compared to the rest of the state.
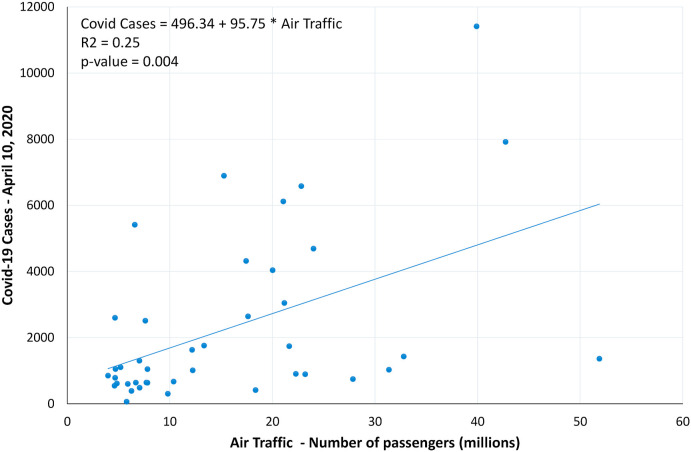
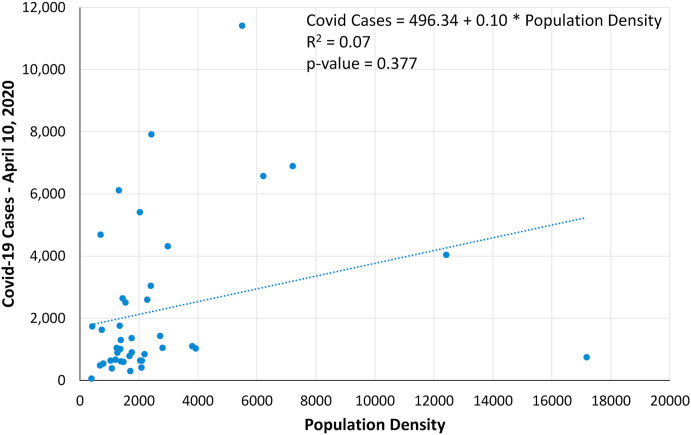
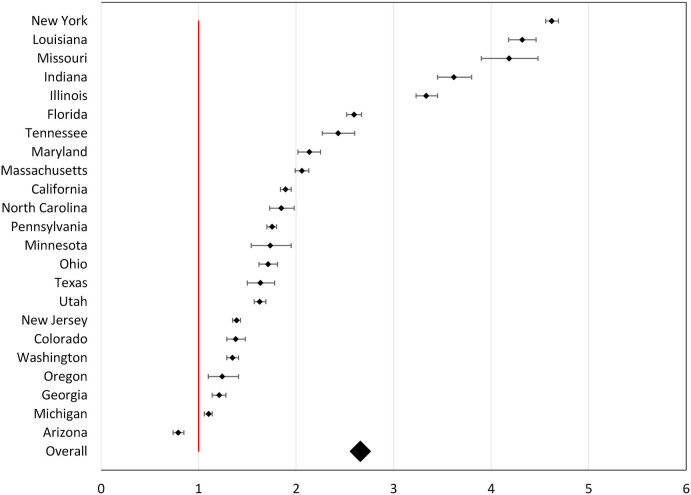
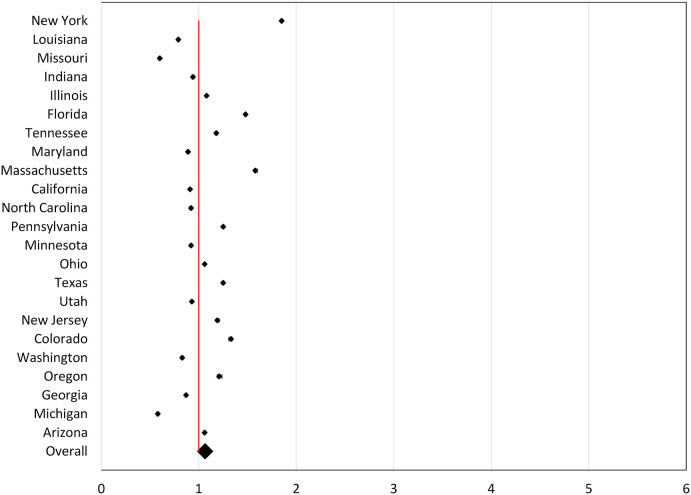
Results: Multiple regression analysis revealed that air traffic was significantly correlated with Covid-19 cases during the initial phase of pandemic while population density was not significantly correlated. Three weeks into the pandemic, the pooled odds of Covid-19 cases in CCA was 2.66 (95% CI [2.64, 2.68], p < 0.0001).
Conclusions: The counties in the US containing international airports represented initial hotspots for Covid-19 transmission. Early public health containment efforts focused on these areas may help mitigate disease transmission during future similar novel respiratory virus epidemics.
Keywords: Containment; Covid-19; Hotspots; Public health interventions.
Copyright © 2021 Elsevier Ltd. All rights reserved.
Conflict of interest statement
We declare no competing interests.
Figures
Similar articles
-
Air travel and COVID-19 prevention in the pandemic and peri-pandemic period: A narrative review.Travel Med Infect Dis. 2021 Jan-Feb;39:101915. doi: 10.1016/j.tmaid.2020.101915. Epub 2020 Nov 10. Travel Med Infect Dis. 2021. PMID: 33186687 Free PMC article. Review.
-
Estimating COVID-19 outbreak risk through air travel.J Travel Med. 2020 Aug 20;27(5):taaa093. doi: 10.1093/jtm/taaa093. J Travel Med. 2020. PMID: 32502274 Free PMC article.
-
Effect of Predeparture Testing on Postarrival SARS-CoV-2-Positive Test Results Among International Travelers - CDC Traveler-Based Genomic Surveillance Program, Four U.S. Airports, March-September 2022.MMWR Morb Mortal Wkly Rep. 2023 Feb 24;72(8):206-209. doi: 10.15585/mmwr.mm7208a2. MMWR Morb Mortal Wkly Rep. 2023. PMID: 36821719 Free PMC article.
-
Dynamic Public Health Surveillance to Track and Mitigate the US COVID-19 Epidemic: Longitudinal Trend Analysis Study.J Med Internet Res. 2020 Dec 3;22(12):e24286. doi: 10.2196/24286. J Med Internet Res. 2020. PMID: 33216726 Free PMC article.
-
A rapid review of the effectiveness of screening practices at airports, land borders and ports to reduce the transmission of respiratory infectious diseases such as COVID-19.S Afr Med J. 2020 Oct 12;110(11):1105-1109. S Afr Med J. 2020. PMID: 33403987 Review.
Cited by
-
Work-related connectivity between Boston Logan international airport and urban communities with high social vulnerability during the COVID-19 pandemic.Trop Dis Travel Med Vaccines. 2025 Jun 1;11(1):15. doi: 10.1186/s40794-025-00249-0. Trop Dis Travel Med Vaccines. 2025. PMID: 40450310 Free PMC article.
-
Study on the mechanism of public attention to a major event: The outbreak of COVID-19 in China.Sustain Cities Soc. 2022 Jun;81:103811. doi: 10.1016/j.scs.2022.103811. Epub 2022 Feb 28. Sustain Cities Soc. 2022. PMID: 35251907 Free PMC article.
-
Statistical indicators of compliance with anti-COVID-19 public health measures at European airports.Int J Disaster Risk Reduct. 2022 Jan;68:102720. doi: 10.1016/j.ijdrr.2021.102720. Epub 2021 Dec 11. Int J Disaster Risk Reduct. 2022. PMID: 34926139 Free PMC article.
-
COVID-19's U.S. Temperature Response Profile.Environ Resour Econ (Dordr). 2021;80(4):675-704. doi: 10.1007/s10640-021-00603-8. Epub 2021 Sep 20. Environ Resour Econ (Dordr). 2021. PMID: 34566260 Free PMC article.
-
Superspreading events of SARS-CoV-2 in Paris: A retrospective analysis of data from the first wave of COVID-19 in 2020.J Infect Public Health. 2021 Nov;14(11):1733-1738. doi: 10.1016/j.jiph.2021.10.001. Epub 2021 Oct 6. J Infect Public Health. 2021. PMID: 34715427 Free PMC article.
References
-
- Data API. The COVID tracking Project. 2020. https://covidtracking.com/api
-
- Coronavirus Update (live): 4,097,956 cases and 280,219 deaths from COVID-19 virus pandemic - worldometer. 2020. https://www.worldometers.info/coronavirus/ Worldometers.info.
-
- Coronavirus disease (COVID-19) situation reports. WHO; 2020. https://www.who.int/emergencies/diseases/novel-coronavirus-2019/situatio...
MeSH terms
LinkOut - more resources
Full Text Sources
Other Literature Sources
Medical
