. 2021 May:73:105494.
doi: 10.1016/j.ultsonch.2021.105494. Epub 2021 Feb 13.

Sensitization of nerve cells to ultrasound stimulation through Piezo1-targeted microbubbles

Affiliations

Sensitization of nerve cells to ultrasound stimulation through Piezo1-targeted microbubbles

Xuelian Shen et al. Ultrason Sonochem. 2021 May.

Abstract

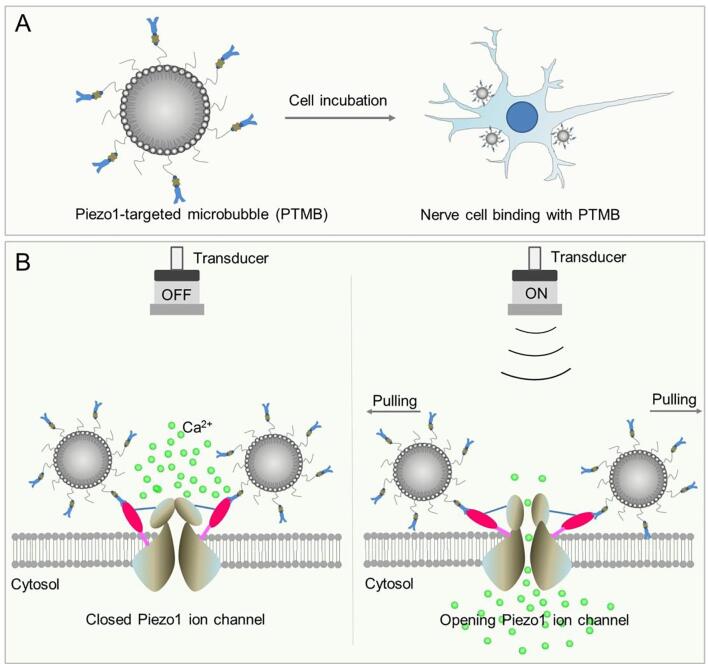
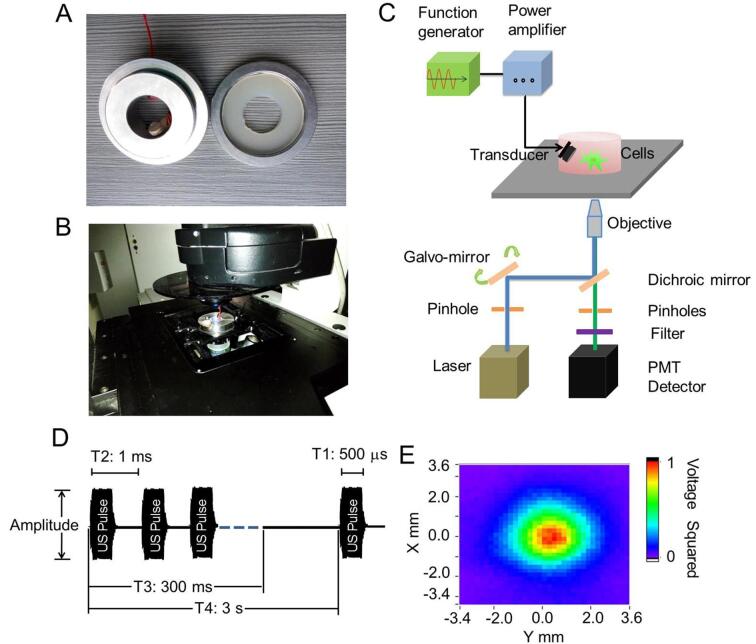
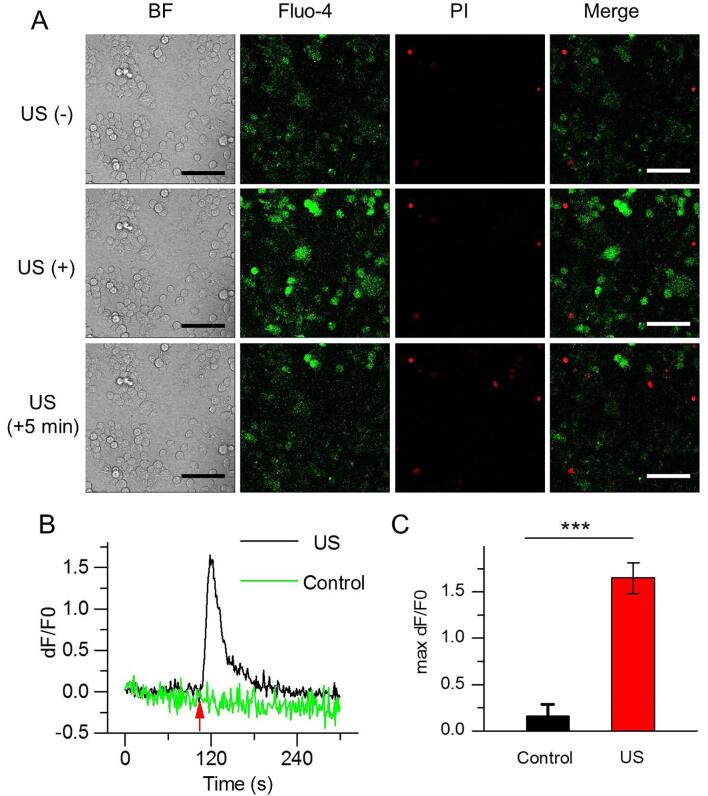
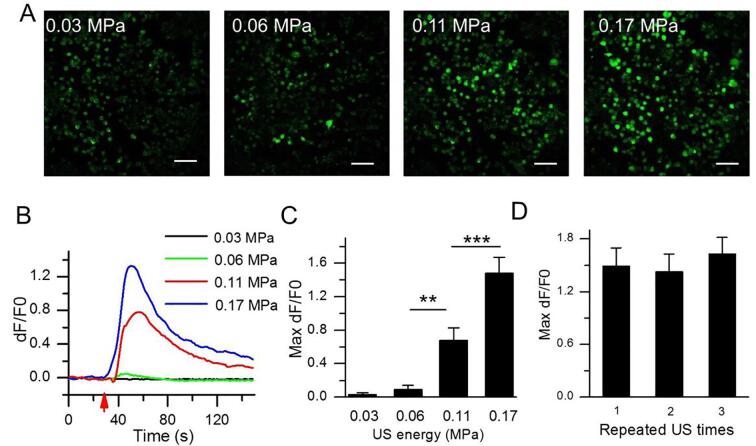
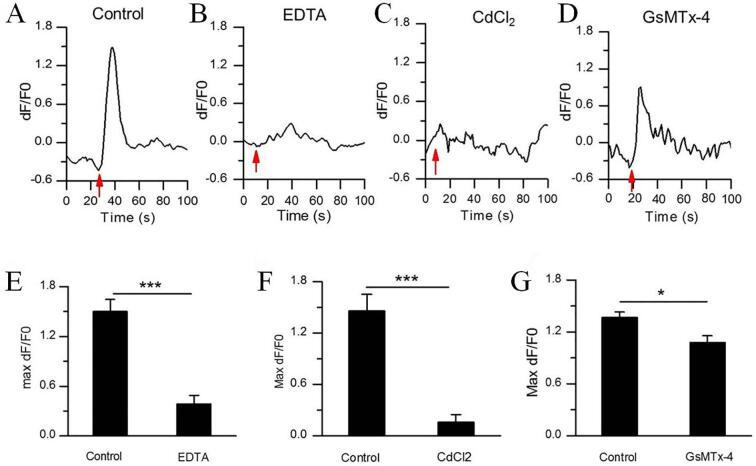
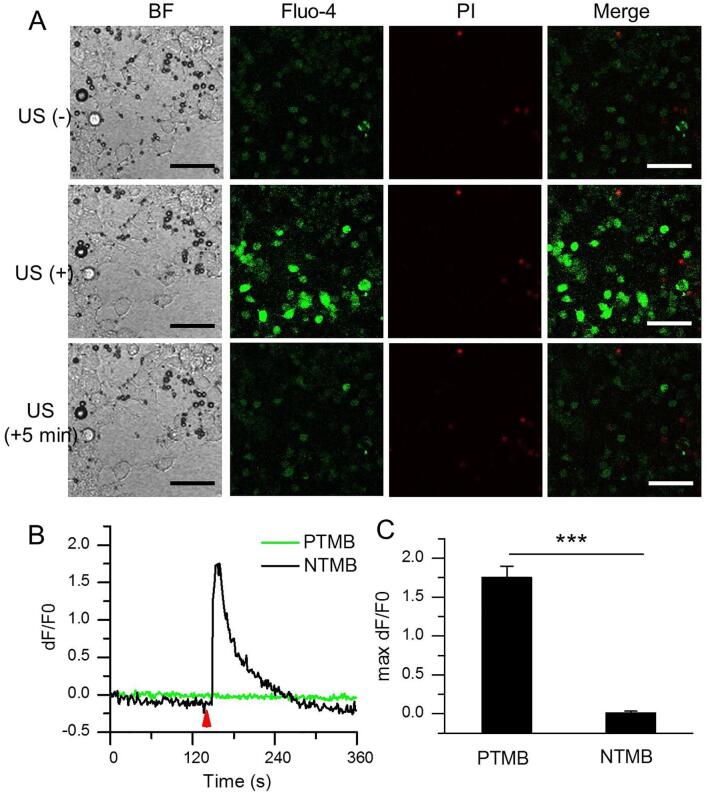
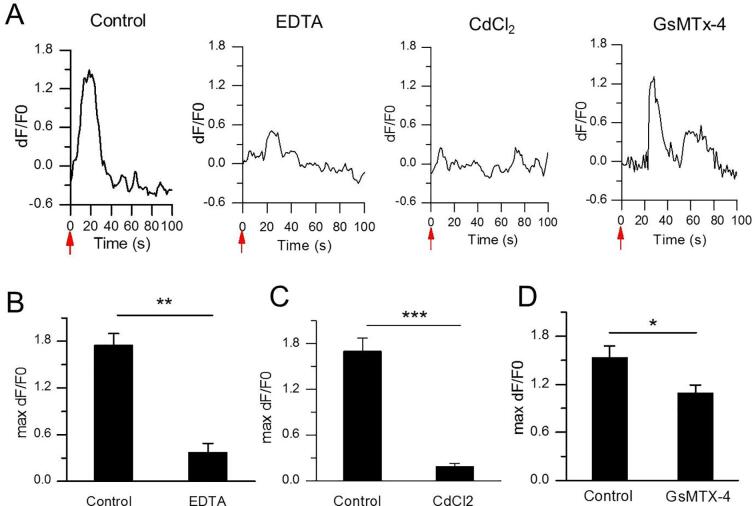
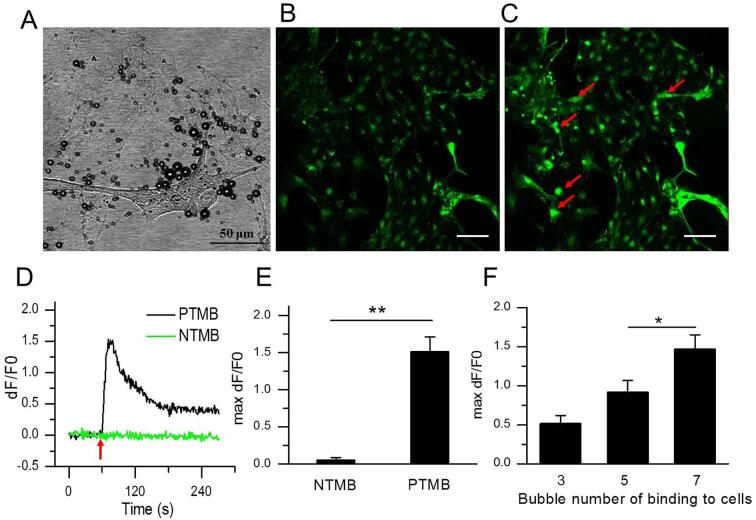
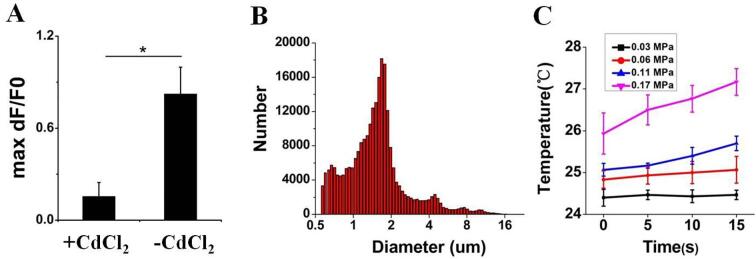
Neuromodulation by ultrasound (US) has recently drawn considerable attention due to its great advantages in noninvasiveness, high penetrability across the skull and highly focusable acoustic energy. However, the mechanisms and safety from US irradiation still remain less understood. Recently, documents revealed Piezo1, a mechanosensitive cation channel, plays key role in converting mechanical stimuli from US through its trimeric propeller-like structure. Here, we developed a Piezo1-targeted microbubble (PTMB) which can bind to the extracellular domains of Piezo1 channel. Due to the higher responsiveness of bubbles to mechanical stimuli from US, significantly lower US energy for these PTMB-binding cells may be needed to open these mechanosensitive channels. Our results showed US energy at 0.03 MPa of peak negative pressure can achieve an equivalent level of cytoplasmic Ca2+ transients which generally needs 0.17 MPa US intensity for the control cells. Cytoplasmic Ca2+ elevations were greatly reduced by chelating extracellular calcium ions or using the cationic ion channel inhibitors, confirming that US-mediated calcium influx are dependent on the Piezo1 channels. No bubble destruction and obvious temperature increase were observed during the US exposure, indicating cavitation and heating effects hardly participate in the process of Ca2+ transients. In conclusion, our study provides a novel strategy to sensitize the response of nerve cells to US stimulation, which makes it safer application for US-mediated neuromodulation in the future.

Keywords: Ca(2+) transients; Microbubbles; Neuromodulation; Piezo1; Ultrasound stimulation.


Conflict of interest statement

The authors declare that they have no known competing financial interests or personal relationships that could have appeared to influence the work reported in this paper.

Figures

Scheme 1
Scheme 1
The diagram of PTMB binding to the cells and the enhanced calcium influx by US stimulation. PTMB was incubated with nerve cells, resulting in the binding of Piezo1-MBs to the Piezo1 channel. Before US stimulation, extracellular calcium concentration is higher than intracellular calcium concentration and the Piezo1 channel to which PTMB attached via receptor-ligand binding on the cell membrane is closed. US stimulation lead to the opening of Piezo1 channel, followed by extracellular calcium flowing into the cells.
Fig. 1
Fig. 1
US stimulation system and live cell calcium fluorescence imaging system. (A) One self-made steel cell holder and coverlid was designed for US stimulation, in which a 2 MHz ultrasonic transducer was fixed on the wall of holder. A 2.0 × 3.5 cm hole which can be cover by a glass coverlid was design in the middle to allow the light through the cell holder. Cells can be cultured on the glass coverlid and be irradiated by US. (B) Cell holder and coverlid can be built into a fixture with the cultivated cells and placed on a confocal microscope, thus building a live cell calcium fluorescence imaging system. (C) The diagram of whole US-stimulation live cell calcium fluorescence imaging system. (D) Characterization of US waveforms. (E) The acoustic field distribution scanned by acoustic field scanning system.
Fig. 2
Fig. 2
US triggers Ca2+ transients in N2A. (A) Confocal images of N2A cells before, immediately or 5 min after receiving US irradiation in bright field, Fluo-4 AM (green), PI staining (red) and merge model. The fluorescence intensity of Fluo-4 reflects the concentration of intracellular calcium. PI can stain dead cells red due to cell membrane destruction. Scale bar, 100 μm. (B) Significantly enhanced Ca2+ fluorescence signals (dF/F0) could be immediately observed in N2A cells in response to US stimulation and trended to decay after 5 min. (C) Average maximum dF/F0 mean fluorescence intensity in control and US-stimulated cells. (C) Data are expressed as mean ± SEM and analyzed by two-tail unpaired Student t test. ***P < 0.0001 vs Control. (n = 46 cells from 3 slices). n represents the number of cells with the enhanced Ca2+ signals. Acoustic pressure is 0.17 MPa, T1 = 500 μs, T2 = 1 ms, T3 = 300 ms, T4 = 3 s, total time is 10 s. (For interpretation of the references to colour in this figure legend, the reader is referred to the web version of this article.)
Fig. 3
Fig. 3
Intensity-dependent cytoplasmic Ca2+ elevation in N2A. (A) Confocal images of N2A cells receiving various acoustic pressures at 0.03, 0.06, 0.11 or 0.17 MPa, showing an US intensity-dependent cytoplasmic Ca2+ elevation. Scale bar, 100 μm. (B) Temporal fluorescence intensity curves in N2A cells at different acoustic pressures. (C) Analysis of Fluo-4 mean fluorescence intensity at different acoustic pressures. (n = 60 cells from 3 slices). (D) Ca2+ transients can response to the repeated US stimulation at 0.17 MPa acoustic pressure (n = 37 cells from 3 slices). Data are expressed as mean ± SEM and analyzed by one-way ANOVA and Fisher least significant difference (LSD). ***P < 0.0001, **P < 0.001. n represents the number of invading cells. T1 = 500 μs, T2 = 1 ms, T3 = 300 ms, T4 = 3 s, total time is 10 s.
Fig. 4
Fig. 4
Characteristics of US-evoked Ca2+ transients in N2A. (A-D) Representative traces of US-activated Ca2+ fluorescence signals of N2A cells treated with PBS control, EDTA, CdCl2 or GsMTx-4 inhibitors. (E-G) The average maximum dF/F0 of N2A cells treated with (E) 5 mM EDTA (n = 60 cells from 3 slices), (F) 150 μM CdCl2 (n = 79 cells from 3 slices), or (G) 3 μM GsMTx-4 (n = 64 cells from 3 slices). Bars represent the mean ± SEM. Two-tail unpaired Student t test, ***P < 0.0001, **P < 0.001, *P < 0.05. n represents the number of invading cells. Acoustic pressure is 0.17 MPa, T1 = 500 μs, T2 = 1 ms, T3 = 300 ms, T4 = 3 s, total time is 10 s.
Fig. 5
Fig. 5
Piezo1-MBs sensitized the effect of US stimulation of N2A. (A) Confocal images of PTMB-binding N2A cells before, immediately or 5 min after receiving US irradiation in bright field, Fluo-4 AM (green), PI staining (red) and merge model. Acoustic pressure is 0.03 MPa, T1 = 500 μs, T2 = 1 ms, T3 = 300 ms, T4 = 3 s, total time is 5 s. Scale bar, 100 μm. (B) Temporal fluorescence intensity changes of Piezo1-MBs-binding N2A cells before, immediately or 5 min after receiving US irradiation. (C) Average maximum dF/F0 of N2A cells incubated with the NTMB (n = 189 cells from 3 slices) or the adhered PTMB (n = 292 cells from 3 slices), followed by US irradiation. Acoustic pressure is 0.03 MPa, T1 = 500 μs, T2 = 1 ms, T3 = 300 ms, T4 = 3 s, total time is 5 s. Data are expressed as mean ± SEM. ***P < 0.0001. (For interpretation of the references to colour in this figure legend, the reader is referred to the web version of this article.)
Fig. 6
Fig. 6
Characteristics of US-evoked Ca2+ transients in N2A with the adhered PTMB. (A) Representative traces of US-activated Ca2+ fluorescence signals of PTMB-binding N2A cells treated with PBS control, EDTA, CdCl2 or GsMTx-4 inhibitors. Acoustic pressure is 0.03 MPa, T1 = 500 μs, T2 = 1 ms, T3 = 300 ms, T4 = 3 s, total time is 5 s. (B-D) The average maximum dF/F0 of N2A cells treated with (B) 5 mM EDTA (n = 292 cells from 3 slices), (C) 150 μM CdCl2 (n = 152 cells from 3 slices) or (D) 3 μM GsMTx-4. (n = 80 cells from 3 slices). Bars represent the mean ± SEM and analysed by two-tail unpaired Student t test. ***P < 0.0001, **P < 0.001, *P < 0.05.
Fig. 7
Fig. 7
PTMB sensitized the effect of ultrasonic stimulation of neurons. (A) Bright field image of rat primary hippocampal neurons bound with Piezo1-MBs before US irradiation. (B) Confocal image of PTMB-binding hippocampal neurons stained with Fluo-4 AM before US irradiation. (C) Confocal image of PTMB-binding hippocampal neurons stained with Fluo-4 AM immediately after US irradiation. Acoustic pressure is 0.03 MPa, T1 = 500 μs, T2 = 1 ms, T3 = 300 ms, T4 = 3 s, total time is 5 s. Scale bar, 100 μm. (D) Temporal fluorescence intensity changes of hippocampal neurons in NTMB and PTMB groups. (E) Average maximum dF/F0 of hippocampal neurons in NTMB (n = 86 cells from 3 slices) and PTMB (n = 160 cells from 3 slices) groups. (F) Average maximum dF/F0 of hippocampal neurons binding with 3 (n = 93 cells from 4 slices), 5 (n = 74 cells from 4 slices), 7 (n = 95 cells from 4 slices) PTMB, respectively. Data are expressed as mean ± SEM and analysed by two-tail unpaired Student t test or one-way ANOVA. **P < 0.001, *P < 0.05.
Fig. 8
Fig. 8
(A) The average maximum dF/F0 of N2A cells after wash-off with PBS. Bars represent the mean ± SEM. Two-tail unpaired Student t test, *P < 0.05. Acoustic pressure is 0.17 MPa, T1 = 500 μs, T2 = 1 ms, T3 = 300 ms, T4 = 3 s, total time is 10 s.(B) The size distributions of targeted MBs. (C) Temperature of the US focal zone.

Similar articles

Cited by

References

    1. Demene C., Baranger J., Bernal M., Delanoe C., Auvin S., Biran V., Alison M., Mairesse J., Harribaud E., Pernot M., Tanter M., Baud O. Sci. Transl. Med. 2017;9:eaah6756. - PubMed
    1. Cotero V., Fan Y., Tsaava T., Kressel A.M., Hancu I., Fitzgerald P., Wallace K., Kaanumalle S., Graf J., Rigby W., Kao T.J., Roberts J., Bhushan C., Joel S., Coleman T.R., Zanos S., Tracey K.J., Ashe J., Chavan S.S., Puleo C. Nat. Commun. 2019;10:952. - PMC - PubMed
    1. Rezai A.R., Ranjan M., D'Haese P.F., Haut M.W., Carpenter J., Najib U., Mehta R.I., Chazen J.L., Zibly Z., Yates J.R., Hodder S.L., Kaplitt M. Proc. Natl. Acad. Sci. U S A. 2020;117:9180–9182. - PMC - PubMed
    1. Alamri A., Ughratdar I., Samuel M., Ashkan K. Br. J. Neurosurg. 2015;29:319–328. - PubMed
    1. van de Ruit M., Perenboom M.J., Grey M.J. Brain. Stimul. 2015;8:231–239. - PubMed

LinkOut - more resources