. 2021 May 1:179:113099.
doi: 10.1016/j.bios.2021.113099. Epub 2021 Feb 19.

Emulsion-based isothermal nucleic acid amplification for rapid SARS-CoV-2 detection via angle-dependent light scatter analysis

Affiliations

Emulsion-based isothermal nucleic acid amplification for rapid SARS-CoV-2 detection via angle-dependent light scatter analysis

Alexander S Day et al. Biosens Bioelectron. .

Abstract

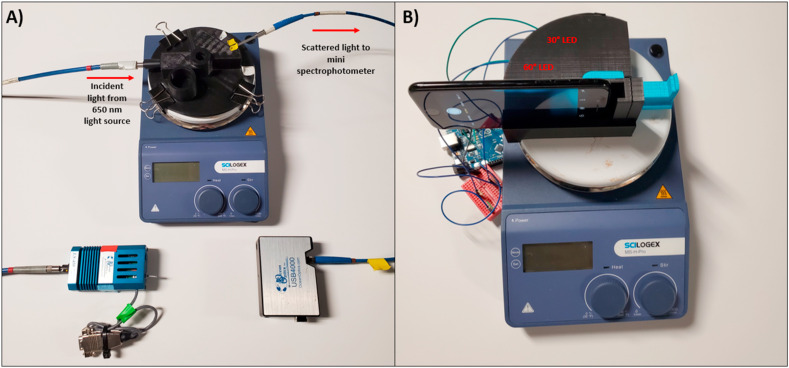
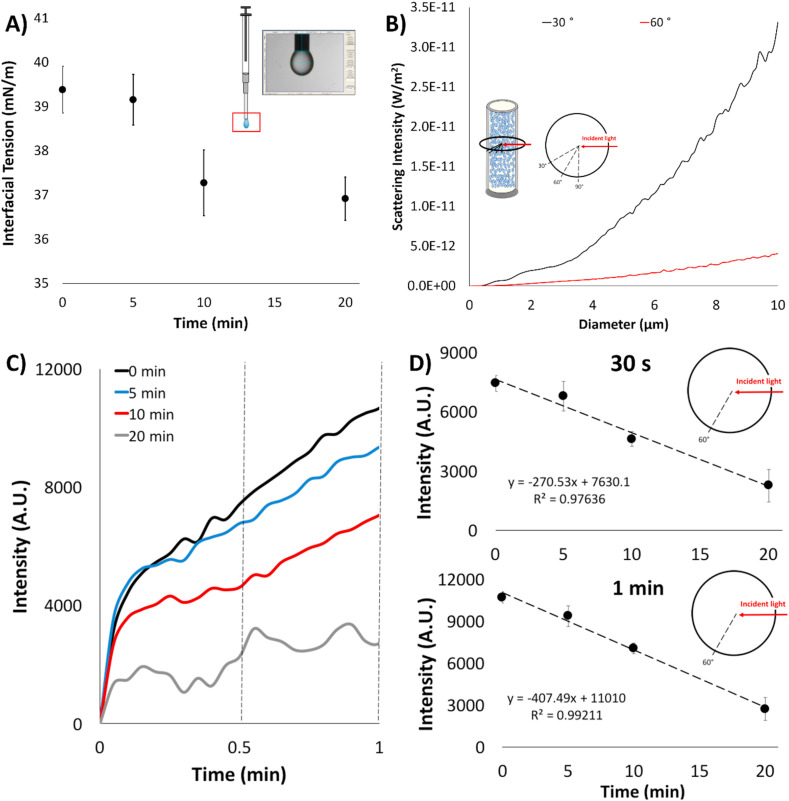
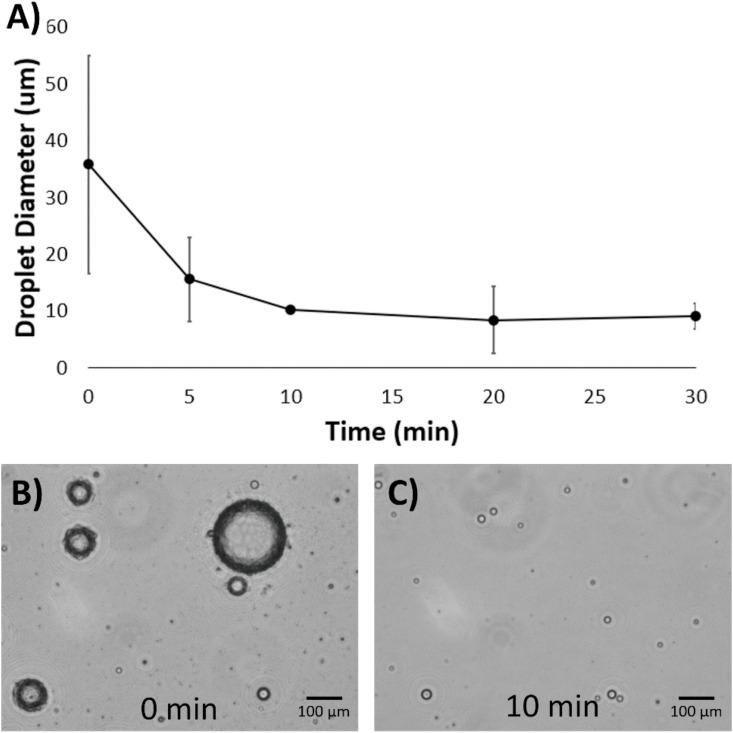
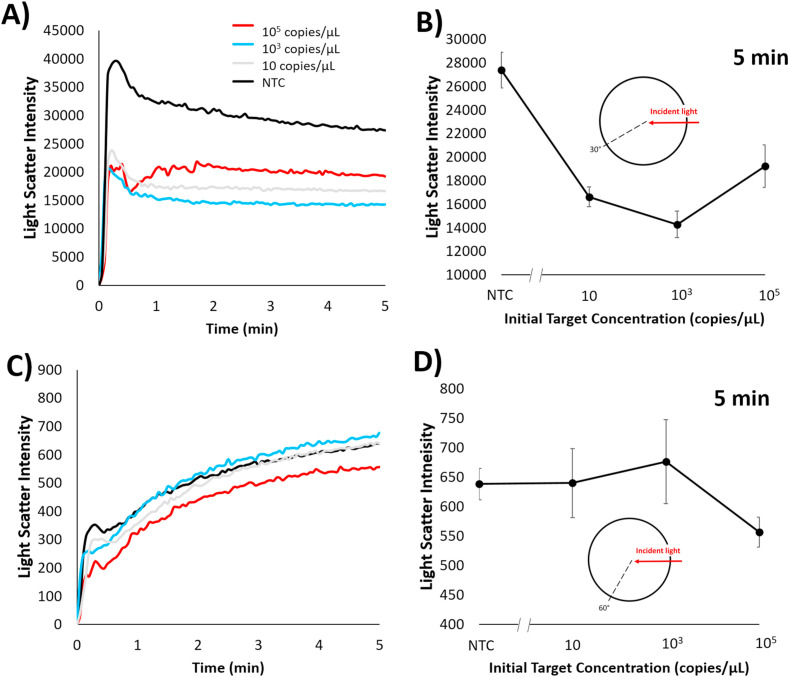
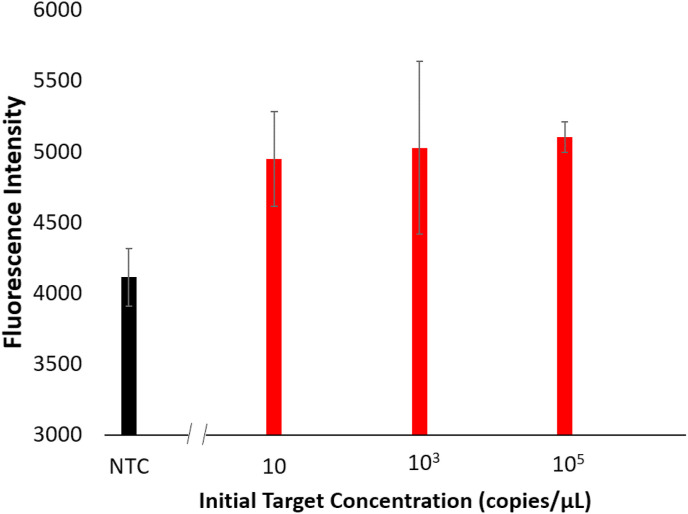
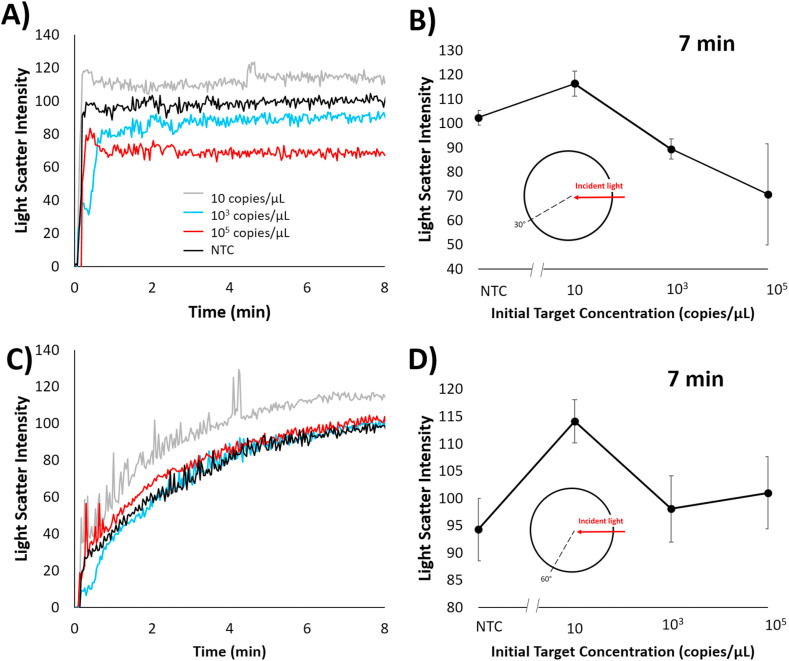
The SARS-CoV-2 pandemic, an ongoing global health crisis, has revealed the need for new technologies that integrate the sensitivity and specificity of RT-PCR tests with a faster time-to-detection. Here, an emulsion loop-mediated isothermal amplification (eLAMP) platform was developed to allow for the compartmentalization of LAMP reactions, leading to faster changes in emulsion characteristics, and thus lowering time-to-detection. Within these droplets, ongoing LAMP reactions lead to adsorption of amplicons to the water-oil interface, causing a decrease in interfacial tension, resulting in smaller emulsion diameters. Changes in emulsion diameter allow for the monitoring of the reaction by use of angle-dependent light scatter (based off Mie scatter theory). Mie scatter simulations confirmed that light scatter intensity is diameter-dependent and smaller colloids have lower intensity values compared to larger colloids. Via spectrophotometers and fiber optic cables placed at 30° and 60°, light scatter intensity was monitored. Scatter intensities collected at 5 min, 30° could statistically differentiate 10, 103, and 105 copies/μL initial concentrations compared to NTC. Similarly, 5 min scatter intensities collected at 60° could statistically differentiate 105 copies/μL initial concentrations in comparison to NTC. The use of both angles during the eLAMP assay allows for distinction between high and low initial target concentrations. The efficacy of a smartphone-based platform was also tested and had a similar limit of detection and assay time of less than 10 min. Furthermore, fluorescence-labeled primers were used to validate target nucleic acid amplification. Compared to existing LAMP assays for SARS-CoV-2 detection, these times-to-detections are very rapid.

Keywords: COVID-19; Emulsion; Interfacial tension; Loop-mediated isothermal amplification; Mie scatter; SARS-CoV-2.


Conflict of interest statement

The authors declare that they have no known competing financial interests or personal relationships that could have appeared to influence the work reported in this paper.

Figures

Fig. 1
Fig. 1
A) Spectrophotometer-based emulsion LAMP platform. Bottom-left light source feeds 650 nm light into the 3D printed platform via the left optical fiber, while the right optical fiber feeds the scattered light to the miniature spectrophotometer, which is on the bottom-right. B) Smartphone-based emulsion LAMP platform. A 3D printed housing holds the smartphone, reaction vial, and two red LEDs in place while an Arduino Uno-controlled circuit alternates LEDs every 3 s. The iPhone's built-in timelapse feature is used to capture videos. (For interpretation of the references to colour in this figure legend, the reader is referred to the Web version of this article.)
Fig. 2
Fig. 2
Proof-of-concept results with the pre-amplified E. coli O157:H7 samples (at 106 CFU/μL). A) Interfacial tension (IFT) measurements of the pre-amplified E. coli O157:H7 samples ran at varying conventional amplification times via pendant droplet analysis. Error bars show standard error with a sample size of 3. B) Mie scatter simulation of light scatter intensity of a normally distributed colloid size distribution in relation to the diameter at 30° and 60° with respect to a 650 nm incident light. Inset illustration depicts an artist's rendition of the emulsion. Blue spheres indicate aqueous droplets suspended in the bulk oil phase (not to scale). A red line shows where red incident light enters the system, and black lines indicate where scatter is measured. C) Emulsion light scatter intensities measured at 60° with respect to 650 nm incident light for the pre-amplified and emulsified suspensions of E. coli O157:H7 over time. D) 60° Light scatter intensities measured at 3 min for these pre-amplified E. coli O157:H7 and emulsified suspensions, showing the linear relationship between time amplified and light scatter intensity. Error bars show standard error with a sample size of 3. (For interpretation of the references to colour in this figure legend, the reader is referred to the Web version of this article.)
Fig. 3
Fig. 3
A) Measured diameters from the light microscope images of 10 μL emulsion from the emulsion LAMP reactions of 105 copies/μL SARS-CoV-2, taken at 0, 5, 10, 20, and 30 min time points (n = 5). The average droplet counts are 29, 22, 44, 35, and 53 at 0, 5, 10, 20, and 30 min, respectively. B) Representative microscopic image of these emulsion suspensions at t = 0 min. C) The same at t = 10 min.
Fig. 4
Fig. 4
In situ light scatter intensity changes for emulsion LAMP reaction of SARS-CoV-2 via spectrophotometer. Changes over time are shown at A) 30° and C) 60° angle with respect to 650 nm incident wavelength with varying initial SARS-CoV-2 positive control concentration of 105, 103, 10, and 0 copies per μL. A) and C) are representative plots; All other plots are available in Supplementary Figure S2. Light scatter intensities at 5 min for B) 30° and D) 60° angles are plotted against the SARS-CoV-2 positive control concentrations of 105, 103, 10, and 0 copies per μL. Error bars show standard error with a sample size of 3.
Fig. 5
Fig. 5
Fluorescent intensities for the broken aqueous solutions from emulsion LAMP reaction for SARS-CoV-2 positive control samples at varying concentrations. Error bars show standard error with a sample size of 3.
Fig. 6
Fig. 6
In situ red channel intensity changes for emulsion LAMP reaction of SARS-CoV-2 via smartphone camera. Changes over time are shown at A) 30° and C) 60° angle with respect to 650 nm incident wavelength with varying initial SARS-CoV-2 positive control concentrations of 105, 103, 10, and 0 copies/μL. A) and C) are representative plots; All other plots are available in Supplementary Figure S4. Representative raw smartphone images are also shown in Supplementary Figure S5. Red channel light scatter intensity changes at 7 min are shown for B) 30° and D) 60°. Error bars show standard error with a sample size of 3. (For interpretation of the references to colour in this figure legend, the reader is referred to the Web version of this article.)

Similar articles

Cited by

References

    1. Ali Z., Aman R., Mahas A., Rao G.S., Tehseen M., Marsic T., Salunke R., Subudhi A.K., Hala S.M., Hamdan S.M., Pain A. Virus Res. 2020;288 doi: 10.1016/j.virusres.2020.198129. - DOI - PMC - PubMed
    1. Corman V.M., Landt O., Kaiser M., Molenkamp R., Meijer A., Chu D.K., Bleicker T., Brünink S., Schneider J., Schmidt M.L., Mulders D.G. Euro Surveill. 2020;25(3) doi: 10.2807/1560-7917.ES.2020.25.3.2000045. - DOI - PubMed
    1. Cui F., Zhou H.S. Biosens. Bioelectron. 2020;166 doi: 10.1016/j.bios.2020.112437. - DOI - PMC - PubMed
    1. Deguo W., Guicheng H., Fugui W., Yonggang L., Daxi R. Afr. J. Food Sci. 2008;1(7):83–86. doi: 10.5897/AJFS.9000079. - DOI
    1. Fu Q., Sun W. Appl. Optic. 2001;40(9):1354–1361. doi: 10.1364/AO.40.001354. - DOI - PubMed

MeSH terms

Supplementary concepts