

Characterizing Escherichia coli's transcriptional response to different styrene exposure modes reveals novel toxicity and tolerance insights
- PMID: 33640981
- PMCID: PMC9138201
- DOI: 10.1093/jimb/kuab019
Characterizing Escherichia coli's transcriptional response to different styrene exposure modes reveals novel toxicity and tolerance insights
Abstract
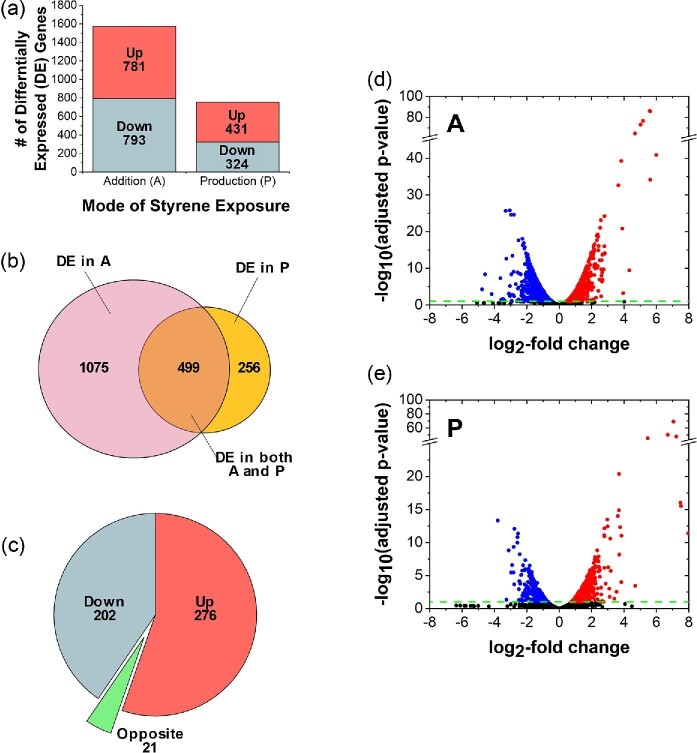
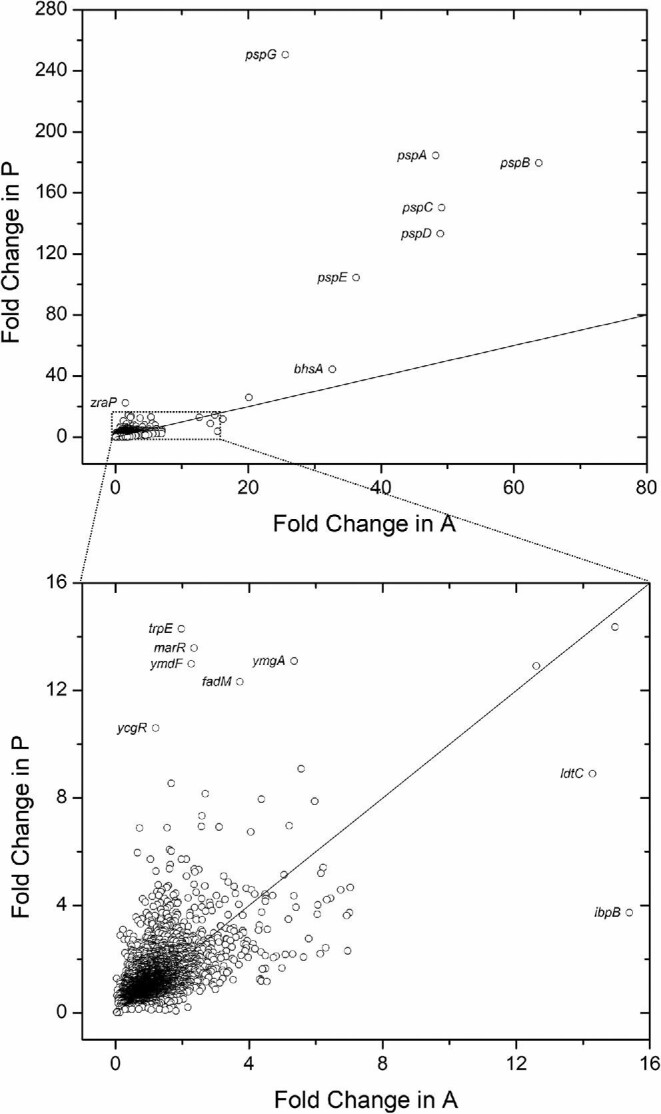
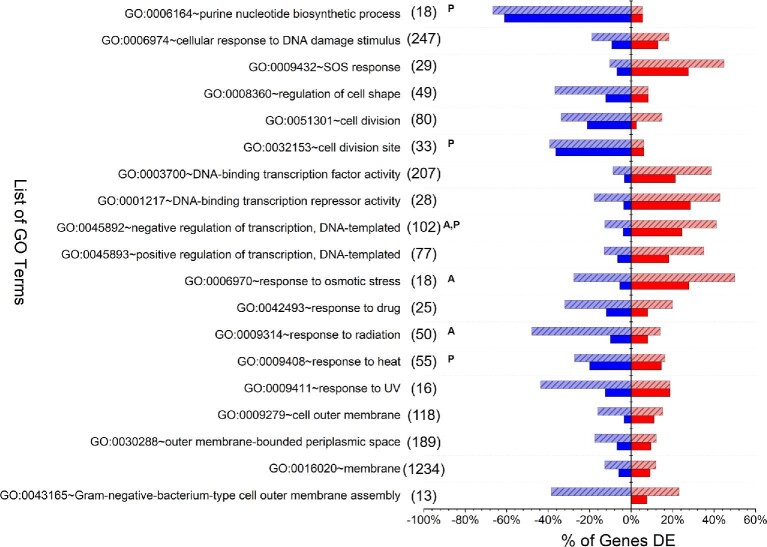
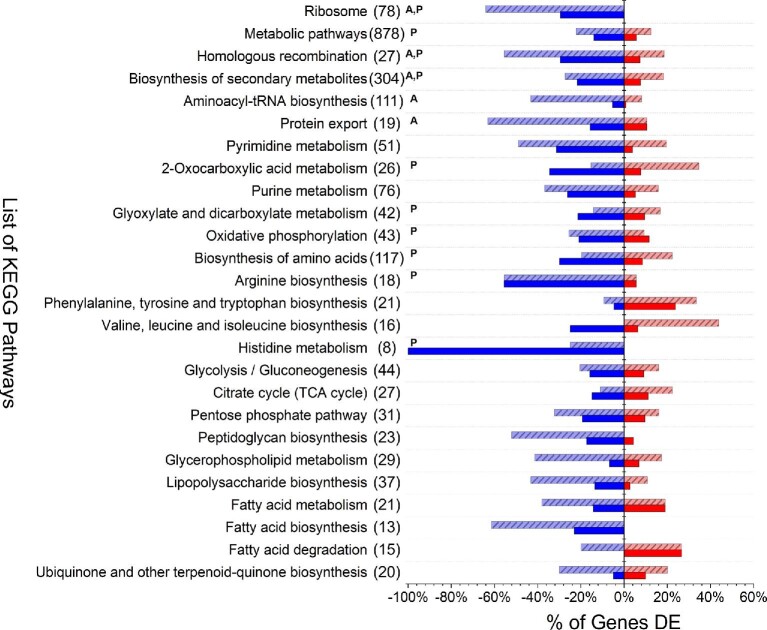
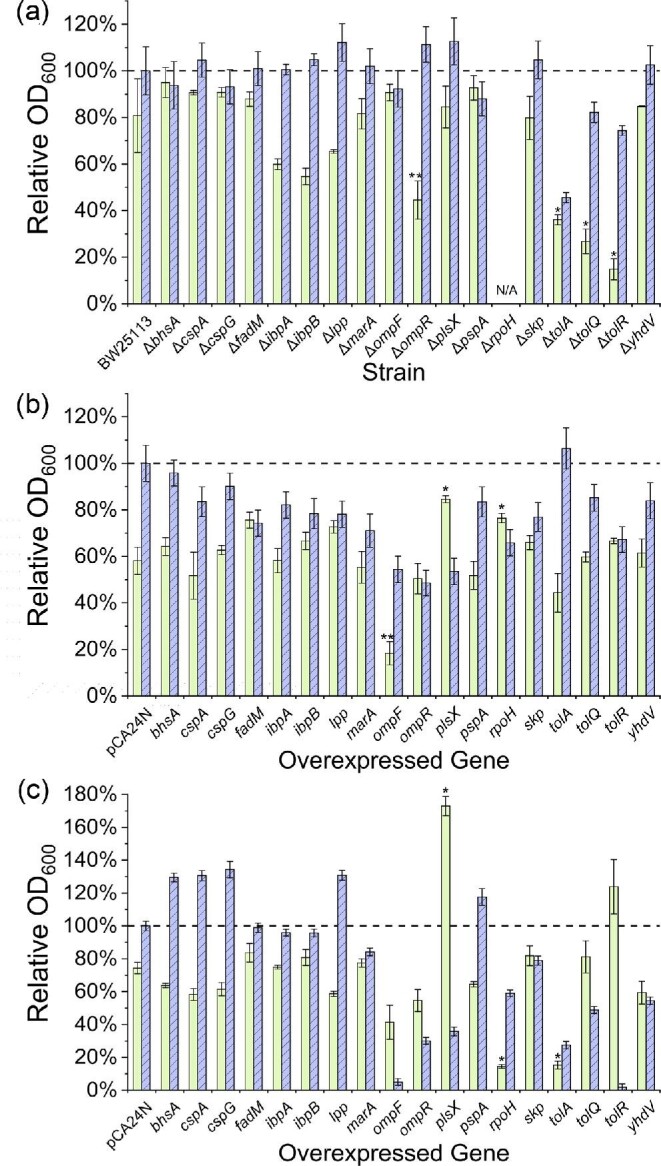
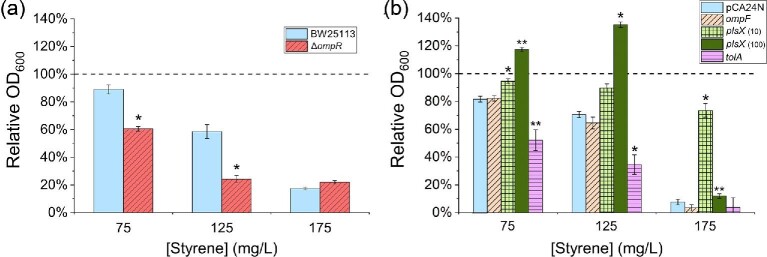
The global transcriptional response of Escherichia coli to styrene and potential influence of exposure source was determined by performing RNA sequencing (RNA-seq) analysis on both styrene-producing and styrene-exposed cells. In both cases, styrene exposure appears to cause both cell envelope and DNA damage, to which cells respond by down-regulating key genes/pathways involved in DNA replication, protein production, and cell wall biogenesis. Among the most significantly up-regulated genes were those involved with phage shock protein response (e.g. pspABCDE/G), general stress regulators (e.g. marA, rpoH), and membrane-altering genes (notably, bhsA, ompR, ldtC), whereas efflux transporters were, surprisingly, unaffected. Subsequent studies with styrene addition demonstrate how strains lacking ompR [involved in controlling outer membrane (OM) composition/osmoregulation] or any of tolQ, tolA, or tolR (involved in OM constriction) each displayed over 40% reduced growth relative to wild-type. Conversely, despite reducing basal fitness, overexpression of plsX (involved in phospholipid biosynthesis) led to 70% greater growth when styrene exposed. These collective differences point to the likely importance of OM properties in controlling native styrene tolerance. Overall, the collective behaviours suggest that, regardless of source, prolonged exposure to inhibitory styrene levels causes cells to shift from'growth mode' to 'survival mode', redistributing cellular resources to fuel native tolerance mechanisms.
Keywords: RNA sequencing; Styrene; Toxicity.
© The Author(s) 2021. Published by Oxford University Press on behalf of Society of Industrial Microbiology and Biotechnology.
Figures
Similar articles
-
Identification and characterization of the tolQRA genes of Pseudomonas aeruginosa.J Bacteriol. 1996 Dec;178(24):7059-68. doi: 10.1128/jb.178.24.7059-7068.1996. J Bacteriol. 1996. PMID: 8955385 Free PMC article.
-
Role of TolR N-terminal, central, and C-terminal domains in dimerization and interaction with TolA and tolQ.J Bacteriol. 1999 Aug;181(15):4476-84. doi: 10.1128/JB.181.15.4476-4484.1999. J Bacteriol. 1999. PMID: 10419942 Free PMC article.
-
Protein complex within Escherichia coli inner membrane. TolA N-terminal domain interacts with TolQ and TolR proteins.J Biol Chem. 1995 May 12;270(19):11078-84. doi: 10.1074/jbc.270.19.11078. J Biol Chem. 1995. PMID: 7744737
-
Recruitment of the TolA Protein to Cell Constriction Sites in Escherichia coli via Three Separate Mechanisms, and a Critical Role for FtsWI Activity in Recruitment of both TolA and TolQ.J Bacteriol. 2022 Jan 18;204(1):e0046421. doi: 10.1128/JB.00464-21. Epub 2021 Nov 8. J Bacteriol. 2022. PMID: 34748387 Free PMC article.
-
Energetics of colicin import revealed by genetic cross-complementation between the Tol and Ton systems.Biochem Soc Trans. 2012 Dec 1;40(6):1480-5. doi: 10.1042/BST20120181. Biochem Soc Trans. 2012. PMID: 23176502 Review.
Cited by
-
Predicting the effects of cultivation condition on gene regulation in Escherichia coli by using deep learning.Comput Struct Biotechnol J. 2023 Apr 13;21:2613-2620. doi: 10.1016/j.csbj.2023.04.010. eCollection 2023. Comput Struct Biotechnol J. 2023. PMID: 38213890 Free PMC article.
-
Insights into the susceptibility of Pseudomonas putida to industrially relevant aromatic hydrocarbons that it can synthesize from sugars.Microb Cell Fact. 2023 Feb 2;22(1):22. doi: 10.1186/s12934-023-02028-y. Microb Cell Fact. 2023. PMID: 36732770 Free PMC article.
-
Use of Transposon Directed Insertion-Site Sequencing to Probe the Antibacterial Mechanism of a Model Honey on E. coli K-12.Front Microbiol. 2022 Jan 17;12:803307. doi: 10.3389/fmicb.2021.803307. eCollection 2021. Front Microbiol. 2022. PMID: 35111142 Free PMC article.
References
-
- Alekshun M. N., Levy S. B. (1999). The mar regulon: Multiple resistance to antibiotics and other toxic chemicals. Trends in Microbiology, 7, 410–413. - PubMed
-
- Alsaker K. V., Paredes C., Papoutsakis E. T. (2010). Metabolite stress and tolerance in the production of biofuels and chemicals: Gene-expression-based systems analysis of butanol, butyrate, and acetate stresses in the anaerobe Clostridium acetobutylicum. Biotechnology and Bioengineering, 105, 1131–1147. 10.1002/bit.22628. - DOI - PubMed
MeSH terms
Substances
LinkOut - more resources
Full Text Sources
Other Literature Sources
Molecular Biology Databases
