. 2021 Apr;141(4):547-564.
doi: 10.1007/s00401-021-02288-1. Epub 2021 Feb 28.

Heterogeneity in α-synuclein fibril activity correlates to disease phenotypes in Lewy body dementia

Affiliations

Heterogeneity in α-synuclein fibril activity correlates to disease phenotypes in Lewy body dementia

Arpine Sokratian et al. Acta Neuropathol. 2021 Apr.

Abstract

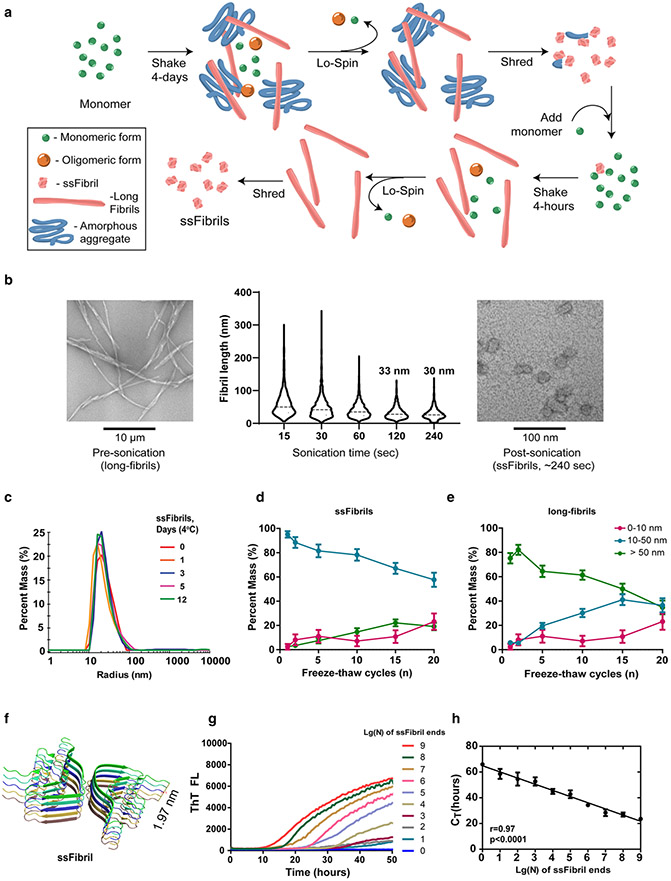
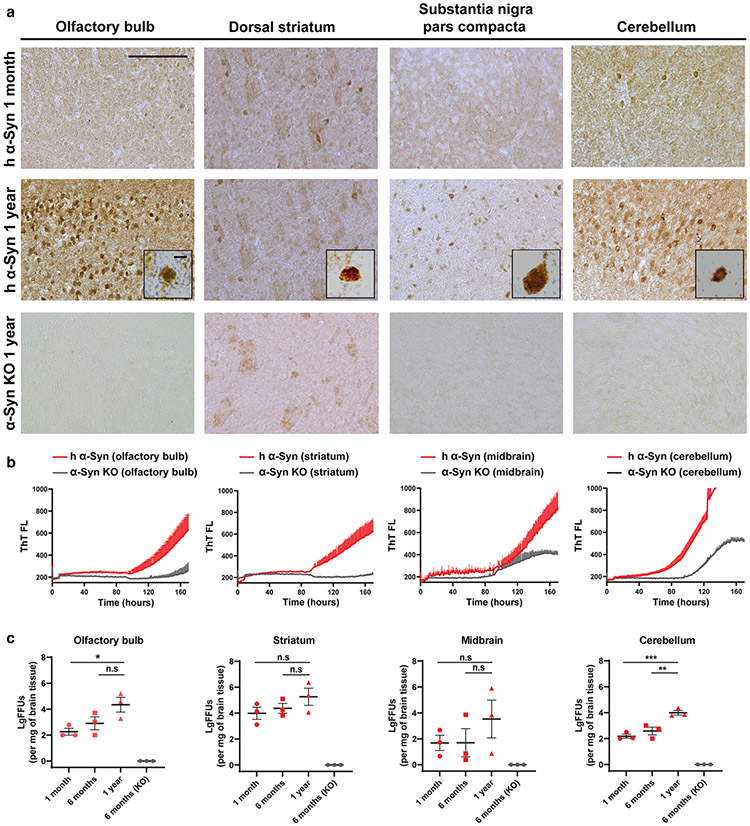
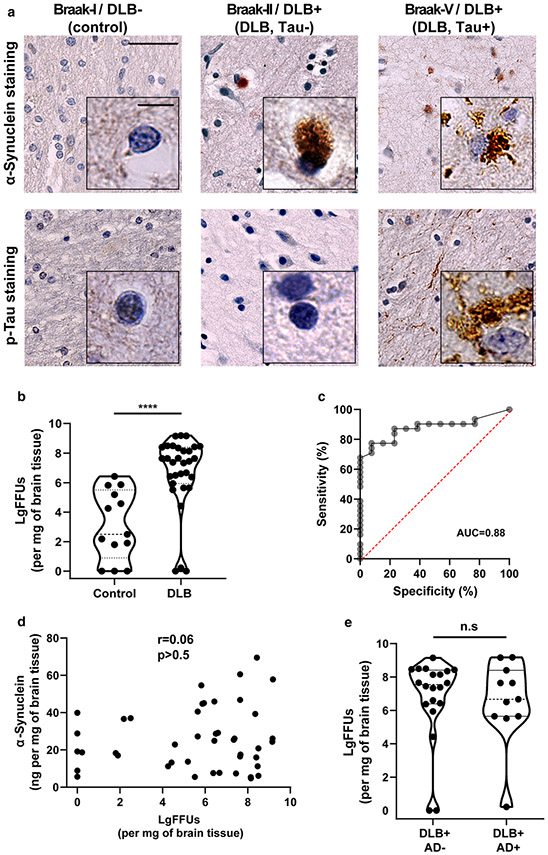
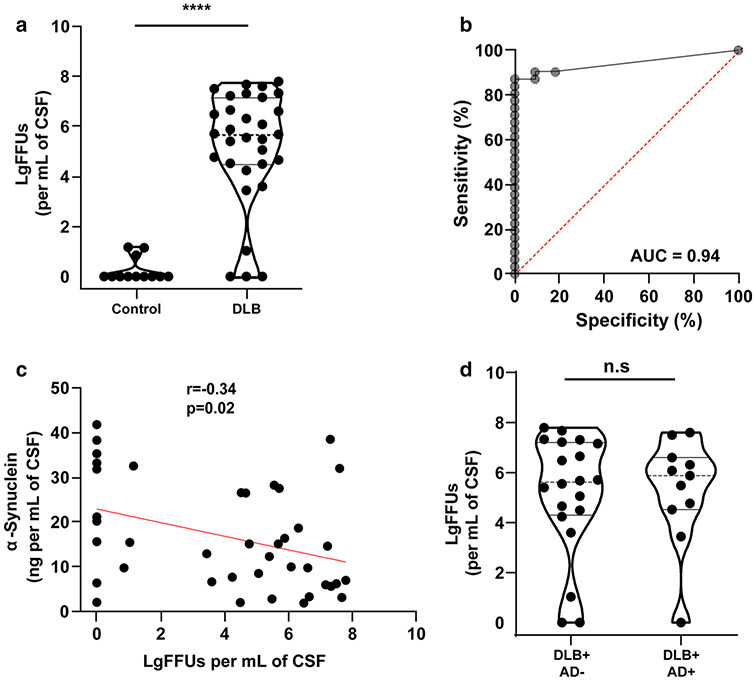
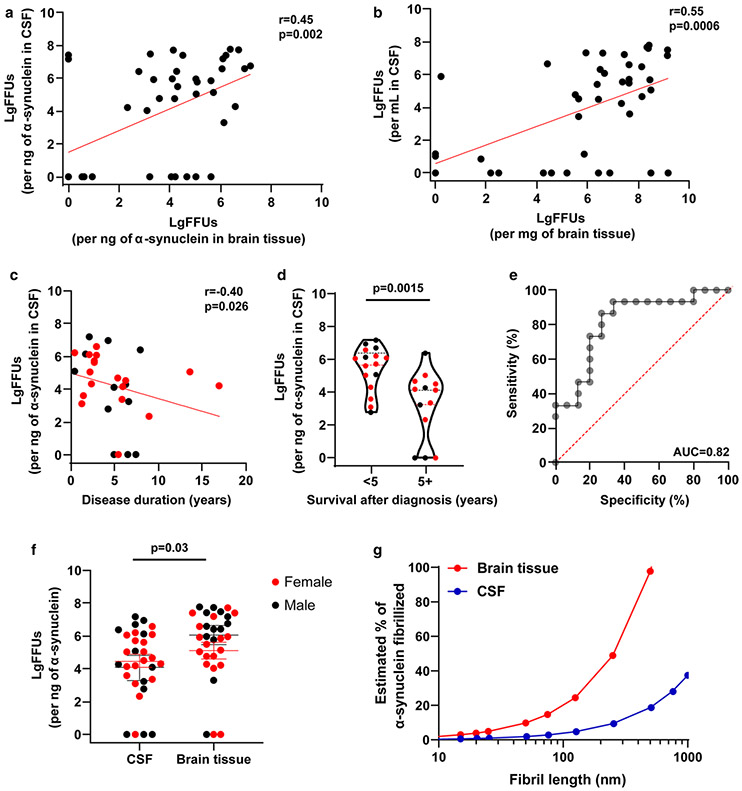
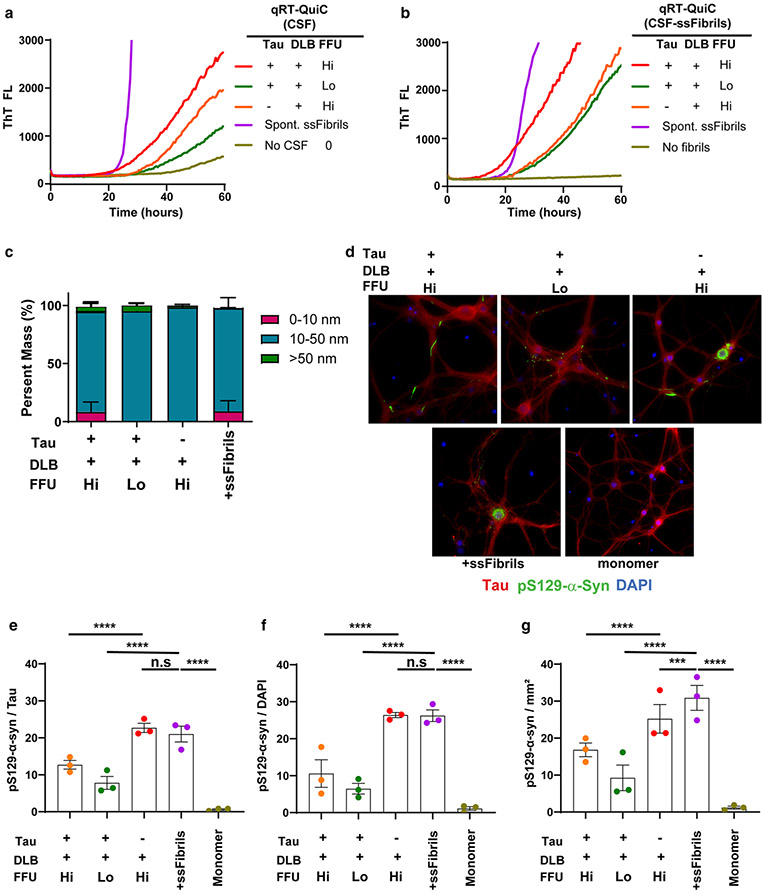
α-Synuclein aggregation underlies pathological changes in Lewy body dementia. Recent studies highlight structural variabilities associated with α-synuclein aggregates in patient populations. Here, we develop a quantitative real-time quaking-induced conversion (qRT-QuIC) assay to measure permissive α-synuclein fibril-templating activity in tissues and cerebrospinal fluid (CSF). The assay is anchored through reference panels of stabilized ultra-short fibril particles. In humanized α-synuclein transgenic mice, qRT-QuIC identifies differential levels of fibril activity across the brain months before the deposition of phosphorylated α-synuclein in susceptible neurons. α-Synuclein fibril activity in cortical brain extracts from dementia with Lewy bodies (DLB) correlates with activity in matched ventricular CSF. Elevated α-synuclein fibril activity in CSF corresponds to reduced survival in DLB. α-Synuclein fibril particles amplified from cases with high fibril activity show superior templating in the formation of new inclusions in neurons relative to the same number of fibril particles amplified from DLB cases with low fibril activity. Our results highlight a previously unknown broad heterogeneity of fibril-templating activities in DLB that may contribute to disease phenotypes. We predict that quantitative assessments of fibril activities in CSF that correlate to fibril activities in brain tissue will help stratify patient populations as well as measure therapeutic responses to facilitate the development of α-synuclein-targeted therapeutics.

Keywords: Aggregation; Biomarker; Neurodegeneration; Parkinson’s disease; Prion; SNCA.


Figures

Fig. 1
Fig. 1
Single-molecule quantification of temperature and time-stable ssFibrils with quantitative RT-QuIC (qRT-QuIC). a Schematic for the purification of short-stumpy α-synuclein fibrils (ssFibrils). A long initial shaking round in saline (pH 7.4) results in an admixture of long α-synuclein rod fibrils, amorphous aggregates, oligomers, and unpolymerized monomer. Heavy insoluble fibrils and aggregates are separated from unpolymerized proteins and small oligomers through brief low-speed centrifugation. Pelleted heavy particles are then subjected to strong-sonication (otherwise known as shredding). The shredded aggregates are diluted (0.1% w/v) into a secondary rapid fibril elongation reaction. Isolation, washing, and sonication of these heavy fibril products results in the generation of enriched short-stumpy fibrils, or ssFibrils. b Representative transmission electron microscopy images and analysis of (n > 1000 particles measured over three experiments) human α-synuclein full-length fibrils, and processed ssFibrils. c Dynamic light-scattering size distributions of ssFibrils after extended incubations in saline buffer at 4 °C. d Light-scattering measures of ssFibrils after extensive repetitive freeze thaw cycles. e Light-scattering measures of long α-synuclein rod fibrils subjected to the same repetitive freeze thaw cycling. f Rendered stack representations of α-synuclein monomers (n = 10 monomers shown) from rod fibrils formed from spontaneous α-synuclein fibrillization, as described [30]. g Representative real-time quaking-induced conversion shown as decadic logarithmic performance over known quantities of ssFibrils. Calculated fibril-forming units (FFUs) are indicated, with the assumption of two-fibril-forming ends/particle. Lg(0) indicates reactions with no ssFibrils added, indicating spontaneous fibrillization. h Optimal log-linear regression analysis based on calculated CT values from triplicate reactions (see Supplemental Fig. 2). Error bars represent SEM, dots indicate mean group values from at least three independent experiments, and each Lg(N) curve shown represents the calculated average of at least three independent experiments
Fig. 2
Fig. 2
Early soluble fibril-forming activity in humanized WT-α-synuclein mouse brain that precedes pS129-α-synuclein deposition. a Representative immunostained coronal brain sections of phospho-α-synuclein (pS129, depicted with brown coloration) in the olfactory bulb, dorsal striatum, substantia nigra pars compacta, or cerebellum, of 1 month-old, or 1 year-old, mice that express only human α-synuclein, ~ fourfold (whole-brain) over the levels of α-synuclein in non-transgenic mice (Supplemental Fig. 3). pS129-α-synuclein staining conditions were selected based on a lack of signal under the same processing conditions in α-synuclein knock-out (KO) animals, and as previously described [13]. High magnification insets show typical perinuclear accumulations of pS129-α-synuclein reactivity. Scale bars show 0.5 mM and 5 μM in the insets. b Representative human α-synuclein permissive templating activity in qRT-QuIC reactions from brain extracts of olfactory bulb, striatum, midbrain, and cerebellum, from 1-year-old humanized α-synuclein mice or α-synuclein KO mice. Each curve shown represents the average of three qRT-QuIC reactions from three mice performed in triplicate. Males and female mice are equally represented. c LgFFUs per mg of brain tissue were calculated from triton X-100-solubilized fractions of freshly procured tissue from the olfactory bulb, striatum, midbrain and cerebellum of 1-year, 6-month and 1 month-old WT-hPAC-α-synuclein/m-α-synuclein KO mice. Each group column represents mean values from the analysis of n = 3 mice/group, with each data point indicating the mean calculated FFU value extrapolated from CT values derived from reference standards of ssFibrils spiked into corresponding triton-solubilized homogenates from α-synuclein KO mice. Analysis was performed with one-way ANOVA and Holm–Sidak’s multiple comparison test, 1 year-old values compared to the indicated groups, where n.s. is not significant, *p < 0.05, **p < 0.01, ***p < 0.001
Fig. 3
Fig. 3
qRT-QuIC analysis of neocortical tissue from DLB, with or without concomitant AD pathology. a Representative immunostained neocortical brain sections for α-synuclein or phospho-tau (AT8) from neuropathologically normal controls (AD−/PD−/DLB−), or cases with a diagnosis of DLB (neocortical-dominant subtype), without AD pathology, or with concomitant neocortical tau and amyloid (tau + [Braak IV–VI]/DLB+,). b Quantification of log-fibril-forming units (LgFFUs) per mg of brain tissue measured in triton X-100 solubilized neocortical brain homogenates from frozen tissue of subjects diagnosed with neocortical-dominant DLB and normal controls, with spike-in standards of reference ssFibrils spiked into human brain control homogenates negative for detectable FFUs. c Receiver operating curves (ROC) for group discrimination between DLB (all subjects, Extended Table 1) and controls, with percent of sensitivity and specificity for LgFFUs (per mg of brain tissue) at 87 and 77, respectively. d Correlation analysis of α-synuclein concentration and LgFFUs per mg of brain tissue. Spearman coefficients and corresponding p values are indicated. e Violin plots representing distributions of LgFFUs per mg of brain tissue relative to AD neuropathology. Group comparison analysis for panel b and e uses two-way unpaired t tests, where n.s. is not significant and ****p < 0.0001. Each data point represents the mean value calculated from at least three independent experiments (i.e., qRT-QuiC runs)
Fig. 4
Fig. 4
qRT-QuIC analysis of CSF from DLB. a Quantification of fibril-forming units (FFUs) per mL in brain-matched CSF from subjects with a pathological diagnosis of neocortical DLB (Table 1) and normal controls, with spike-in standards of ssFibrils into CSF that was previously identified as negative for fibril activity. b ROC group discrimination for assessing qRT-QuIC accuracy in resolving a pathological diagnosis of DLB from controls. Percent sensitivity and specificity are 87 and 100. c Correlation analysis of total α-synuclein concentration and LgFFUs per mL in CSF. Spearman coefficients and corresponding p values are indicated. d Violin plots representing distributions of LgFFUs (calculated per mL of CSF) to AD neuropathology. Spearman coefficients and corresponding p values are indicated. Comparison analysis for panel a and d uses a two-tailed unpaired t test, where n.s. is not significant and ****p < 0.0001. Each data point represents the mean value calculated from at least three independent experiments
Fig. 5
Fig. 5
High concentrations of fibril activity in CSF correlates with reduced survival. a Correlation in log-fibril-forming units (LgFFUs) between CSF and brain tissue, normalized to nanograms of α-synuclein or b per mL of CSF and per mg of brain tissue. c Scatter plot between LgFFUs found in CSF and years of survival after a diagnosis of dementia, with sex separated by color (male = black, female = red). d Group analysis of study subjects with early mortality (< 5 years) or later mortality (> 5 years) after a diagnosis of dementia, with sex separated by color (male = black, female = red). e ROC assessment for survival in DLB with the area-under the curve (AUC) shown corresponding to a sensitivity of 87 and specificity at 73. f Comparison of LgFFUs per ng of α-synuclein in CSF and per ng of α-synuclein in brain tissue, with sex separated by color (male = black, female = red). All correlation values are spearman coefficients with corresponding p values. Group comparison analyses include two-tailed unpaired t tests for total number of cases, as well as ordinary two-way ANOVA with Sidak’s multiple comparison test for the evaluation of sex as a covariable (see “Results” section). Each data point represents the mean value calculated from at least three independent experiments. g Hypothetical relationship between the average size of fibrils to the minimum percent of α-synuclein constrained into template-permissive fibrils. Estimates are based on the observed (mean) amount of total α-synuclein found in brain tissue or CSF in this study. Thus, each data point represents an average number of FFUs at any given average length of fibril, assuming a normal distribution of fibril lengths in solution
Fig. 6
Fig. 6
Seeding characteristics of DLB-amplified strains. a Representative quantitative (qRT-QuIC) analysis of three CSF samples from DLB cases categorized (as in Fig. 4) with the highest concentrations of FFUs (Hi, LgFFUs > 6/mL), or lower concentrations (Lo, LgFFUs < 4/mL). Samples pathologically evaluated as Braak stage > 3 are marked as Tau “+”; samples with Braak stage < 3 shown are marked as Tau “−”. Also shown are representative results from a spike-in concentration (6.5 pM) of spontaneously generated ssFibrils (labeled “Spont. ssFibrils”). b Equivalent concentrations (6.5 pM) of ssFibrils purified from reaction products from panel a, derivative from plateaued (thioflavin-T) reactions, were added into a second qRT-QuIC reaction for fibril elongation templating. Representative thioflavin-T fluorescence curves with or without (labeled “No fibrils”) added into reactions are given. c Representative fluorescent images of pS129-α-synuclein staining in primary hippocampal neuronal cultures cultured from humanized α-synuclein mice, 10-days (DIV17) after ssFibril addition. d 0.65 nM ssFibrils particles or monomer control, 70 nM, were added at DIV7. Red color indicates tau staining, green color indicates pS129-α-synuclein staining, and blue color indicates DAPI. e Group analysis of pS129-α-synuclein occupancy normalized to percent of tau occupancy in images, or f pS129-α-synuclein occupancy normalized to the number of distinct DAPI spots (i.e., nuclei), or g pS129-α-synuclein occupancy normalized to mM2 area of the culture wells. Every data point represents the mean of signal curated from an individual litter (two well replicates for each litter) of humanized α-synuclein mice. Raw data for each image processed is presented in Supplemental Fig. 8. Significance is assessed by ordinary two-way ANOVA with Dunnett’s multiple comparison post-hoc test (all groups compared to ssFibrils), and p values are indicated in panels f, g and h, where n.s. is not significant, ***p < 0.001, ****p < 0.0001
Fig. 7
Fig. 7
Model for α-synuclein fibril heterogeneity associated with survival in Lewy body dementia. Fibril activity is highest in DLB cerebrospinal fluid in cases with low survival rates subsequent to a diagnosis of dementia. Specific levels of neocortical fibril activities in the brain spill over to activities in CSF. However, in controls without disease, low fibril activity was detected in brain tissue but not in CSF. This model implies that the presence of fibrils alone in brain tissue, without ongoing disease processes (e.g., neurodegeneration), is not enough to release fibrils through to CSF. Equimolar application of α-synuclein amplified strains to neurons demonstrates potent templating activity in fibrils amplified from the CSF of individuals with high fibril activity (and low survival in disease) compared to poor templating activity in fibrils amplified from individuals with low fibril activity

Similar articles

Cited by

References

    1. Abdelmotilib H, Maltbie T, Delic V, Liu Z, Hu X, Fraser KB et al. (2017) α-Synuclein fibril-induced inclusion spread in rats and mice correlates with dopaminergic neurodegeneration. Neurobiol Dis 105:84–98. 10.1016/j.nbd.2017.05.014 - DOI - PMC - PubMed
    1. Bousset L, Pieri L, Ruiz-Arlandis G, Gath J, Jensen PH, Habenstein B et al. (2013) Structural and functional characterization of two alpha-synuclein strains. Nat Commun 4:2575. 10.1038/ncomms3575 - DOI - PMC - PubMed
    1. Brás IC, Dominguez-Meijide A, Gerhardt E, Koss D, Lázaro DF, Santos PI et al. (2020) Synucleinopathies: where we are and where we need to go. J Neurochem 153:433–454. 10.1111/jnc.14965 - DOI - PubMed
    1. Buehler MJ (2006) Nature designs tough collagen: explaining the nanostructure of collagen fibrils. Proc Natl Acad Sci USA 103:12285–12290. 10.1073/pnas.0603216103 - DOI - PMC - PubMed
    1. Buell AK (2019) The growth of amyloid fibrils: rates and mechanisms. Biochem J 476:2677–2703. 10.1042/bcj20160868 - DOI - PubMed

Publication types

Substances