

Change and predictive ability of circulating immunoregulatory lymphocytes in long-term outcomes of acute ischemic stroke
- PMID: 33641517
- PMCID: PMC8393304
- DOI: 10.1177/0271678X21995694
Change and predictive ability of circulating immunoregulatory lymphocytes in long-term outcomes of acute ischemic stroke
Abstract
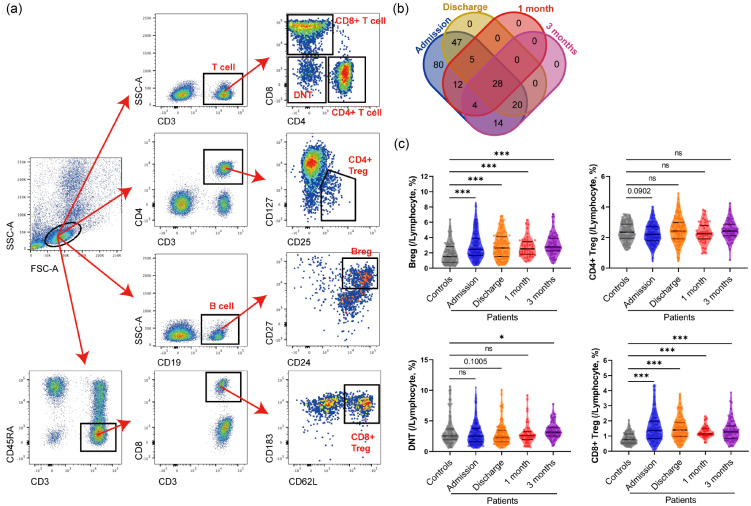
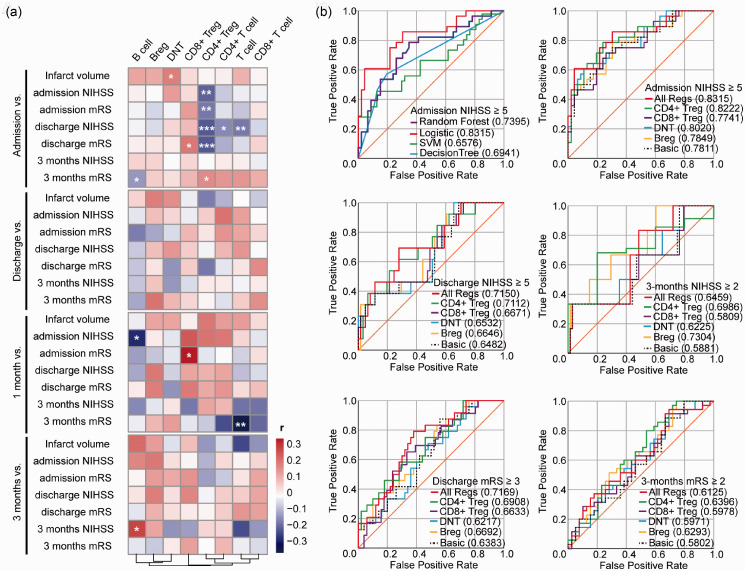
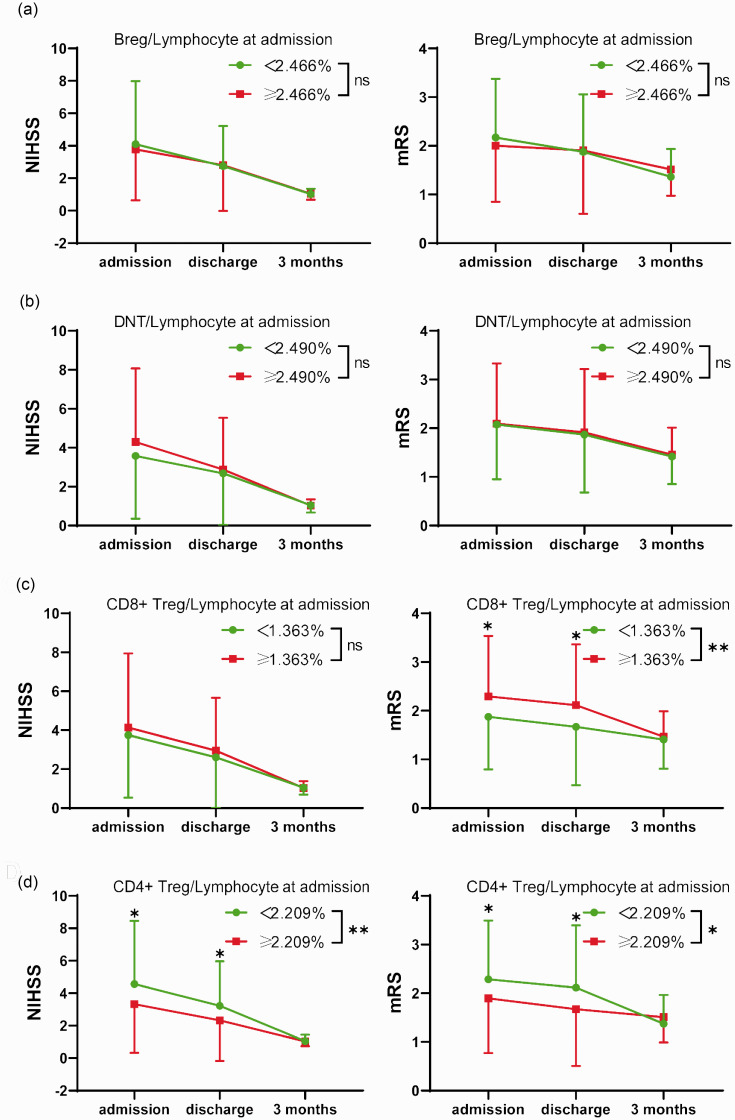
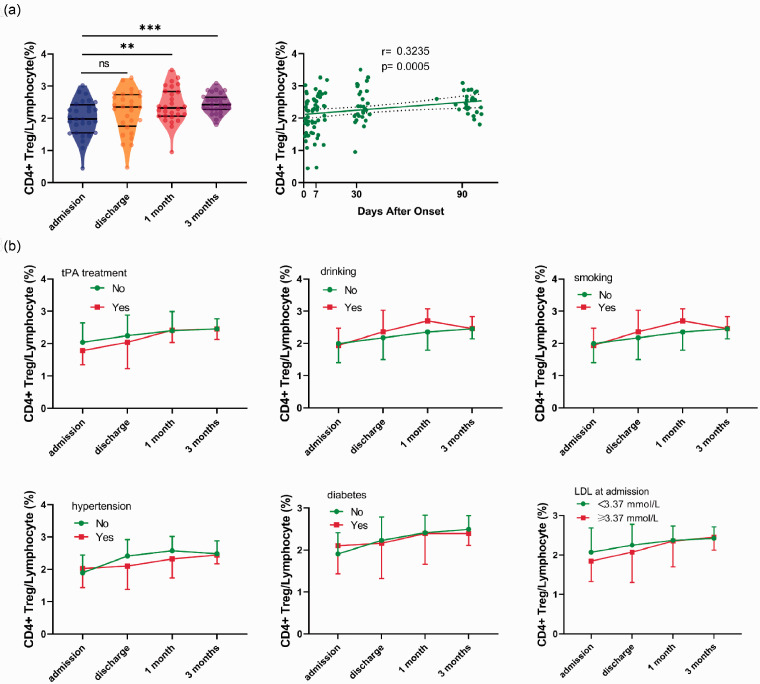
Lymphocytes play an important role in the immune response after stroke. However, our knowledge of the circulating lymphocytes in ischemic stroke is limited. Herein, we collected the blood samples of clinical ischemic stroke patients to detect the change of lymphocytes from admission to 3 months after ischemic stroke by flow cytometry. A total of 87 healthy controls and 210 patients were enrolled, and the percentages of circulating T cells, CD4+ T cells, CD8+ T cells, double negative T cells (DNTs), CD4+ regulatory T cells (Tregs), CD8+ Tregs, B cells and regulatory B cells (Bregs) were measured. Among patients, B cells, Bregs and CD8+ Tregs increased significantly, while CD4+ Tregs dropped and soon reversed after ischemic stroke. CD4+ Tregs, CD8+ Tregs, and DNTs also showed high correlations with the infarct volume and neurological scores of patients. Moreover, these lymphocytes enhanced the predictive ability of long-term prognosis of neurological scores when added to basic clinical information. The percentage of CD4+ Tregs within lymphocytes showed high correlations with both acute and long-term neurological outcomes, which exhibited a great independent predictive ability. These findings suggest that CD4+ Tregs can be a biomarker to predict stroke outcomes and improve existing therapeutic strategies of immunoregulatory lymphocytes.
Keywords: Circulating lymphocytes; flow cytometry; ischemic stroke; regulatory B cells; regulatory T cells.
Conflict of interest statement
Figures
Similar articles
-
The value of circulating lymphocytic subpopulations in the diagnosis and repair of ischemic stroke patients with dizziness.Front Aging Neurosci. 2022 Nov 3;14:1042123. doi: 10.3389/fnagi.2022.1042123. eCollection 2022. Front Aging Neurosci. 2022. PMID: 36408111 Free PMC article.
-
The combination of CC chemokine receptor type 5(CCR5) and Treg cells predicts prognosis in patients with ischemic stroke.J Neuroimmunol. 2020 Dec 15;349:577404. doi: 10.1016/j.jneuroim.2020.577404. Epub 2020 Sep 24. J Neuroimmunol. 2020. PMID: 33068971
-
[Peripheral T and B lymphocytes in patients with occupational medicamentosa-like dermatitis due to trichloroethylene].Zhonghua Lao Dong Wei Sheng Zhi Ye Bing Za Zhi. 2020 Oct 20;38(10):731-735. doi: 10.3760/cma.j.cn121094-20200407-00172. Zhonghua Lao Dong Wei Sheng Zhi Ye Bing Za Zhi. 2020. PMID: 33142373 Chinese.
-
Diverse functions and mechanisms of regulatory T cell in ischemic stroke.Exp Neurol. 2021 Sep;343:113782. doi: 10.1016/j.expneurol.2021.113782. Epub 2021 Jun 8. Exp Neurol. 2021. PMID: 34116055 Review.
-
Regulatory T cells in ischemic stroke.CNS Neurosci Ther. 2021 Jun;27(6):643-651. doi: 10.1111/cns.13611. Epub 2021 Jan 20. CNS Neurosci Ther. 2021. PMID: 33470530 Free PMC article. Review.
Cited by
-
Peripheral blood CD19 positive B lymphocytes increase after ischemic stroke and correlate with carotid atherosclerosis.Front Neurol. 2023 Dec 29;14:1308041. doi: 10.3389/fneur.2023.1308041. eCollection 2023. Front Neurol. 2023. PMID: 38221996 Free PMC article.
-
Correlation of Peripheral Blood Inflammatory Indicators to Prognosis After Intravenous Thrombolysis in Acute Ischemic Stroke: A Retrospective Study.Int J Gen Med. 2024 Mar 15;17:985-996. doi: 10.2147/IJGM.S456144. eCollection 2024. Int J Gen Med. 2024. PMID: 38505143 Free PMC article.
-
Updates of the role of B-cells in ischemic stroke.Front Cell Neurosci. 2024 Mar 14;18:1340756. doi: 10.3389/fncel.2024.1340756. eCollection 2024. Front Cell Neurosci. 2024. PMID: 38550918 Free PMC article. Review.
-
Postoperative neutrophil-to-lymphocyte ratio predicts malignant cerebral edema following endovascular treatment for acute ischemic stroke.Front Neurol. 2024 Jun 27;15:1394550. doi: 10.3389/fneur.2024.1394550. eCollection 2024. Front Neurol. 2024. PMID: 38994493 Free PMC article.
-
Monocyte to high-density lipoprotein ratio predicts clinical outcomes after acute ischemic stroke or transient ischemic attack.CNS Neurosci Ther. 2023 Jul;29(7):1953-1964. doi: 10.1111/cns.14152. Epub 2023 Mar 13. CNS Neurosci Ther. 2023. PMID: 36914580 Free PMC article.
References
-
- Donnan GA, Fisher M, Macleod M, et al.. Stroke. Lancet 2008; 371: 1612–1623. - PubMed
-
- Hacke W, Kaste M, Bluhmki E, et al.. Thrombolysis with alteplase 3 to 4.5 hours after acute ischemic stroke. N Engl J Med 2008; 359: 1317–1329. - PubMed
-
- Lo EH, Dalkara T, Moskowitz MA.Mechanisms, challenges and opportunities in stroke. Nat Rev Neurosci 2003; 4: 399–415. - PubMed
Publication types
MeSH terms
LinkOut - more resources
Full Text Sources
Other Literature Sources
Medical
Research Materials
