. 2021 Feb 11:12:576382.
doi: 10.3389/fneur.2021.576382. eCollection 2021.

Potential Molecular Mechanism of TNF Superfamily-Related Genes in Glioblastoma Multiforme Based on Transcriptome and Epigenome

Affiliations

Potential Molecular Mechanism of TNF Superfamily-Related Genes in Glioblastoma Multiforme Based on Transcriptome and Epigenome

Hui Xie et al. Front Neurol. .

Abstract

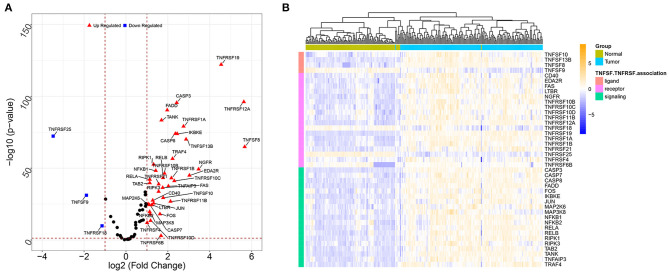
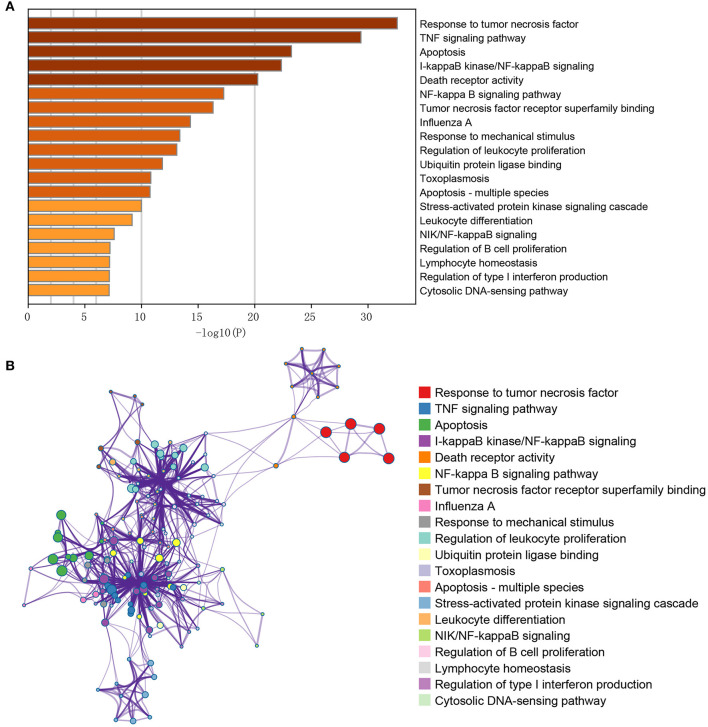
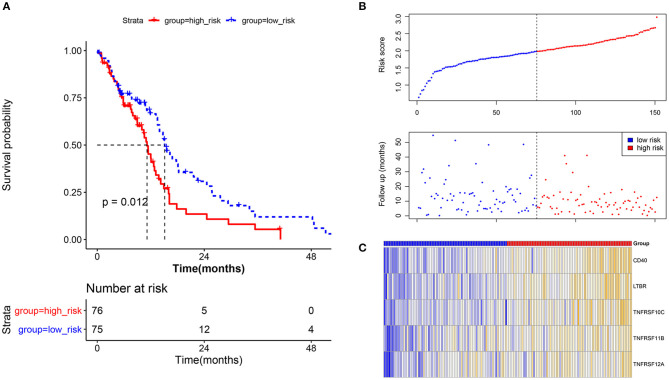
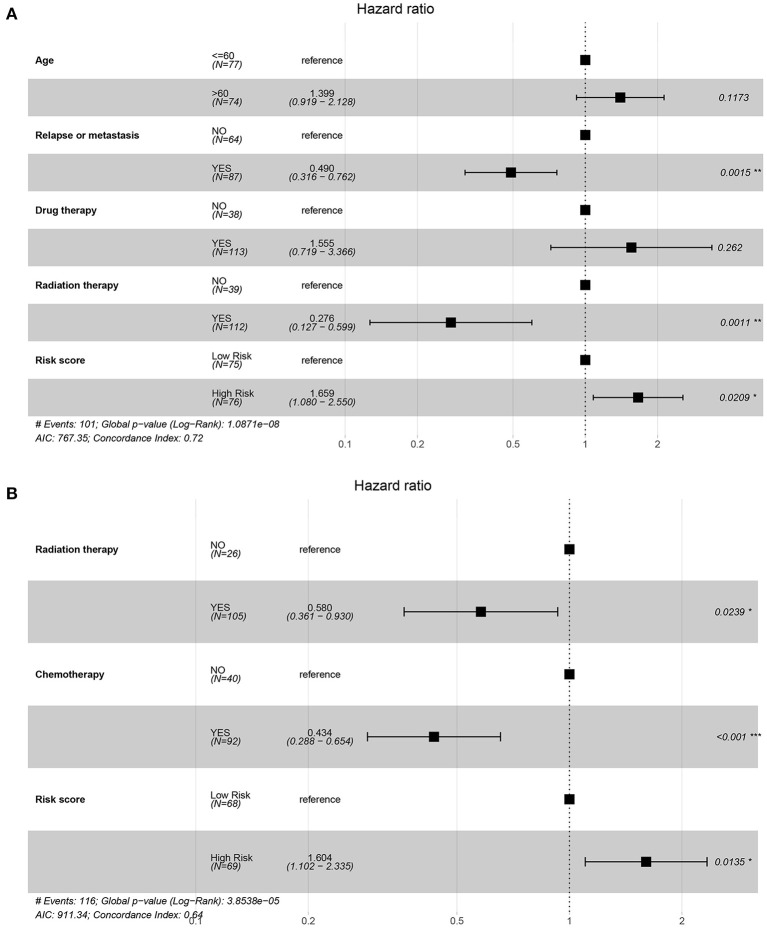
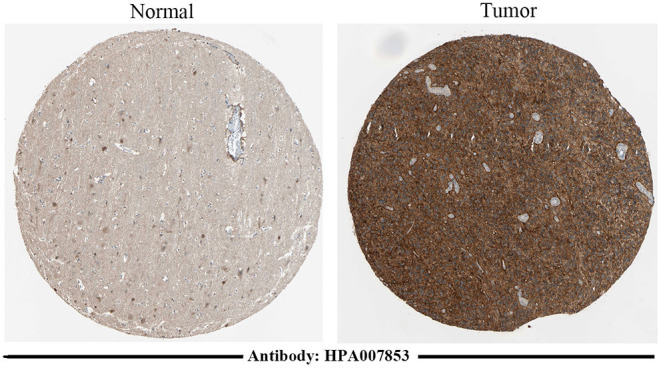
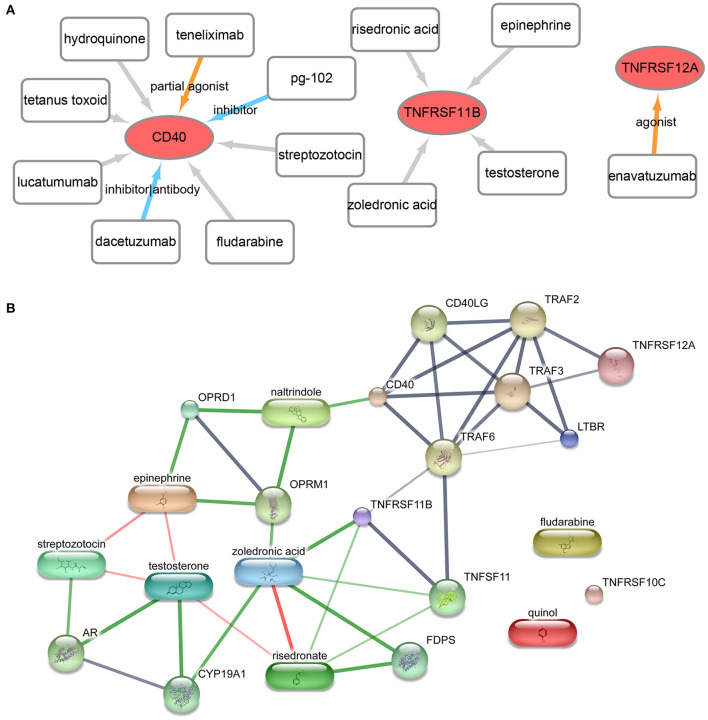
Objective: This study aimed to investigate the molecular mechanism of tumor necrosis factor (TNF) superfamily-related genes and potential therapeutic drugs for glioblastoma multiforme (GBM) patients based on transcriptome and epigenome. Methods: Gene expression data, corresponding clinical data, and methylation data of GBM samples and normal samples in the TCGA-GBM and GTEx datasets were downloaded. The TNF-related genes were obtained, respectively, from two groups in the TCGA dataset. Then, the TNF-related differentially expressed genes (DEGs) were investigated between two groups, followed by enrichment analysis. Moreover, TNF superfamily-related gene expression and upstream methylation regulation were investigated to explore candidate genes and the prognostic model. Finally, the protein expression level of candidate genes was performed, followed by drug prediction analysis. Results: A total of 41 DEGs including 4 ligands, 18 receptors, and 19 downstream signaling molecules were revealed between two groups. These DEGs were mainly enriched in pathways like TNF signaling and functions like response to TNF. A total of 5 methylation site-regulated prognosis-related genes including TNF Receptor Superfamily Member (TNFRSF) 12A, TNFRSF11B, and CD40 were explored. The prognosis model constructed by 5 genes showed a well-prediction effect on the current dataset and verification dataset. Finally, drug prediction analysis showed that zoledronic acid (ZA)-TNFRSF11B was the unique drug-gene relation in both two databases. Conclusion: Methylation-driven gene TNFRSF12A might participate in the development of GBM via response to the TNF biological process and TNF signaling pathway and significantly associated with prognosis. ZA that targets TNFRSF11B expression might be a potential effective drug for clinical treatment of GBM.

Keywords: DNA methylation; differentially expressed genes; glioblastoma multiforme; survival analysis; tumor necrosis factor superfamily genes.


Conflict of interest statement

The authors declare that the research was conducted in the absence of any commercial or financial relationships that could be construed as a potential conflict of interest.

Figures

Figure 1
Figure 1
The volcano plots and heat map for DEGs between the tumor sample and normal sample. (A) The volcano plots of DEGs; the X-axis represents the value of log2 fold change, while the Y-axis represents the value of –log10; red triangles represent the upregulated genes, blue squares represent the downregulated genes, and black nodes represent genes with no significant difference. (B) The heat map for DEGs; colors from blue to yellow indicated low to high representation values. The colored blocks at the top represent samples, of which brilliant blue represents tumor samples and pea green represents normal samples; the colored blocks at the left represent DEGs.
Figure 2
Figure 2
GO/KEGG pathway enrichment cluster interaction analysis of the differentially expressed genes. (A) The X-axis represents the gene ratio (–log10); the Y-axis represents the different items of functions or pathways. (B) The interactive network among terms; different node colors indicated different clusters, and lines indicated gene similarities among terms.
Figure 3
Figure 3
Prognostic verification analysis for the current prognostic model based on tumor samples in the TCGA database. (A) Survival analysis for the high-risk group and low-risk group; survival time of the high-risk group was shorter than that of the low-risk group. The X-axis represents the overall survival time (month), while the Y-axis represents the survival rate (percent survival). P < 0.05 was considered to be significantly different. (B) The risk score and follow-up in the high-risk group and low-risk group. (C) The heat map for methylation site-regulated prognosis-related genes including CD40, LTBR, TNFRSF10C, TNFRSF11B, and TNFRSF12A.
Figure 4
Figure 4
Forest map of regression analysis based on the TCGA and CGGA datasets. (A) The forest plot for multivariate Cox regression of the TCGA dataset on factors including age, relapse or metastasis, drug therapy, radiation therapy, and risk score. (B) The forest plot for multivariate Cox regression of the CGGA dataset on factors including radiation therapy, chemotherapy, and risk score.
Figure 5
Figure 5
Immunohistochemical staining results of TNFRSF12A based on the HPA database. Immunohistochemical staining of TNFRSF12A in normal tissue [male, age 45; cerebral cortex (T-X2020), NOS (M-00100)] and in tumor tissue [male, age 47; brain (T-X2000) glioma, malignant, high grade (M-938033)].
Figure 6
Figure 6
Drug- gene interaction network. (A) The drug–gene interaction network from the DGIdb database. Red ellipses represent genes, and rectangles represent drugs; the lines represent drug–gene interactions, of which colored lines represent known interactions while gray lines represent unknown interactions. (B) The drug–gene–gene interaction network from the STITCH database. The block represents the drug, while the circle represents gene. Red lines represent the drug–drug interaction, and green lines represent drug–gene interactions, and gray lines represent gene–gene interaction.

Similar articles

Cited by

References

    1. Ostrom QT, Gittleman H, Farah P, Ondracek A, Chen Y, Wolinsky Y, et al. . CBTRUS statistical report: primary brain and central nervous system tumors diagnosed in the United states in 2006-2010. Neuro Oncol. (2012) 14 (Suppl. 5):v1. 10.1093/neuonc/not151 - DOI - PMC - PubMed
    1. Young RM, Jamshidi A, Davis G, Sherman JH. Current trends in the surgical management and treatment of adult glioblastoma. Ann Transl Med. (2015) 3:121. 10.3978/j.issn.2305-5839.2015.05.10 - DOI - PMC - PubMed
    1. Nam JY, de Groot JF. Treatment of glioblastoma. J Oncol Pract. (2017) 13:629 10.1200/JOP.2017.025536 - DOI - PubMed
    1. Gallego O. Nonsurgical treatment of recurrent glioblastoma. Curr Oncol. (2015) 22:e273 10.3747/co.22.2436 - DOI - PMC - PubMed
    1. Mao H, LeBrun DG, Yang J, Zhu VF, Li M. Deregulated signaling pathways in glioblastoma multiforme: molecular mechanisms and therapeutic targets. Cancer Invest. (2012) 30:48–56. 10.3109/07357907.2011.630050 - DOI - PMC - PubMed