. 2021 Feb 12:12:596002.
doi: 10.3389/fmicb.2021.596002. eCollection 2021.

Alteration of Gut Microbiota After Antibiotic Exposure in Finishing Swine

Affiliations

Alteration of Gut Microbiota After Antibiotic Exposure in Finishing Swine

Hee Eun Jo et al. Front Microbiol. .

Abstract

Subclinical doses of antimicrobials are commonly used in the swine industry to control infectious diseases and growth performance. Accumulating evidence suggests that swine administered with antibiotics are susceptible to disease development due to disruption of the beneficial gut microbial community, which is associated with host immune regulation, nutrient digestion, and colonization resistance against pathogens. In this study, we found that finishing swine administered with lincomycin showed gut dysbiosis and increased diarrhea incidence compared with control swine. 16S rRNA amplicon sequencing was used to analyze the gut microbiota in finishing swine administered with lincomycin. The relative abundance of detrimental microbes, such as species of Clostridium, Aerococcus, Escherichia-Shigella, and Corynebacterium was increased in the feces of lincomycin-administered finishing swine, but that of bacteria associated with fiber degradation, such as species of Treponema, Succinivibrio, Fibrobacter, and Cellulosilyticum was decreased. Moreover, administration of lincomycin significantly increased the enrichment of metabolic pathways related to pathogenicity and deficiency of polysaccharide degradation. These results suggest that lincomycin treatment could cause severe disruption of the commensal microbiota in finishing swine.

Keywords: antimicrobial; fecal microbiome; gut dysfunction; meta-analysis; swine.


Conflict of interest statement

The authors declare that the research was conducted in the absence of any commercial or financial relationships that could be construed as a potential conflict of interest.

Figures
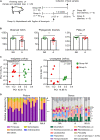
FIGURE 1
FIGURE 1
Experimental design and comparison of swine gut microbiota between groups administered (A) and not administered (NA) lincomycin. (A) All finishing swine were crossbred Landrace × Yorkshire (LY). Swine in the treatment group were administered a subclinical dose of lincomycin (0.1%, 1 kg/ton) through drinking water. NA, non-administered group; A, lincomycin-administered group. Samples from group A were further grouped depending on the occurrence of diarrhea: ND, no diarrhea; D, diarrhea. (B) α-diversity of swine fecal microbial communities between groups NA and A as analyzed by a one-tailed Student’s t-test (p-value * < 0.05, ** < 0.01). Values are expressed as mean ± SEM. Ns, non-significance. (C) β-diversity of swine fecal microbiota, calculated from PCoA plots based on the weighted and unweighted UniFrac distances. Statistical analysis was performed using PERMANOVA. (D) The relative abundance of the top 4 phyla and top 8 genera of fecal bacteria present in both groups. Abundance of significantly different bacterial phyla and genera were analyzed by a one-tailed Student’s t-test (p-value * < 0.05, ** < 0.01, **** < 0.0001). Uc, unclassified; ns, non-significance.
FIGURE 2
FIGURE 2
Comparison of swine microbial communities between the two groups. (A) Phylogenetic cladogram from LEfSe analysis, depicting the taxonomic association between the microbiome communities of groups NA and A. Each node represents a specific taxonomic type. (B) The ranking of significantly different genera by LEfSe method was revealed from the log LDA scores of the two groups. LEfSe was based on the non-parametric factorial Kruskal-Wallis sum-rank test followed by the Wilcoxon Signed-Rank test. Featured LDA scores >3.0 were plotted (p-value * < 0.05, ** < 0.01, *** < 0.001, **** < 0.0001). Uc: unclassified. (C) Bar plots illustrating selected features at the genus level. Values are expressed as mean ± SEM. Statistical analysis was performed using a one-tailed Student’s t-test (p-value * < 0.05, ** < 0.01, *** < 0.001).
FIGURE 3
FIGURE 3
Alteration of specific antibiotic-susceptible microbes. (A) α-diversity of ND and D groups of swine fecal microbial communities in group A analyzed by a one-tailed Student’s t-test (p-value * < 0.05, ** < 0.01). Values are expressed as mean ± SEM. Ns: non-significance. (B) PCoA plots based on the weighted and unweighted UniFrac distances. Statistical analysis was performed using PERMANOVA. (C) Bar plots of selected genera that were significantly abundant in group A. Statistical analysis were performed using a one-tailed Student’s t-test (p-value * < 0.05).
FIGURE 4
FIGURE 4
Predictive metagenomic analysis of functional profiling of swine fecal microbiota. Bacterial gene functions were predicted from the 16S rRNA gene-based microbial compositions using the PICRUSt2 algorithm and inferences from KEGG databases. Data from PICRUSt2 were imported into the STMAP package for statistical analysis and visualization. Only three pathways from each group were included in the post hoc plot.
FIGURE 5
FIGURE 5
Meta-analysis of global swine gut microbiome datasets. The three datasets were downloaded using the SRA toolkit (one dataset was a study conducted in Jeju, Korea, and the other two were conducted in Nanjing, China). (A) β-diversity of global data based on the Bray-Curtis distance matrix. Statistical analysis was performed using PERMANOVA. The PCoA plot on the left is the result of displaying different colors for each study, and the result on the right is the result of displaying different colors depending on whether with or without antibiotics administration. (B) Bacterial gene functions were predicted using PICRUSt2 and imported into the STAMP package for statistical analysis and visualization. The post hoc plot showed the three putative pathways in group G-A. G-NA, Global non-administered group; G-A, Global administered group.

Similar articles

Cited by

References

    1. Becattini S., Taur Y., Pamer E. G. (2016). Antibiotic-Induced Changes in the Intestinal Microbiota and Disease. Trends Mol. Med. 22 458–478. 10.1016/j.molmed.2016.04.003 - DOI - PMC - PubMed
    1. Bokulich N. A., Kaehler B. D., Rideout J. R., Dillon M., Bolyen E., Knight R., et al. (2018). Optimizing taxonomic classification of marker-gene amplicon sequences with QIIME 2’s q2-feature-classifier plugin. Microbiome 6:90. 10.1186/s40168-018-0470-z - DOI - PMC - PubMed
    1. Callahan B. J., Mcmurdie P. J., Rosen M. J., Han A. W., Johnson A. J., Holmes S. P. (2016). DADA2: High-resolution sample inference from Illumina amplicon data. Nat. Methods 13 581–583. 10.1038/nmeth.3869 - DOI - PMC - PubMed
    1. Costa K. A., Soares A. D., Wanner S. P., Santos R., Fernandes S. O., Martins Fdos S., et al. (2014). L-arginine supplementation prevents increases in intestinal permeability and bacterial translocation in male Swiss mice subjected to physical exercise under environmental heat stress. J. Nutr. 144 218–223. 10.3945/jn.113.183186 - DOI - PubMed
    1. Cromwell G. L. (2002). Why and how antibiotics are used in swine production. Anim. Biotechnol. 13 7–27. 10.1081/abio-120005767 - DOI - PubMed

LinkOut - more resources