. 2021 Feb 10:12:618649.
doi: 10.3389/fmicb.2021.618649. eCollection 2021.

The Mitogenomes of Ophiostoma minus and Ophiostoma piliferum and Comparisons With Other Members of the Ophiostomatales

Affiliations

The Mitogenomes of Ophiostoma minus and Ophiostoma piliferum and Comparisons With Other Members of the Ophiostomatales

Abdullah Zubaer et al. Front Microbiol. .

Abstract

Fungi assigned to the Ophiostomatales are of economic concern as many are blue-stain fungi and some are plant pathogens. The mitogenomes of two blue-stain fungi, Ophiostoma minus and Ophiostoma piliferum, were sequenced and compared with currently available mitogenomes for other members of the Ophiostomatales. Species representing various genera within the Ophiostomatales have been examined for gene content, gene order, phylogenetic relationships, and the distribution of mobile elements. Gene synteny is conserved among the Ophiostomatales but some members were missing the atp9 gene. A genome wide intron landscape has been prepared to demonstrate the distribution of the mobile genetic elements (group I and II introns and homing endonucleases) and to provide insight into the evolutionary dynamics of introns among members of this group of fungi. Examples of complex introns or nested introns composed of two or three intron modules have been observed in some species. The size variation among the mitogenomes (from 23.7 kb to about 150 kb) is mostly due to the presence and absence of introns. Members of the genus Sporothrix sensu stricto appear to have the smallest mitogenomes due to loss of introns. The taxonomy of the Ophiostomatales has recently undergone considerable revisions; however, some lineages remain unresolved. The data showed that genera such as Raffaelea appear to be polyphyletic and the separation of Sporothrix sensu stricto from Ophiostoma is justified.

Keywords: Ophiostoma; blue stain fungi; complex introns; homing endonucleases; mitochondria; mobile introns.


Conflict of interest statement

The authors declare that the research was conducted in the absence of any commercial or financial relationships that could be construed as a potential conflict of interest.

Figures
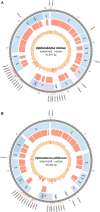
FIGURE 1
FIGURE 1
Circular representation of the mitochondrial genomes showing the tRNA (pointed outward on the scale), protein coding genes (blue track), introns (red track), and genetic-feature-wise GC graph (GC% was calculated for annotated features instead of fixed window, showed in the innermost track). (A) The annotated mitochondrial genome of Ophiostoma minus; total size of the circular genome is 91,847 bp (GenBank accession: MW122509.1). (B) The annotated mitochondrial genome of Ophiostoma piliferum; total size of the circular genome is 69,966 bp (GenBank accession: MW122508.1).
FIGURE 2
FIGURE 2
Schematic representation of gene order and position of tRNA gene clusters for members of the Ophiostomatales. Gene order is conserved across the 25 sampled Ophiostomatales with minor variations in tRNA composition and the presence or absence of the atp9 gene. Genes encoding for tRNAs is represented using their respective single-letter amino acid codes. Intron-encoded tRNAs are represented by placing them under the gene that encodes them. Plus (+) and minus (–) signs represent presence and absence of a gene, respectively, and only applies to the atp9 gene. See Supplementary Table 1 for GenBank NCBI accession numbers.
FIGURE 3
FIGURE 3
(A) Mitochondrial introns of the Ophiostomatales categorized according to intron phasing on a gene by gene basis. (B) Representation of the relative frequencies of different types of introns encoded open reading frames based on gene by gene basis (LAG, LAGLIDADG type homing endonucleases/maturases; GIY, GIY-YIG type homing endonucleases; RT, reverse transcriptases). (C) Relative distribution and number of mitochondrial introns recorded on a gene-by-gene basis among the examined members of the Ophiostomatales.
FIGURE 4
FIGURE 4
The panintronic landscape for the studied members of the Ophiostomatales. The landscape was generated by Circos and shows all intron insertions sites and their frequencies. More detailed intron landscapes showing intron types, intron-encoded protein types, and introns phasing are shown in Supplementary Figures 1A–D.
FIGURE 5
FIGURE 5
Phylogenetic tree of mitogenomes showing the position of Ophiostoma minus and Ophiostoma piliferum among members of the Ophiostomatales. The tree topology (50% majority-rule consensus tree) was generated by the MrBayes program and involved 48 concatenated amino acid sequences. The tree is drawn to scale with branch length measured in the number of substitutions per site. Posterior probability values are indicated at the nodes. NCBI and GenBank accession numbers (except for Verticillium alboatrum, which refers to MitoFun database) are indicated in square brackets. For the members of the Ophiostomatales, mitogenome sizes, and total numbers of introns are listed for each genome. Taxonomic designations (Orders, and Genera for the Ophiostomatales) are indicated on the relevant branches. Raf, Raffaelea; Gra, Graphilbum; Est, Esteya; Grs, Grosmannia; Lep, Leptographium; Spx, Sporothrix sensu stricto; Cop, Ceratocystiopsis; Oph, Ophiostoma sensu stricto; Hwk, Hawksworthiomyces; Fra, Fragosphaeria.
FIGURE 6
FIGURE 6
Graph depicting the relationship between mitogenome sizes and intron numbers per mitogenome for the examined members of the Ophiostomatales.
FIGURE 7
FIGURE 7
Predicted cob I4 (cob-490) RNA fold composed of three intron modules (A–C). Pairing regions [for group I introns: P1–P11; and domains (D) I–VI for the group II intron] are labeled by purple text; tertiary interactions are shown by blue lines. Exon and intron sequences are represented by lowercase and uppercase letters, respectively. Red arrows indicate intron-exon/pseudoexon boundaries. Orange subsequence in uppercase letters is exon-mimicking (pseudoexon) sequence, which is annotated as within cob I4’s downstream group IA1 intron component (cob I4-C). Orange subsequence in lowercase letters is annotated as downstream exon sequence (cob-EB). (A) cob I4’s upstream group IA1 intron (cob I4-A) RNA secondary structure model. (B) cob I4-B RNA secondary structure model. IBS, intron binding sequence; EBS, exon binding sequence. Helical domains I–VI branching from a central linker sequence (“six fingered hand”) shown. Potential tertiary interactions (Greek letters) are indicated. (C) cob I4’s downstream group IA1 intron (cob I4-C) RNA secondary structure model.
FIGURE 8
FIGURE 8
Predicted cox3 I2 (cox3–640) RNA secondary structure model composed of two intron modules. Pairing regions (P1–P11) are labeled by blue text; tertiary interactions are shown by blue lines. Exon and intron sequences are represented by lowercase and uppercase letters, respectively. Red arrows indicate intron-exon/pseudoexon boundaries. (A) cox3 I2-A RNA secondary structure model. (B) cox3 I2-B RNA secondary structure model.
FIGURE 9
FIGURE 9
cob- 490 intron schematic diagram. cob i4, the entire complex intron at cob 490 position. cob i4-A, cob i4’s upstream group IA intron; cob-EA, upstream exon; cob ORF-A, cob i4-A’s ORF; cob i4-B, cobi4’s middle group IIB intron; cob i4-C, cob i4’s downstream group IA intron; cob ORF B, cob i4-C’s ORF; cob-EB, downstream exon. LAGLIDADG represents type of homing endonuclease ORF encoded by group I intron. The numbers in brackets represent the position and length of each intron element relative to the start of cob i4. As the two group I introns are of the same subtype, their interactions can be interchangeable; components of the internal members can interact with components of the external member to form paired regions.
FIGURE 10
FIGURE 10
Proposed RNA “ratchet-like” splicing model for cob I4 (cob-490). As the group I intron modules are both 1A types they have similar sequence elements that allow for the formation of the helical regions between the two modules (P1–P9), thus functionally they can act like tandem introns, i.e., side-by-side introns. Splicing occurs via a two-step process: (1) The “upstream” intron initially splices out using a sequence, referred to as a potential pseudoexon, located between the “upstream” and “downstream” introns, and identical to the first six nucleotides of the downstream exon. (2) Subsequent splicing of “downstream” intron results in joining of the upstream and downstream exons. cob-EA and cob-EB refer to upstream and downstream exons, respectively. The pseudoexon and downstream exon are represented in green in uppercase and lowercase, respectively. cob I4-A (purple) and cob I4-C (blue) refer to the “upstream” and “downstream” introns, respectively. Proposed P1 and P10 interactions are shown in gray circles.
FIGURE 11
FIGURE 11
The cox3–640 intron schematic diagram. cox3 i2, the entire complex intron at cox3–640 position. cox3 i2-A, cox3 i2’s upstream group IA intron; cox3-EA, upstream exon; cox3 ORF-A, cox3 i2-A’s ORF; cox3 i2-B, cox3 i2’s downstream group IA intron; cox3 ORF-B, cox3 i2-B’s ORF; cox3-EB, downstream exon. Inter-intron sequence: sequence separating cox3 i2-A and cox3 i2-B. LAGLIDADG designation represents the type of homing endonuclease ORF encoded by group I introns. The numbers in brackets represent the position and length of each intron element relative to the start of cox3 i2.

References

    1. Abboud T. G., Zubaer A., Wai A., Hausner G. (2018). The complete mitochondrial genome of the Dutch elm disease fungus Ophiostoma novo-ulmi subsp. novo-ulmi. Can. J. Microbiol. 64 339–348. 10.1139/cjm-2017-0605 - DOI - PubMed
    1. Adachi J., Waddell P. J., Martin W., Hasegawa M. (2000). Plastid genome phylogeny and a model of amino acid substitution for proteins encoded by chloroplast DNA. J. Mol. Evol. 50 348–358. 10.1007/s002399910038 - DOI - PubMed
    1. Aguileta G., de Vienne D. M., Ross O. N., Hood M. E., Giraud T., Petit E., et al. (2014). High variability of mitochondrial gene order among fungi. Genome Biol. Evol. 6 451–465. 10.1093/gbe/evu028 - DOI - PMC - PubMed
    1. Baidyaroy D., Hausner G., Hafez M., Michel F., Fulbright D. W., Bertrand H. (2011). A 971-bp insertion in the rns gene is associated with mitochondrial hypovirulence in a strain of Cryphonectria parasitica isolated from nature. Fungal Genet. Biol. 48 775–783. 10.1016/j.fgb.2011.05.006 - DOI - PubMed
    1. Belfort M. (2003). Two for the price of one: a bifunctional intron-encoded DNA endonuclease-RNA maturase. Genes Dev. 17 2860–2863. 10.1101/gad.1162503 - DOI - PubMed

LinkOut - more resources