. 2021 Feb 12:12:625136.
doi: 10.3389/fmicb.2021.625136. eCollection 2021.

An Optimized High-Throughput Immuno-Plaque Assay for SARS-CoV-2

Affiliations

An Optimized High-Throughput Immuno-Plaque Assay for SARS-CoV-2

Alberto A Amarilla et al. Front Microbiol. .

Abstract

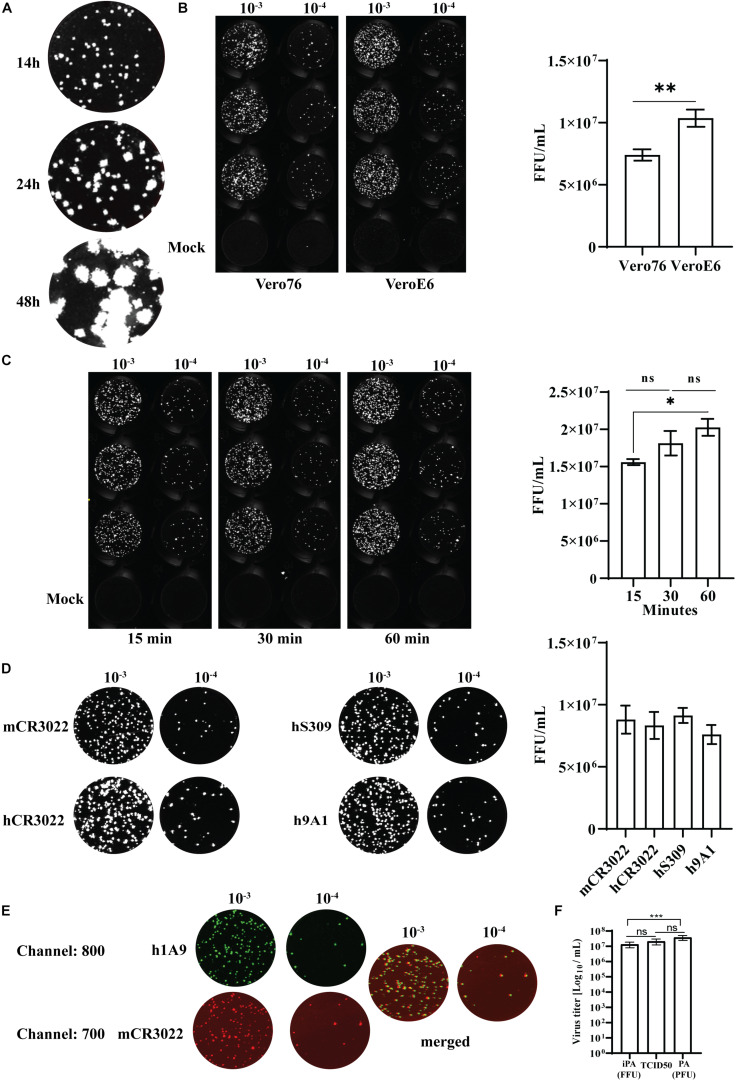
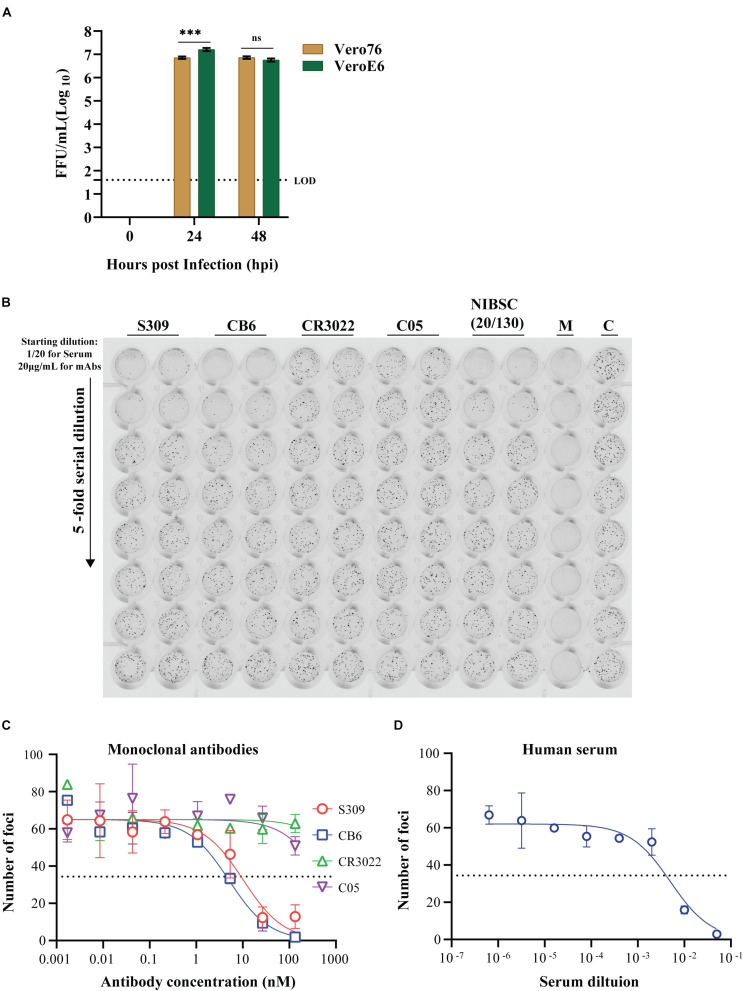
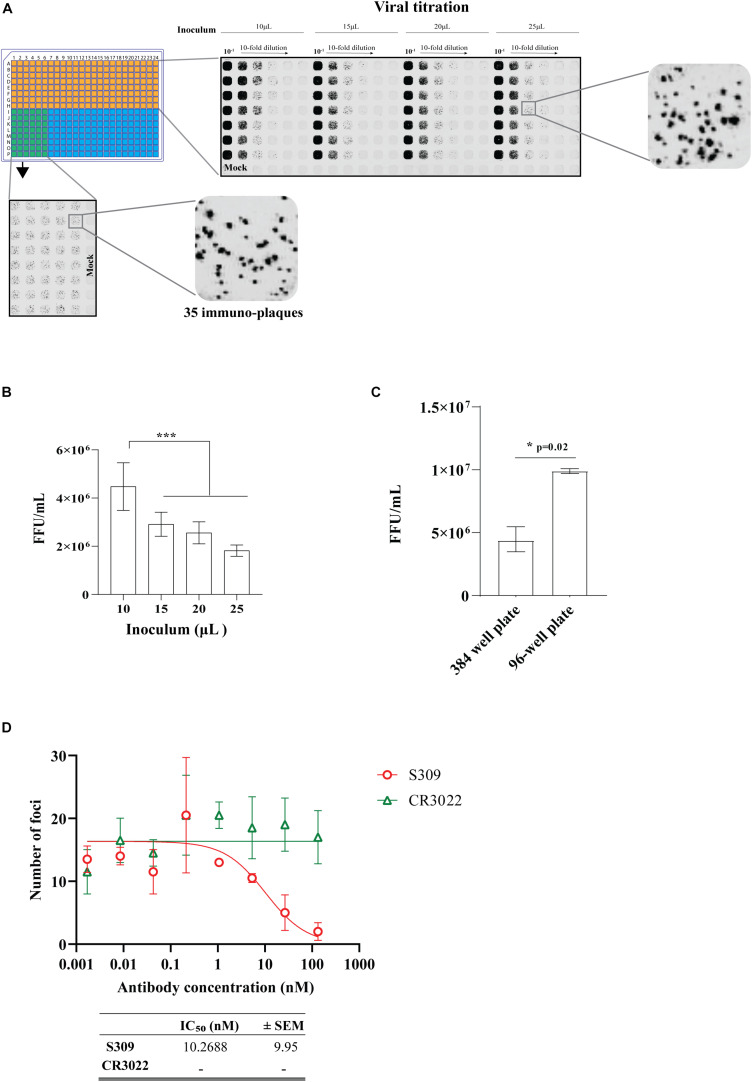
Severe acute respiratory syndrome coronavirus-2 (SARS-CoV-2) has been identified as the causative agent of coronavirus disease 2019 and is capable of human-to-human transmission and rapid global spread. The rapid emergence and global spread of SARS-CoV-2 has encouraged the establishment of a rapid, sensitive, and reliable viral detection and quantification methodology. Here, we present an alternative assay, termed immuno-plaque assay (iPA), which utilizes a combination of plaque assay and immunofluorescence techniques. We have extensively optimized the conditions for SARS-CoV-2 infection and demonstrated the great flexibility of iPA detection using several antibodies and dual-probing with two distinct epitope-specific antibodies. In addition, we showed that iPA could be utilized for ultra-high-throughput viral titration and neutralization assay within 24 h and is amenable to a 384-well format. These advantages will significantly accelerate SARS-CoV-2 research outcomes during this pandemic period.

Keywords: SARS-CoV-2; coronaviruses; immuno-plaque assay (iPA); viral quantification.


Conflict of interest statement

The authors declare that the research was conducted in the absence of any commercial or financial relationships that could be construed as a potential conflict of interest.

Figures

FIGURE 1
FIGURE 1
Schematic representation of the 96-well layout of sample preparation for viral titration. Samples 1–16 are represented as S1–S16 and the undiluted samples as UD.
FIGURE 2
FIGURE 2
Example of scanned plate performed by immuno-plaque assay showing the 10-fold serial dilution in the 96-well format and foci numbers counted by Mousotron.
FIGURE 3
FIGURE 3
Schematic representation of the 96-well layout of sample preparation for the plaque reduction neutralization test. The uninfected cells are represented as M and the virus control as C.
FIGURE 4
FIGURE 4
Screenshot of Viridot program highlighting the different options within the “Image Formatting” tab.
FIGURE 5
FIGURE 5
Screenshot of Viridot program showing the three main sections within the “Plaque Counter” tab.
FIGURE 6
FIGURE 6
Screenshot of Viridot program showing section B of “Plaque Counter” tab after adjusting the parameter for analysis.
FIGURE 7
FIGURE 7
Screenshot of Viridot program showing section C of “Plaque Counter” tab after adjusting the parameter for analysis.
FIGURE 8
FIGURE 8
Optimization of an immuno-plaque assay for SARS-CoV-2. (A) A representative image of immuno-plaque sizes from infected cells fixed at different time points. (B) Comparison of the viral titer of the same viral stock on Vero76 and VeroE6. Left, representative images of immuno-plaque assay (iPA) performed on Vero76 and VeroE6. Right, virus titer calculated from the left. (C) Left, representative images of viral titers comparing different adsorption periods to infect the cells. Right, virus titer calculated from the left. (D) Representative images of viral titer of the same stock comparing different primary mAbs. Right, virus titer calculated from the left. (E) Representative images of co-staining of infected cells with two different mAbs (mCR3022 and h1A9). (F) Virus titer assessed by optimized iPA, TCID50, and standard plaque assay. The P-values for panels (A) and (C) (*p < 0.05, **p < 0.01) were calculated by using the Mann–Whitney U test. The p-values for panel (F) (***p < 0.001) were calculated by one-way analysis of variance with the Tukey multiple-comparisons test. The data presented are the mean of two or three independent experiments, where each was performed in technical duplicate or triplicate. Error bars are presented as means ± SEM.
FIGURE 9
FIGURE 9
Utility of the immuno-plaque assay to determine the viral titer and neutralizing antibody levels for SARS-CoV-2 in a 96-well plate format. (A) Growth kinetics comparison of SARS-CoV-2 on Vero76 and VeroE6. Viral titers were determined on VeroE6. The p-value (***p < 0.001) for growth kinetics was determined by multiple comparison using two-way ANOVA test with Sidak’s correction. The data presented are the mean of three independent experiments, where each was performed in duplicate. Each focus counted per well of sample is then expressed as focus-forming units per milliliter (FFU/ml), and the theoretical limit of detection was determined by the detection of a single immuno-plaque in undiluted sample, which corresponds to 40 FFU/ml for a 96-well plate format. (B) Scanned image showing the immuno-plaques from plaque reduction neutralization test (PRNT) for mAbs and NIBSC control serum. (C,D) Neutralizing antibody levels for mAbs and NIBSC control serum by PRNT. The data presented is representative of three independent experiments, where each was performed in technical duplicate. The IC50 or ID50 values for each antibody and NIBSC control serum are shown in Table 1. For PRNT, to determine the IC50 value, the best-fit curve was tested using non-linear regression and the inhibitor vs. response (three parameters) model. The level of statistical significance was set at 95% (p = 0.05), and error bars are presented as means ± SEM. M and C correspond to the well containing media only or virus only, respectively.
FIGURE 10
FIGURE 10
Optimization of an immuno-plaque assay for SARS-CoV-2 in 384-well plate format. (A) Immuno-plaque assay (iPA) showing the distinct immuno-plaque sizes from different amounts of inoculum for viral titration (top right) and for the plaque reduction neutralization test (PRNT) (bottom left). (B) Viral titer comparison from iPA using different amount of inoculum. The p-values for panel (B) (***p < 0.001) were calculated by one-way analysis of variance with the Tukey multiple-comparisons test. The data presented are the mean of two or three independent experiments, where each has six technical replicates. (C) A side-by-side comparison of viral titer assay sensitivity between 96- and 384-well plates. The p-value (*p < 0.05) was calculated by using the Mann–Whitney U test. (D) Curve of neutralizing antibody levels by PRNT using mAbs. The IC50 values for each antibody are shown in the bottom. For PRNT, to determine the IC50 value, the best-fit curve was tested using non-linear regression and the inhibitor vs. response (three parameters) model. The level of statistical significance was set at 95% (p = 0.05). Error bars are presented as means ± SEM.

References

    1. Agbulos D. S., Barelli L., Giordano B. V., Hunter F. F. (2016). Zika virus: quantification, propagation, detection, and storage. Curr. Protoc. Microbiol. 43 15D.4 1–15D.16. - PubMed
    1. Amanat F., White K. M., Miorin L., Strohmeier S., McMahon M., Meade P., et al. (2020). An in vitro microneutralization assay for SARS-CoV-2 serology and drug screening. Curr. Protoc. Microbiol. 58:e108. - PMC - PubMed
    1. Barrett P. N., Mundt W., Kistner O., Howard M. K. (2009). Vero cell platform in vaccine production: moving towards cell culture-based viral vaccines. Expert Rev. Vaccines 8 607–618. 10.1586/erv.09.19 - DOI - PubMed
    1. Brien J. D., Lazear H. M., Diamond M. S. (2013). Propagation, quantification, detection, and storage of west nile virus. Curr. Protoc. Microbiol. 31 15D.3.1–15D.3.18. - PubMed
    1. Castilletti C., Carletti F., Gruber C. E., Bordi L., Lalle E., Quartu S., et al. (2015). Molecular characterization of the first ebola virus isolated in italy, from a health care worker repatriated from sierra leone. Genome Announc. 3 e639–e615. - PMC - PubMed