. 2021 Feb 11:12:632280.
doi: 10.3389/fmicb.2021.632280. eCollection 2021.

Microbial Community Dynamics of Soybean (Glycine max) Is Affected by Cropping Sequence

Affiliations

Microbial Community Dynamics of Soybean (Glycine max) Is Affected by Cropping Sequence

Ayooluwa J Bolaji et al. Front Microbiol. .

Abstract

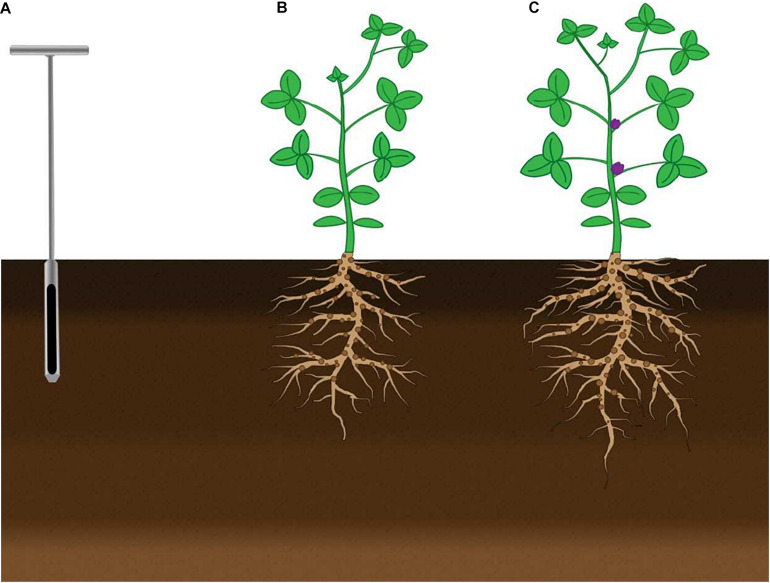
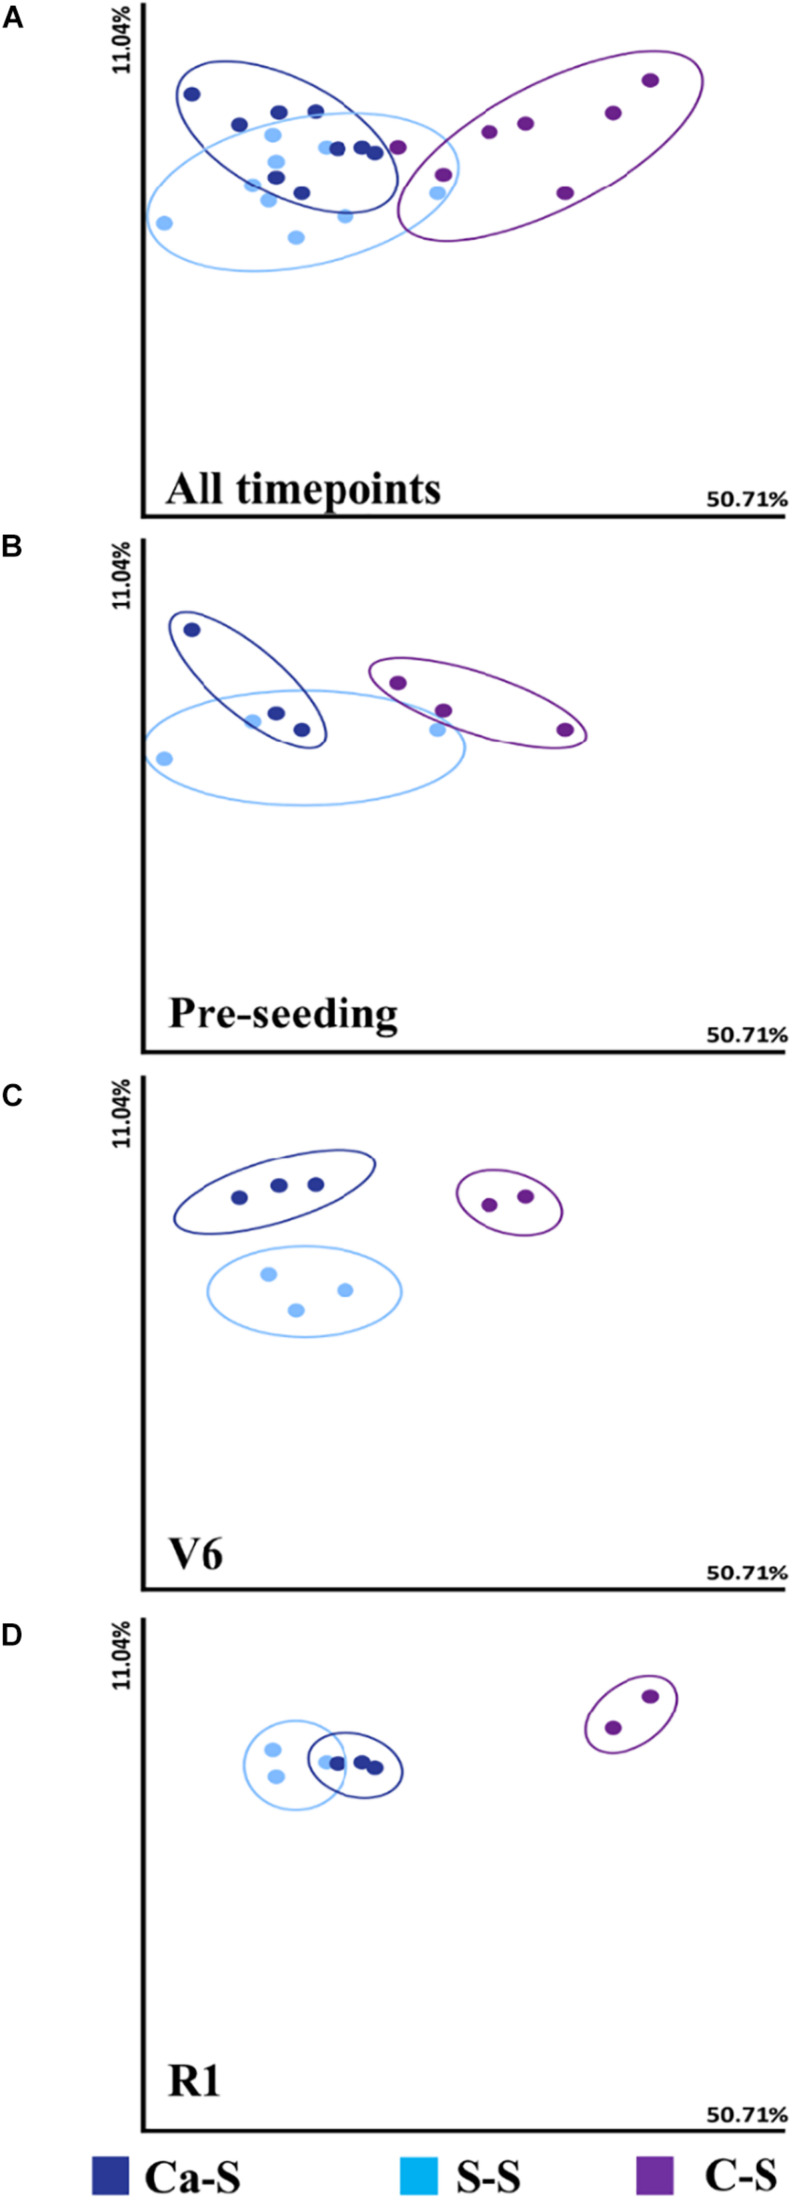
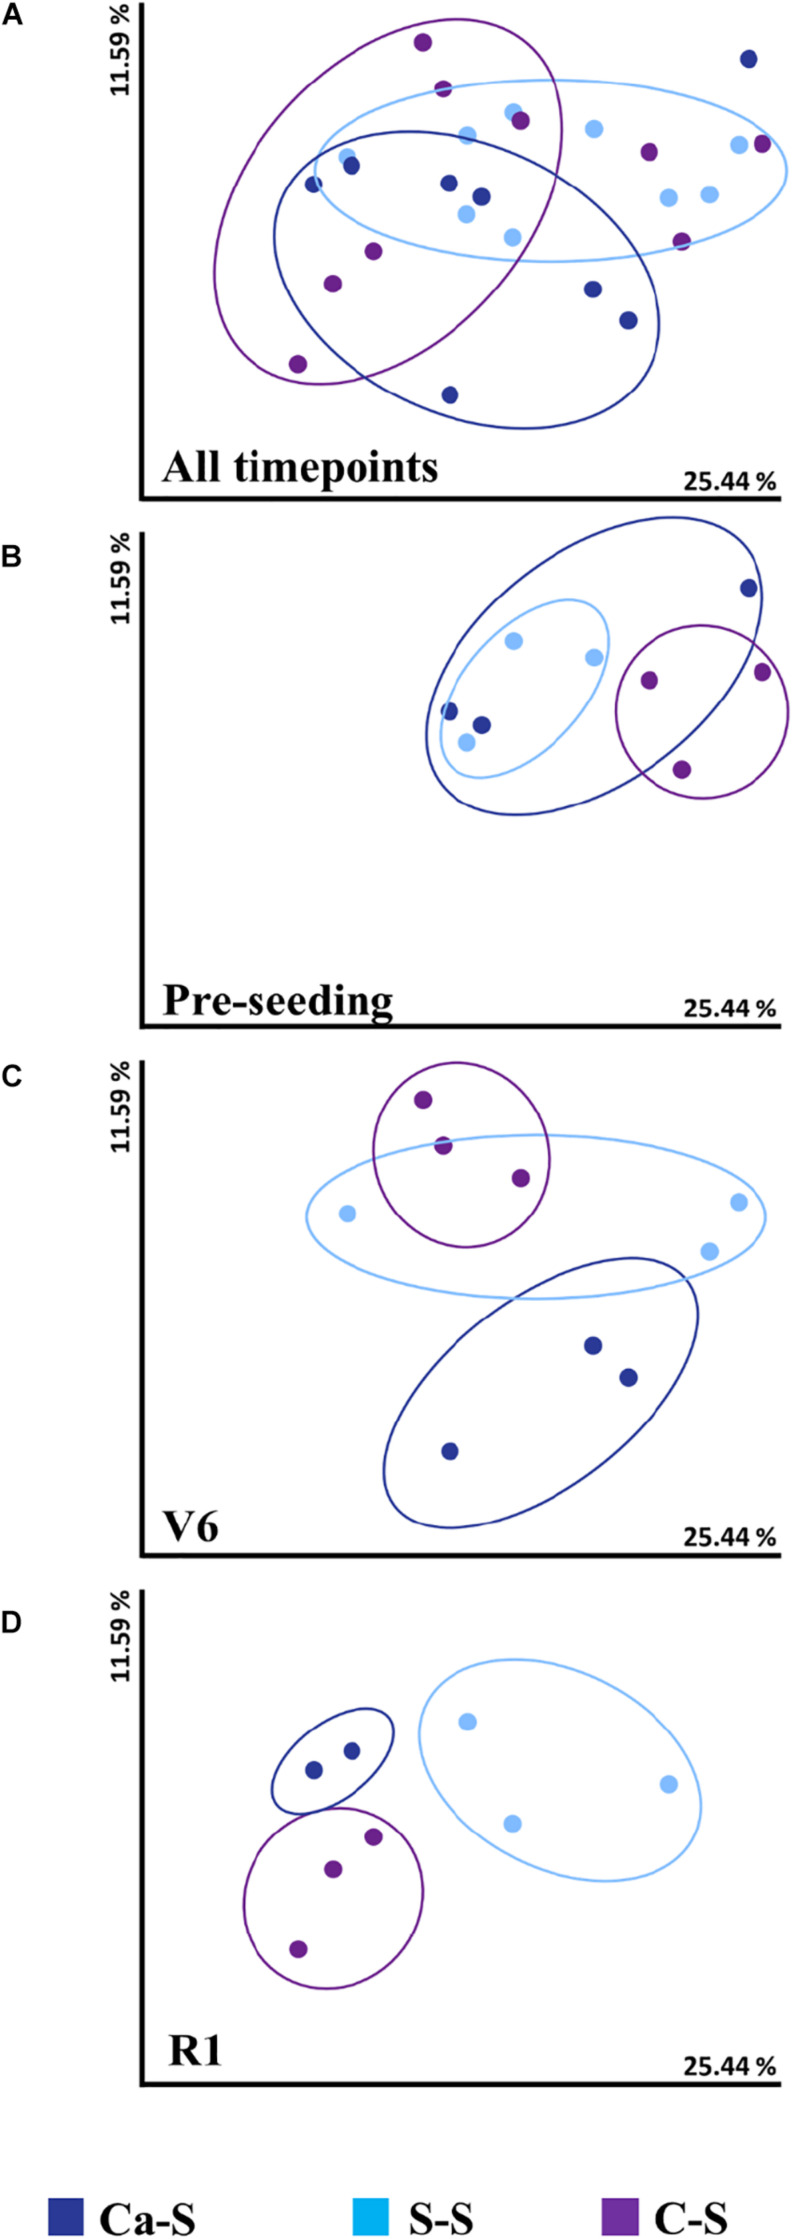
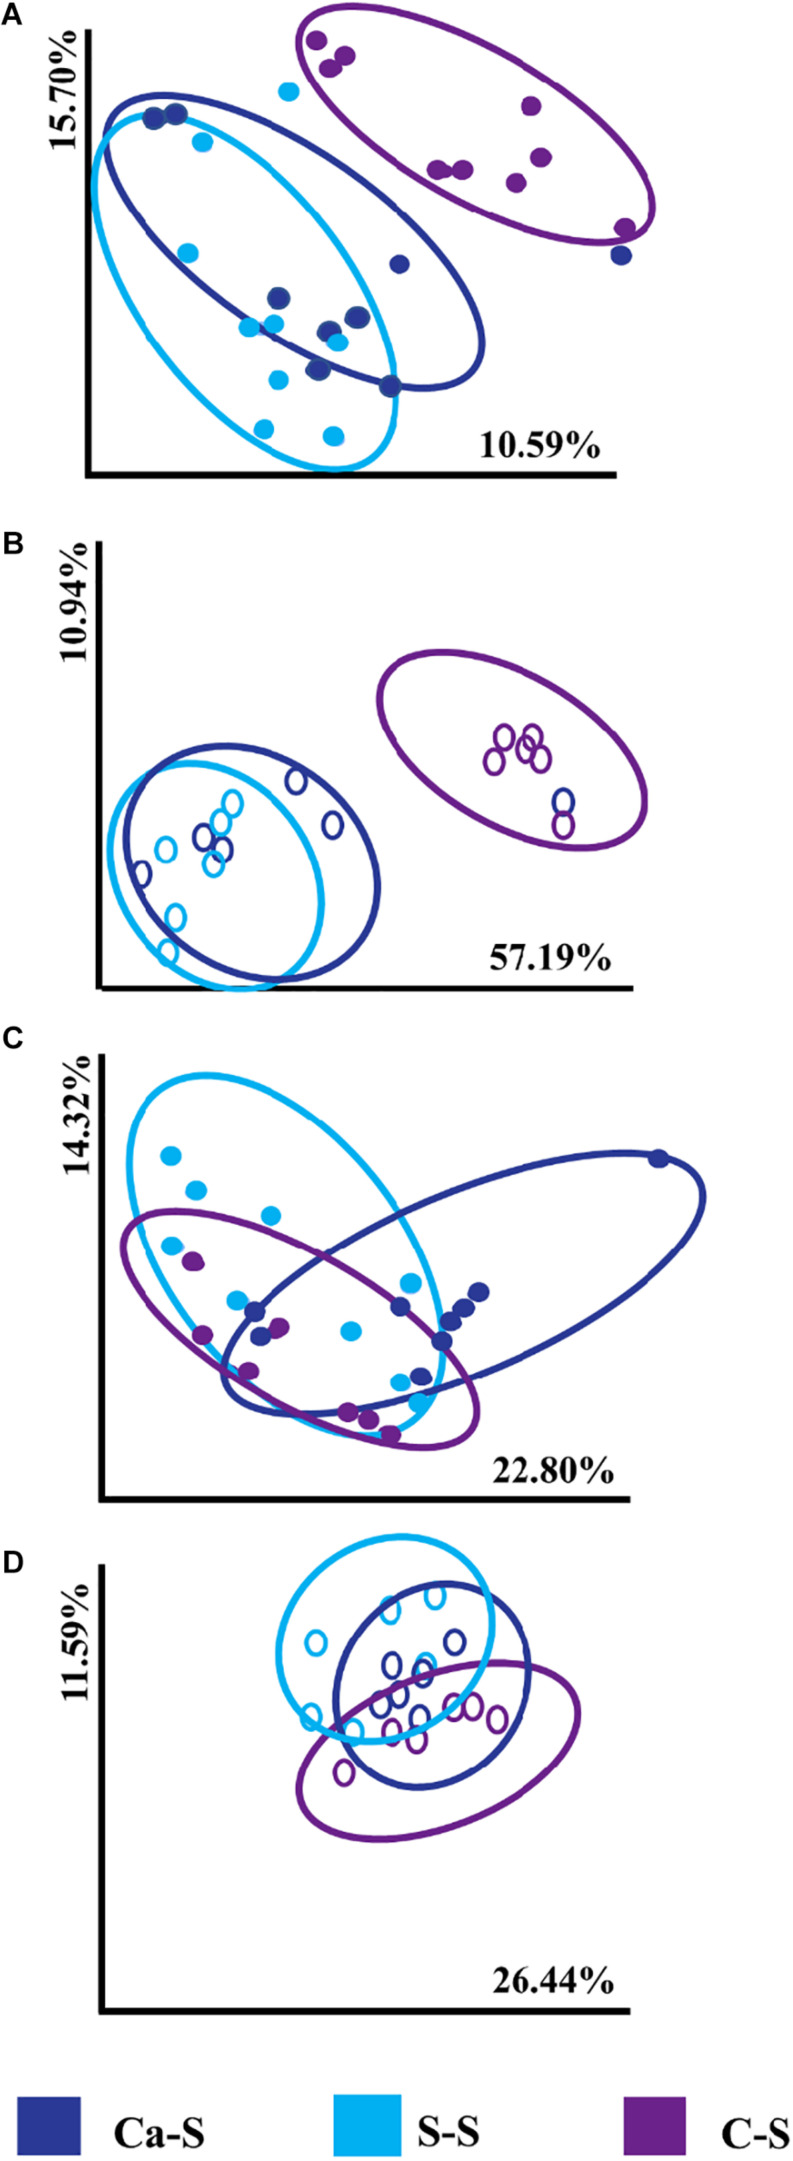
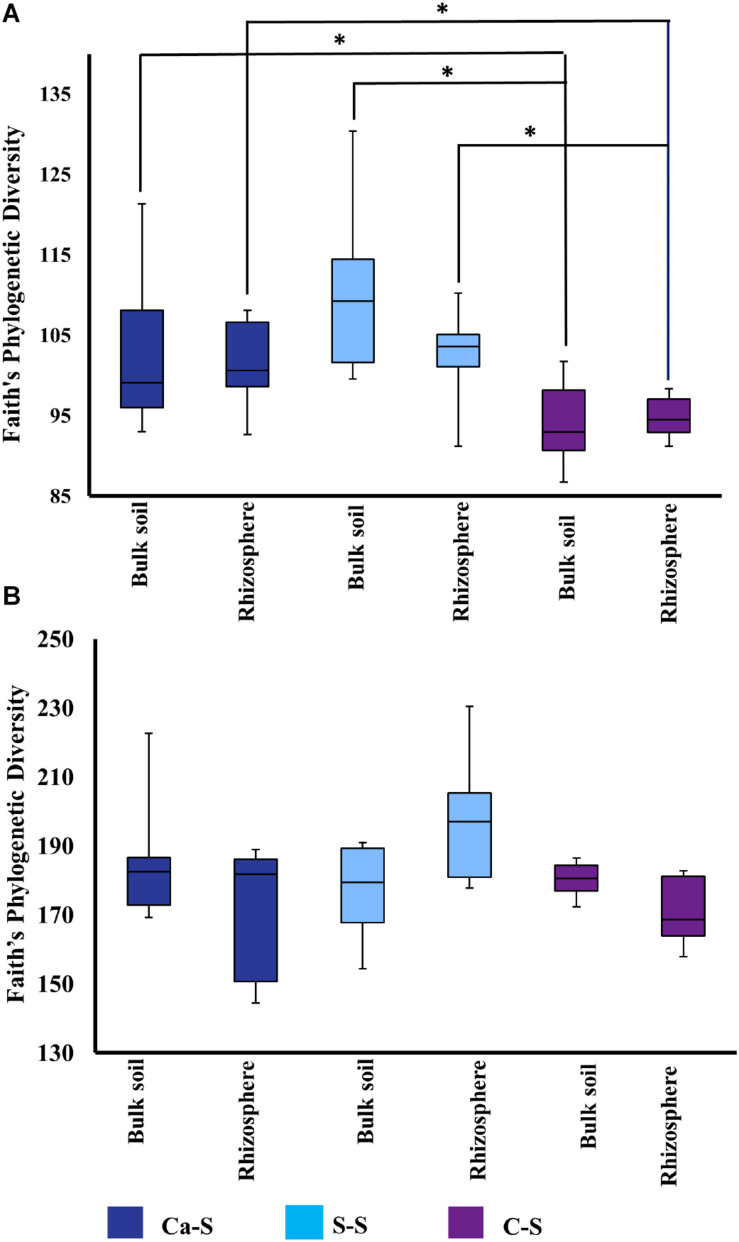
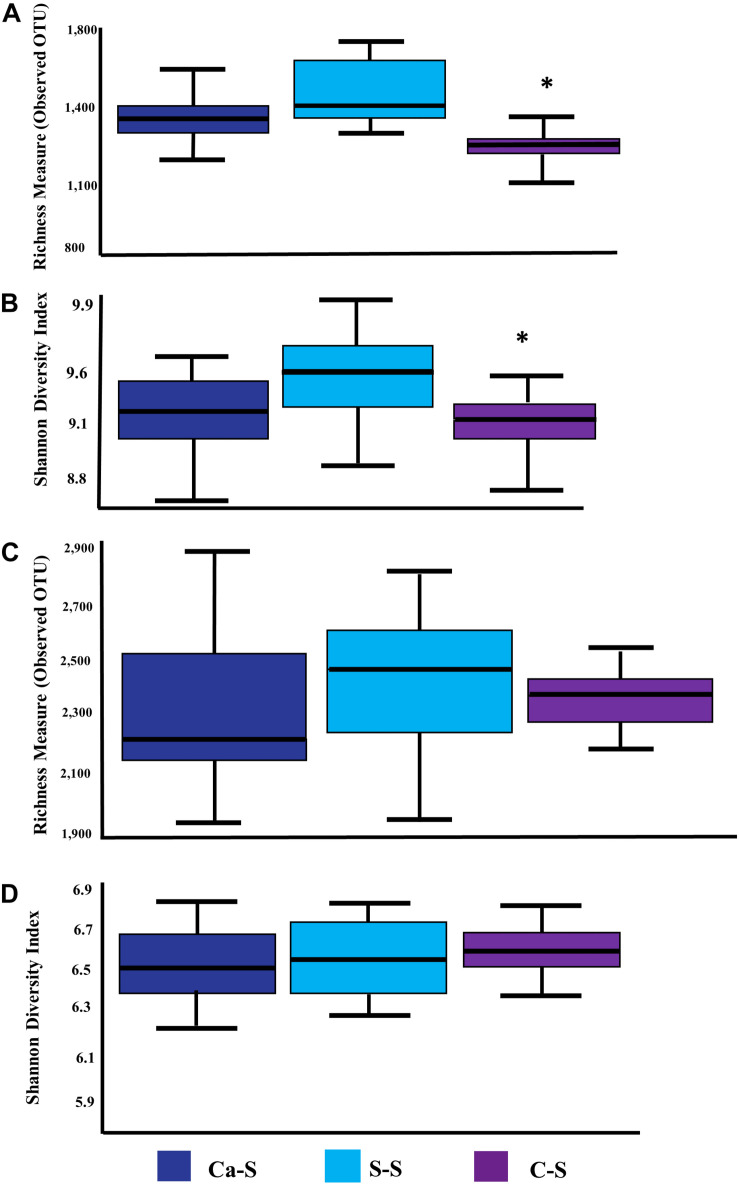
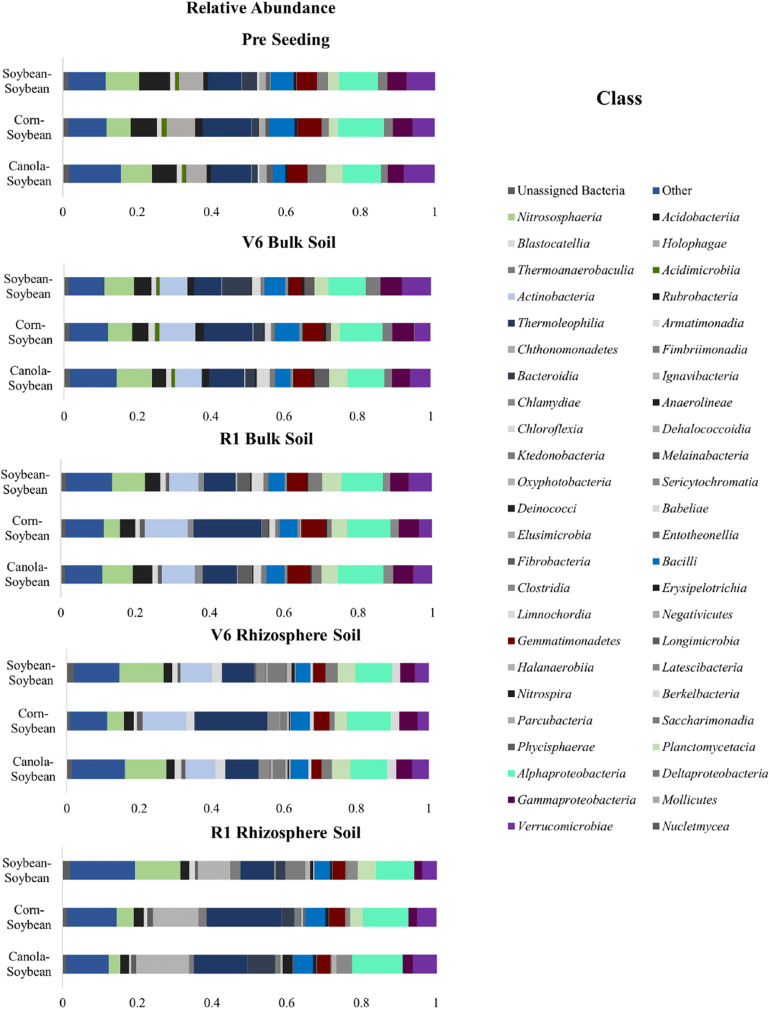
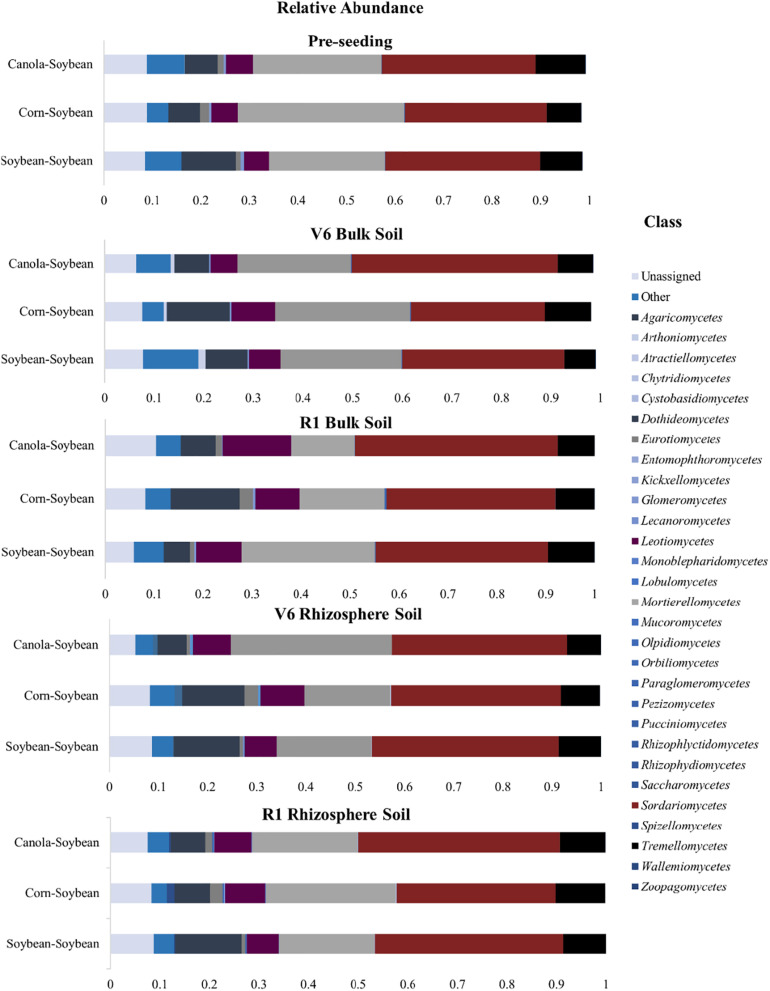
The microbial composition of the rhizosphere soil could be an important determinant of crop yield, pathogen resistance, and other beneficial attributes in plants. However, little is known about the impact of cropping sequences on microbial community dynamics, especially in economically important species like soybean. Using 2-year crop sequences of corn-soybean, canola-soybean, and soybean-soybean, we investigated how crops from the previous growing season influenced the structure of the microbiome in both the bulk soil and soybean rhizosphere. A combination of marker-based Illumina sequencing and bioinformatics analyses was used to show that bacterial species richness and evenness in the soybean rhizosphere soil were similar following canola and soybean compared to a previous corn sequence. However, fungal species richness and evenness remained unaffected by crop sequence. In addition, bacterial and fungal species diversity in both the bulk and soybean rhizosphere soil were not influenced by crop sequence. Lastly, the corn-soybean sequence significantly differed in the relative abundance of certain bacterial and fungal classes in both the soybean rhizosphere and bulk soil. While canola-soybean and a continuous soybean sequence did not, suggesting that a preceding corn sequence may reduce the occurrence of overall bacterial and fungal community members. For the present study, crop sequence impacts bacterial diversity and richness in both the bulk soil and soybean rhizosphere soil whereas fungal diversity and richness are resilient to crop sequence practices. Together, these findings could help drive decision making for annual crop and soil management practices.

Keywords: canola; corn; crop sequence; phytomicrobiome; soybean.


Conflict of interest statement

The authors declare that the research was conducted in the absence of any commercial or financial relationships that could be construed as a potential conflict of interest.

Figures

FIGURE 1
FIGURE 1
Schematic figure of the timing of sample collection from bulk soil and soybean rhizosphere soil for all crop sequences. Bulk soil and rhizosphere soil samples were collected at a depth of 0–20 cm. (A) Soil was collected from bulk soil using a soil probe before seeding soybean. Sampling of bulk soil in the inter-row area between soybean plants and rhizosphere soil of soybean at the (B) V6 and (C) R1 growth stages.
FIGURE 2
FIGURE 2
Influence of crop sequence on bacterial species diversity in the bulk soil Principal coordinate analysis (PCoA), represented by the beta diversity metric – Weighted UniFrac, comparing the effect of crop sequence on microbial species diversity among treatments at all time points in the bulk soil. For each axis, the percent of variation is indicated. Dark blue dots, canola-soybean sequence (Ca-S); light blue dots, soybean-soybean sequence (S-S); purple dots, corn-soybean sequence (C-S). Each dot represents the average of three biological replicates and each biological replicate represents five pooled core soil samples. Comparison of cumulative bacterial species diversity for all sequences collect at (A) all time-points (B) pre-seeding (C) V6, and (D) R1 soybean growth stages. Because of similarities in the data, some data points are overlapping.
FIGURE 3
FIGURE 3
Influence of crop sequence on fungal species diversity in the bulk soil Principal coordinate analysis (PCoA), represented by the beta diversity metric – Weighted UniFrac, comparing the effect of crop sequence on microbial species diversity among treatments at all time points in the bulk soil. For each axis, the percent of variation is indicated. Dark blue dots, canola-soybean sequence (Ca-S); light blue dots, soybean-soybean sequence (S-S); purple dots, corn-soybean sequence (C-S). Each dot represents the average of three biological replicates and each biological replicate represents five pooled core soil samples. Comparison of cumulative fungal species diversity for all sequences collect at (A) all time-points (B) pre-seeding (C) V6, and (D) R1 soybean growth stages. Because of similarities in the data, some data points are overlapping.
FIGURE 4
FIGURE 4
Principal coordinate analysis (PCoA), represented by Bray-Curtis dissimilarities between samples and calculated using the 16S rRNA amplicon sequences for bacterial samples and the ITS1 and ITS2 amplicon sequences of fungal samples. Soils were obtained from the Ca-S, S-S, and C-S crop sequences in the bulk and rhizosphere soil for all time-points. For each axis, the percent of variation is indicated. The dark blue filled and open circles represent the canola-soybean sequence (Ca-S), light blue filled and open circles are the soybean-soybean sequence (S-S) and the purple filled and open circles are the corn-soybean sequence (C-S). Each dot represents the average of three biological replicates and each biological replicate represents five pooled core soil samples. Comparison of cumulative Bray-Curtis dissimilarities for panel (A) bacterial in the bulk soil (B) bacterial in the rhizosphere soil (C) fungal in the bulk soil (D) fungal in the rhizosphere soil.
FIGURE 5
FIGURE 5
Quantitative comparisons of bacterial species diversity represented by the alpha diversity metric – Faith’s Phylogenetic Diversity –in the bulk soil and rhizosphere soil at all time-points. The median as well as the 25th and 75th percentile of the samples is presented, individual data points outside of this range are given as mean ± standard deviation of three replicate samples. Significant differences due to crop sequences within one compartment (bulk soil or rhizosphere) are noted. The dark blue boxplot represents the canola-soybean sequence (Ca-S), light blue boxplots are the soybean-soybean sequence (S-S) and the purple boxplots are the corn-soybean sequence (C-S). (A) Comparison of cumulative phylogenetic diversity of the bacterial community in the bulk soil and rhizosphere soil treatments. (B) Comparison of cumulative phylogenetic diversity of the fungal community in bulk soil and rhizosphere soil for all crop sequences and all time points. Statistical significance was analyzed by the Kruskal-Wallis test. Asterisks indicate statistically significance (P < 0.05).
FIGURE 6
FIGURE 6
Quantitative comparisons of global bacterial and fungal species richness. The median as well as the 25th and 75th percentile of the samples is presented, individual data points outside of this range are given as mean ± standard deviation of three replicate samples. Significant differences due to crop sequences are noted with an asterisk. The dark blue boxplot represents the canola-soybean sequence (Ca-S), light blue boxplots are the soybean-soybean sequence (S-S) and the purple boxplots are the corn-soybean sequence (C-S). Quantitative comparison of cumulative bulk soil and rhizosphere samples of: (A) bacterial species richness measure of observed OTUs (B) bacterial Shannon Index Diversity measure of alpha diversity (C) fungal species richness measure of observed OTUs (D) fungal Shannon Index Diversity measure of alpha diversity. Statistical significance was analyzed by the Kruskal-Wallis test. Asterisks indicate statistically significance (P < 0.05).
FIGURE 7
FIGURE 7
Stacked bar plots of bacterial taxonomic composition showing shifts in bacterial classes in response to crop sequence treatments, during the soybean growing season in the bulk soil and soybean rhizosphere soil. Each bar represents an average of three biological replicates. OTUs with similar species-level identity at 99% similarity in the Greengenes database are merged here. Taxa with less than 1% mean relative abundance across the samples studied are combined and shown as Others. Bar plots of bulk soil treatments of the relative abundance at the pre-seeding, V6, and R1 growth stages; as well as bar plots of the soybean rhizosphere soil of the relative abundance at the V6 and R1 growth stages are presented.
FIGURE 8
FIGURE 8
Stacked bar plots of fungal taxonomic composition showing shifts in fungal class in response to crop sequence and over the soybean growing season in the bulk soil and rhizosphere soil. Each bar represents an average of three biological replicates. OTUs with similar species-level identity at 97% similarity in the UNITE database are merged. Taxa with less than 1% mean relative abundance across the samples studied are combined and shown as Others. Bar plots of bulk soil treatments of the relative abundance at the pre-seeding, V6, and R1 growth stages; as well as bar plots of the soybean rhizosphere soil of the relative abundance at the V6 and R1 growth stages are presented.

Similar articles

Cited by

References

    1. Agomoh I. V., Drury C. F., Phillips L. A., Reynolds W. D., Yang X. (2020). Increasing crop diversity in wheat rotations increases yields but decreases soil health. Soil Sci. Soc. Am. J. 84 170–181. 10.1002/saj2.20000 - DOI
    1. Aguirre-von-Wobeser E., Rocha-Estrada J., Shapiro L. R., de la Torre M. (2018). Enrichment of Verrucomicrobia, Actinobacteria and Burkholderiales drives selection of bacterial community from soil by maize roots in a traditional milpa agroecosystem. PLoS One 13:e0208852. 10.1371/journal.pone.0208852 - DOI - PMC - PubMed
    1. Ai C., Zhang S., Zhang X., Guo D., Zhou W., Huang S. (2018). Distinct responses of soil bacterial and fungal communities to changes in fertilization regime and crop rotation. Geoderma 319 156–166. 10.1016/j.geoderma.2018.01.010 - DOI
    1. Ashworth A. J., DeBruyn J. M., Allen F. L., Radosevich M., Owens P. R. (2017). Microbial community structure is affected by cropping sequences and poultry litter under long-term no-tillage. Soil Biol. Biochem. 114 210–219. 10.1016/j.soilbio.2017.07.019 - DOI
    1. Beirinckx S., Viaene T., Haegeman A., Debode J., Amery F., Vandenabeele S., et al. (2020). Tapping into the maize root microbiome to identify bacteria that promote growth under chilling conditions. Microbiome 8:54. 10.1186/s40168-020-00833-w - DOI - PMC - PubMed

LinkOut - more resources