. 2021 Feb 12:12:633649.
doi: 10.3389/fmicb.2021.633649. eCollection 2021.

Microbial Communities Under Distinct Thermal and Geochemical Regimes in Axial and Off-Axis Sediments of Guaymas Basin

Affiliations

Microbial Communities Under Distinct Thermal and Geochemical Regimes in Axial and Off-Axis Sediments of Guaymas Basin

Andreas Teske et al. Front Microbiol. .

Abstract

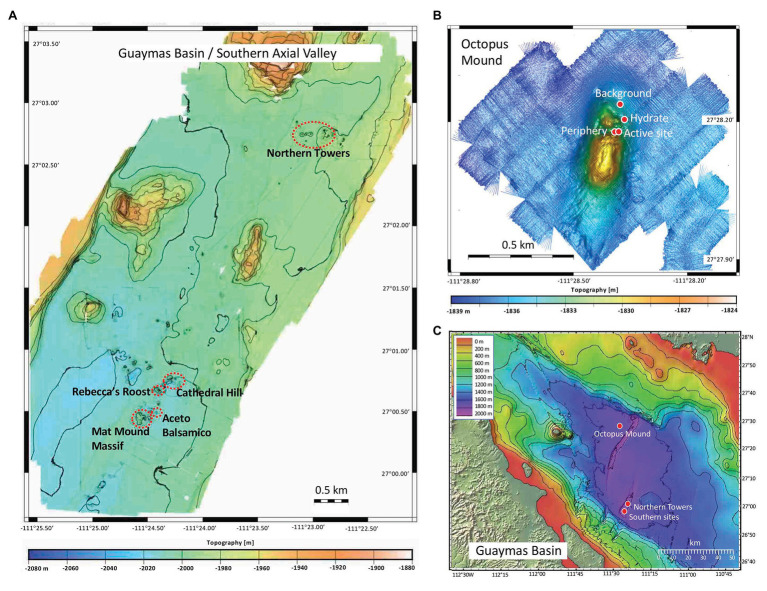
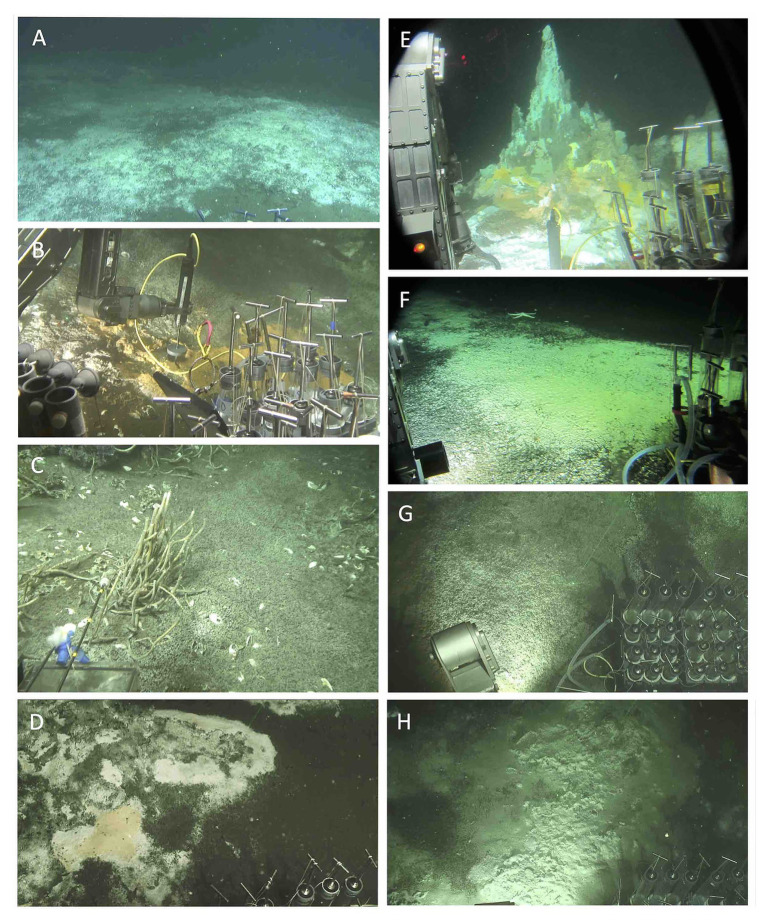
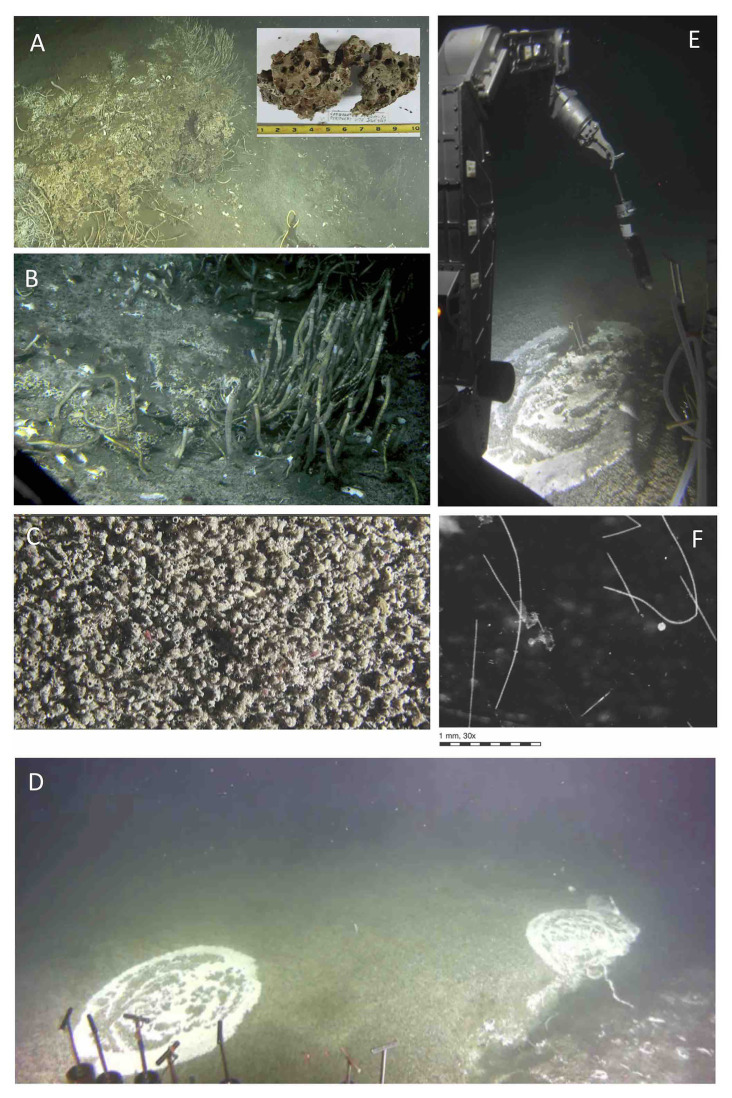
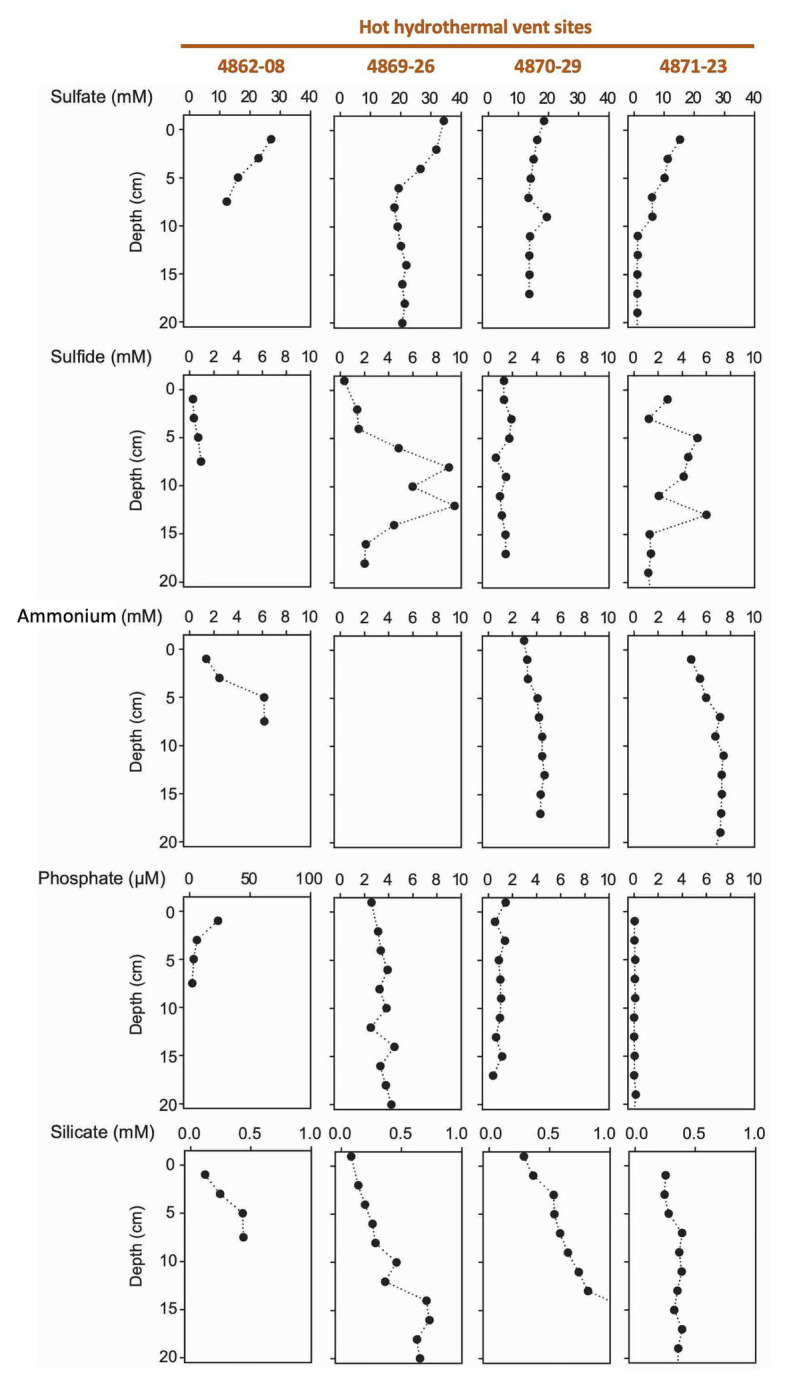
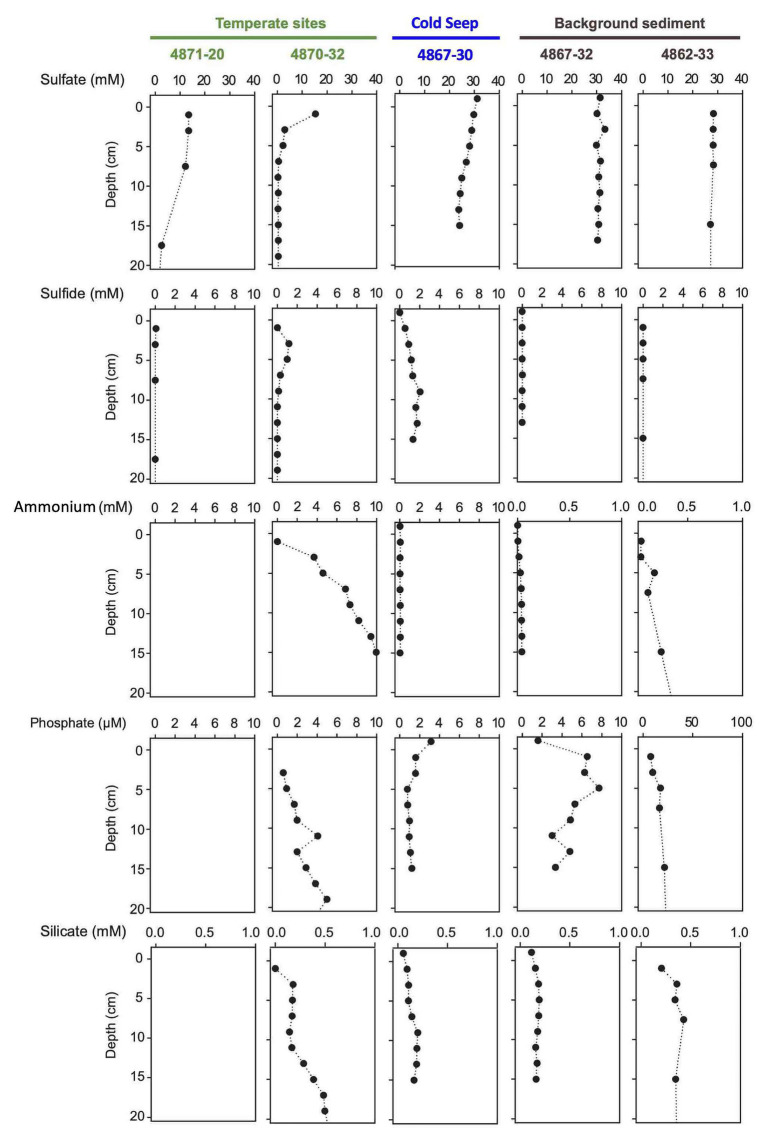
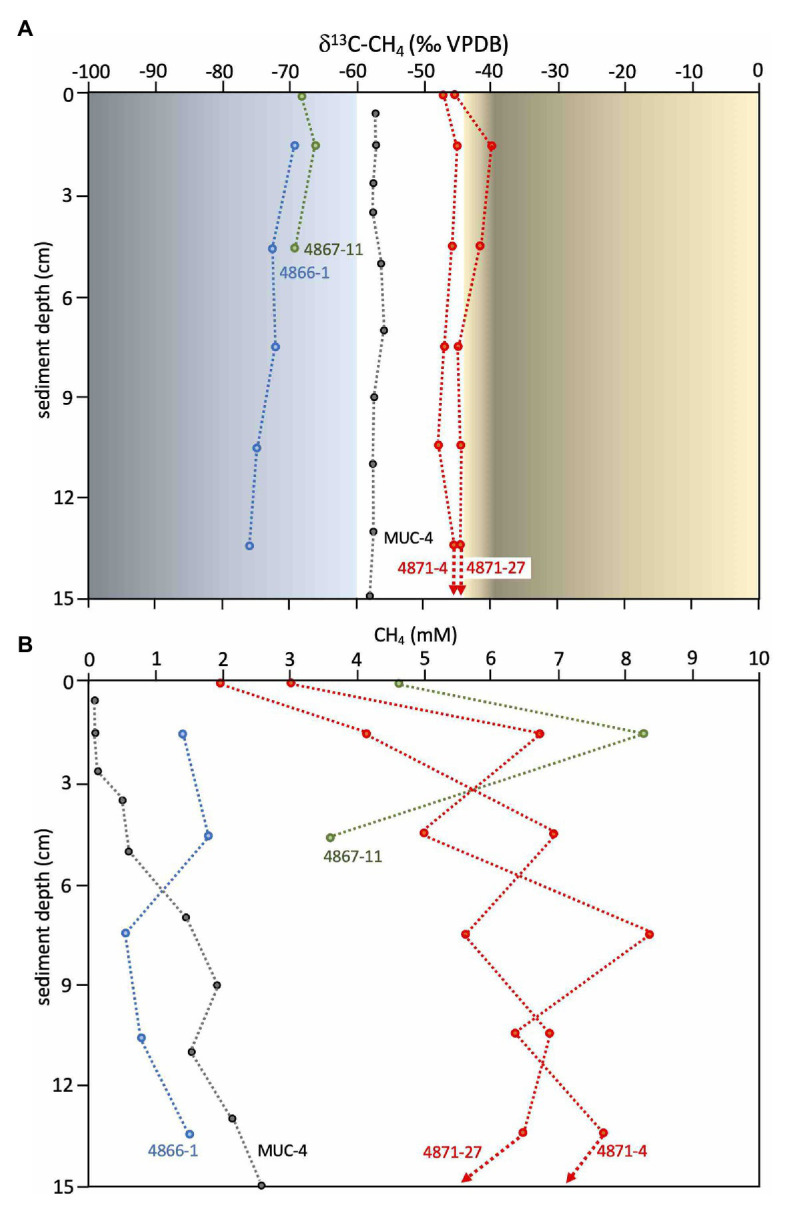
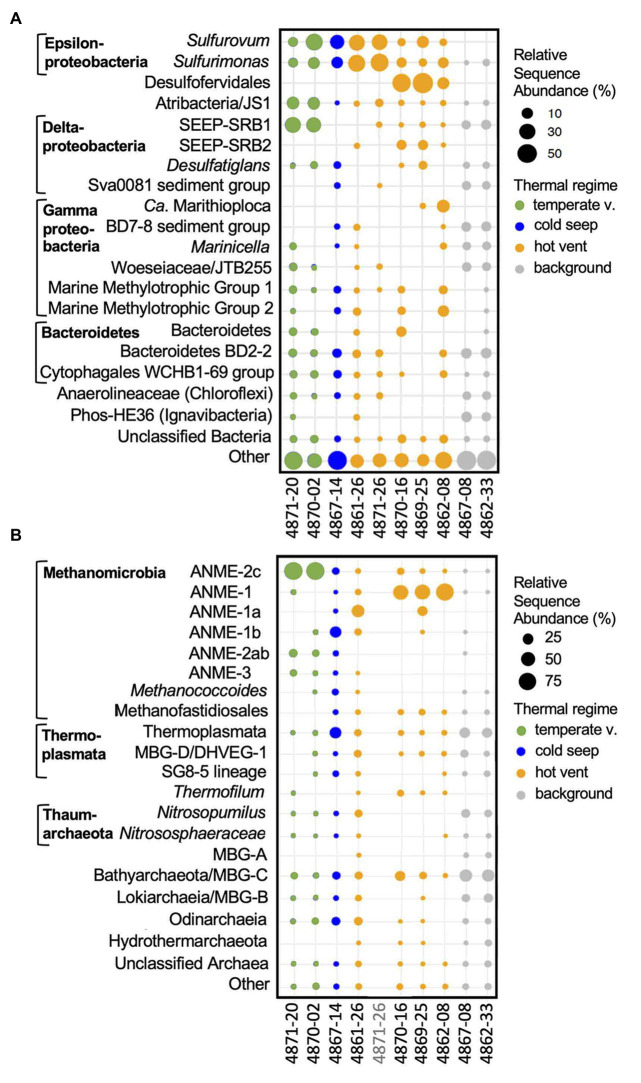
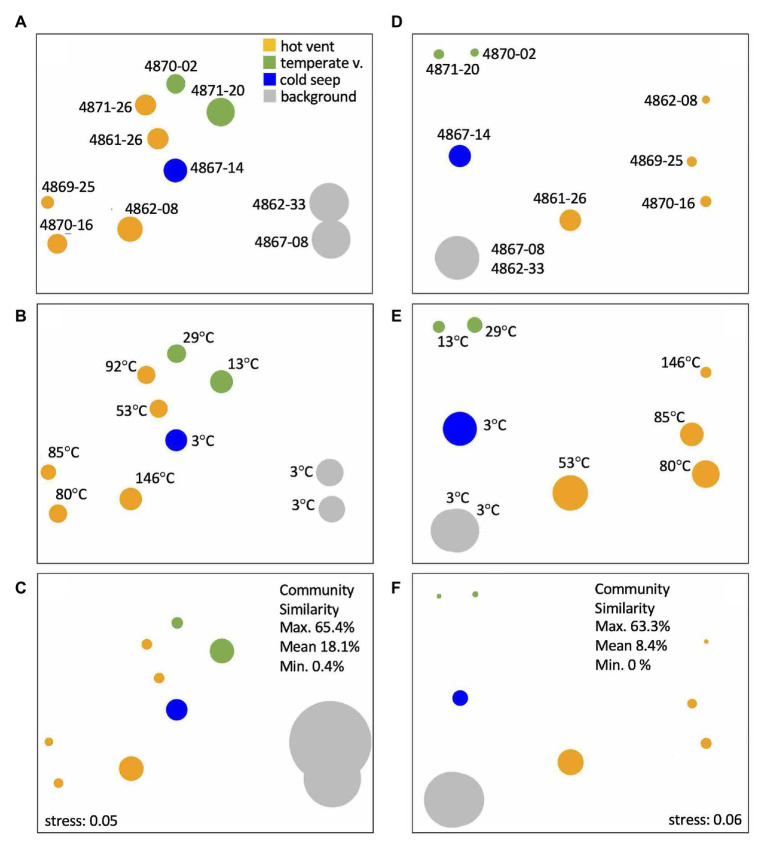
Cold seeps and hydrothermal vents are seafloor habitats fueled by subsurface energy sources. Both habitat types coexist in Guaymas Basin in the Gulf of California, providing an opportunity to compare microbial communities with distinct physiologies adapted to different thermal regimes. Hydrothermally active sites in the southern Guaymas Basin axial valley, and cold seep sites at Octopus Mound, a carbonate mound with abundant methanotrophic cold seep fauna at the Central Seep location on the northern off-axis flanking regions, show consistent geochemical and microbial differences between hot, temperate, cold seep, and background sites. The changing microbial actors include autotrophic and heterotrophic bacterial and archaeal lineages that catalyze sulfur, nitrogen, and methane cycling, organic matter degradation, and hydrocarbon oxidation. Thermal, biogeochemical, and microbiological characteristics of the sampling locations indicate that sediment thermal regime and seep-derived or hydrothermal energy sources structure the microbial communities at the sediment surface.

Keywords: Guaymas Basin; archaea; bacteria; cold seep; hydrothermal sediment; porewater profiles.


Conflict of interest statement

The authors declare that the research was conducted in the absence of any commercial or financial relationships that could be construed as a potential conflict of interest.

Figures

Figure 1
Figure 1
Bathymetric maps of Guaymas Basin and Expedition AT37-06 sampling locations. (A) Guaymas Basin southern axial valley, mapped during Sentry dives 407-409 and 413-417. (B) Central Seep area with Octopus Mound, mapped during Sentry dive 412. (C) Guaymas Basin overview annotated with sampling sites, based on a template courtesy of C. Mortera, UNAM.
Figure 2
Figure 2
Sampling sites for microbial and/or biogeochemical analyses. (A) Extensive white mat at Mat Mound Massif. Dive 4861. (B) Hydrothermal sediment with orange Beggiatoaceae mat, Mat Mound Massif. Dive 4862. (C) Cold seep site “active site” at Octopus Mound. Dive 4867. (D) Hydrothermal sediment with orange Beggiatoaceae mat at Mat Mound Massif. Dive 4869. (E) Summit and slopes at Cathedral Hill. The cores are from the white, fluffy mat area at the bottom of the photo. Dive 4870. (F) Temperate Aceto Balsamico mat with lime-yellow sulfur precipitates. Dive 4870. (G) Temperate “site 2” mat-covered sediment at Northern Towers. Dive 4871. (H) Hot “site 3” mat-covered hydrothermal sediment at Northern Towers. Dive 4871. The sites were photographed from inside Alvin (dives 4862, 4867, 4870) or documented as Alvin screen grabber images (dives 4861, 4869, 4871). Images courtesy of Alvin group, WHOI.
Figure 3
Figure 3
Benthic fauna at Octopus Mound sampling sites. (A) Seafloor carbonate concretions with tube worms at the “active site” near the base of Octopus Mound. Insert, carbonate sample collected at this location during Alvin dive 4867. (B) Seep community with different types of tubeworms resembling Lamellibrachia, galatheid crabs, and clam shells. The original image was underexposed and had to be digitally manipulated, resulting in over-emphasized steel-blue hues instead of olive-green and brown tones. (C) Close-up view of ampharetid worm carpet, with pink worms protruding from several worm tubes. Overall view ~10 × 20cm; video still from Alvin’s bottom camera. (D) Sedimented Hydrate mound, overgrown with an extensive mat of ampharetid worms and circular spots of Beggiatoaceae mats. At the massive fracture to the right, the mat-covered sediment is ca. 0.5m elevated, suggesting rising hydrate underneath. The Beggiatoaceae mat to the left was sampled with Alvin push cores. (E) Coring the Beggiatoaceae mat on top of the hydrate mound during dive 4867, the “hydrate site.” The bottom of the freshly collected core contains white gas hydrate (presumably methane hydrate) that dissipates during transport to the surface. (F) Individual Beggiatoaceae filaments recovered from the hydrate mat are viewed through a dissection binocular. Filament diameters are in the range of 100–160μm, consistent with large, colorless Beggiatoaceae observed previously in Guaymas Basin (McKay et al., 2012; Teske and Salman, 2014). Images A–E courtesy of the Alvin group, WHOI; dissection scope image of filaments by Barbara MacGregor.
Figure 4
Figure 4
Porewater concentration profiles of sulfate, sulfide, ammonium, phosphate, and silicate in four hydrothermal cores.
Figure 5
Figure 5
Porewater concentration profiles of sulfate, sulfide, ammonium, phosphate, and silicate in two temperate cores, one seep core, and two background cores without visible microbial mats. Empty panels indicate data gaps.
Figure 6
Figure 6
Methane isotopic values and concentrations. (A) Methane δ13CH4 values (VPDB) for Octopus Mound cores 4866-1 (active site, in blue) and 4867-11 (hydrate site, in green), and the nearby sediment push core MUC-4 (black), previously collected and measured independently at Central Seep (Geilert et al., 2018). Methane δ13CH4 values (VPDB) for hydrothermal cores from the Northern Towers area (4871-4 and 4871-27) are plotted in red. Orange shading indicates the range of δ13CH4 values for thermogenic methane in hydrothermal sediments in the southern Guaymas axial valley (McKay et al., 2016). Blue shading indicates the range of δ13CH4 values for microbially produced methane in cold sediments of the Sonora Margin (Vigneron et al., 2015, Teske et al., 2019), delimited at 60‰ based on Schoell (1982) and Simoneit et al. (1986). (B) Methane concentrations for the same samples. Data points for supernatant samples are plotted at 0cm depth. δ13CH4 values and their standard deviations, and methane concentrations are tabulated in Supplementary Table S4.
Figure 7
Figure 7
Bacterial and archaeal community composition of Guaymas Basin sediment cores. The size of the dots indicates the relative sequence abundance of microbial clades based on 16S rRNA gene amplicon sequences. The 20 most abundant bacterial (A) and archaeal (B) family-level lineages are shown. Less abundant clades are summarized as “Other.” When appropriate, taxa are annotated to supplement the automated SILVA identifications. DNA from core 4871-26 had run out after several sequencing attempts before archaeal sequencing could be finalized.
Figure 8
Figure 8
Non-metric multidimensional scaling (NMDS) ordination plots based on 16S rRNA gene amplicons for bacterial operational taxonomic units (OTUs; A-C) and archaeal amplicon sequence variants (ASVs; D-F) from the upper cm of sediment cores, color-coded by geochemical cluster, and annotated with core number (A,D) and in situ temperature at 50cm depth (B,E). In plots (A,D), circle size represents observed OTU richness. In plots (B,E), circle size represents Shannon entropy. In plots (C,F), circle size represents Inverse Simpson evenness.
Figure 9
Figure 9
Maximum likelihood phylogeny of gammaproteobacterial methylotrophic and methanotrophic bacterial OTUs. The tree was calculated using near full-length sequences; partial 16S rRNA gene sequences (ca. 450 nucleotide positions) obtained with primers 341F and Pro805 were added without changing the tree topology. The Methyloprofundus branch is synonymous with Marine Methylotroph Group 1 (MMG1), a sister lineage to MMG2 and MMG3. Sequences used for the phylogeny are listed in Supplementary Table S5 for easy retrieval.
Figure 10
Figure 10
Maximum likelihood phylogeny of ANME-1 archaea and related ANMEs and methanogens. The tree was calculated using near full-length sequences; partial 16S rRNA gene sequences (ca. 450 nucleotide positions) obtained with primers 517F and 958R were added without changing the tree topology. The annotation numbers in parentheses indicate the number of representative ASVs for different clades. Sequences used for the phylogeny are listed in Supplementary Table S5 for easy retrieval.
Figure 11
Figure 11
Distance phylogeny of mcrA genes recovered from Octopus Mound sediments. Taxon labels begin with the Genbank number, followed by the Alvin Dive and core number, and (if applicable) the number of multiple clones from the same location and core that is represented by this sequence. Additional mcrA genes come from Ringvent sediments sampled during Alvin dive 4864 (Teske et al., 2019). Bootstrap numbers were obtained by 500 replicates.

Similar articles

Cited by

References

    1. Beaulieu S. E., Szafranski K. M. (2020). InterRidge Global Database of active submarine hydrothermal vent fields. Version 3.4. PANGAEA. 10.1594/PANGAEA.917894 - DOI
    1. Berndt C., Hensen C., Mortera-Gutierrez C., Sarkar S., Geilert S., Schmidt M., et al. . (2016). Rifting under steam – how magmatism triggers methane venting from sedimentary basins. Geology 44, 767–770. 10.1130/G38049.1 - DOI
    1. Biddle J. F., Cardman Z., Mendlovitz H., Albert D. B., Lloyd K. G., Boetius A., et al. . (2012). Anaerobic oxidation of methane at different temperature regimes in Guaymas Basin hydrothermal sediments. ISME J. 6, 1018–1031. 10.1038/ismej.2011.164, PMID: - DOI - PMC - PubMed
    1. Bray J. R., Curtis J. T. (1957). An ordination of the upland forest communities of southern Wisconsin. Ecol. Monogr. 27, 326–349.
    1. Buckley A., MacGregor B. J., Teske A. (2019). Identification, expression and activity of candidate nitrite reductases from orange Beggiatoaceae, Guaymas Basin. Front. Microbiol. 10:644. 10.3389/fmicb.2019.00644, PMID: - DOI - PMC - PubMed

LinkOut - more resources