

Low Levels of Natural Anti-α- N-Acetylgalactosamine (Tn) Antibodies Are Associated With COVID-19
- PMID: 33643275
- PMCID: PMC7905038
- DOI: 10.3389/fmicb.2021.641460
Low Levels of Natural Anti-α- N-Acetylgalactosamine (Tn) Antibodies Are Associated With COVID-19
Abstract
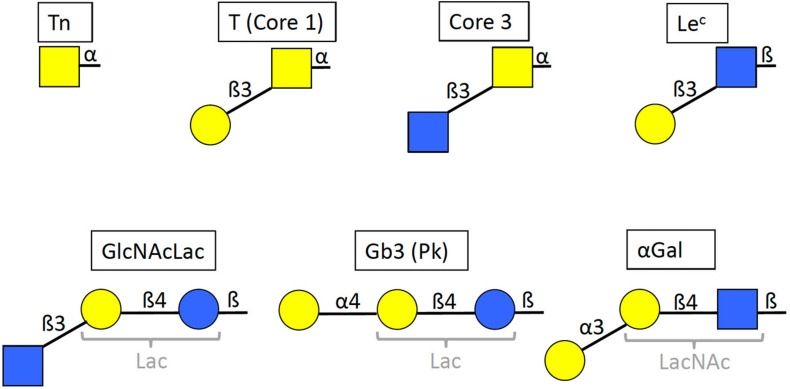
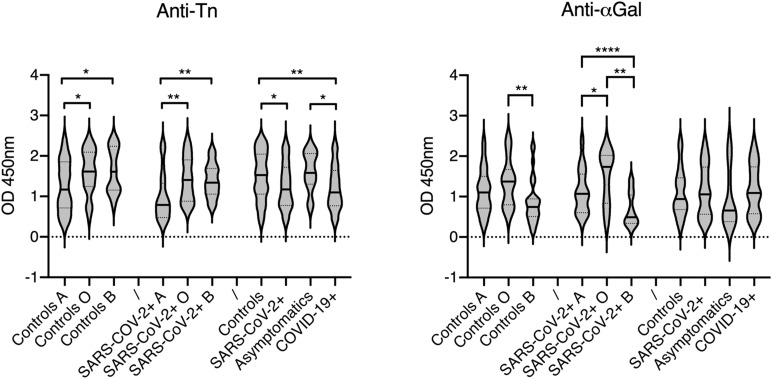
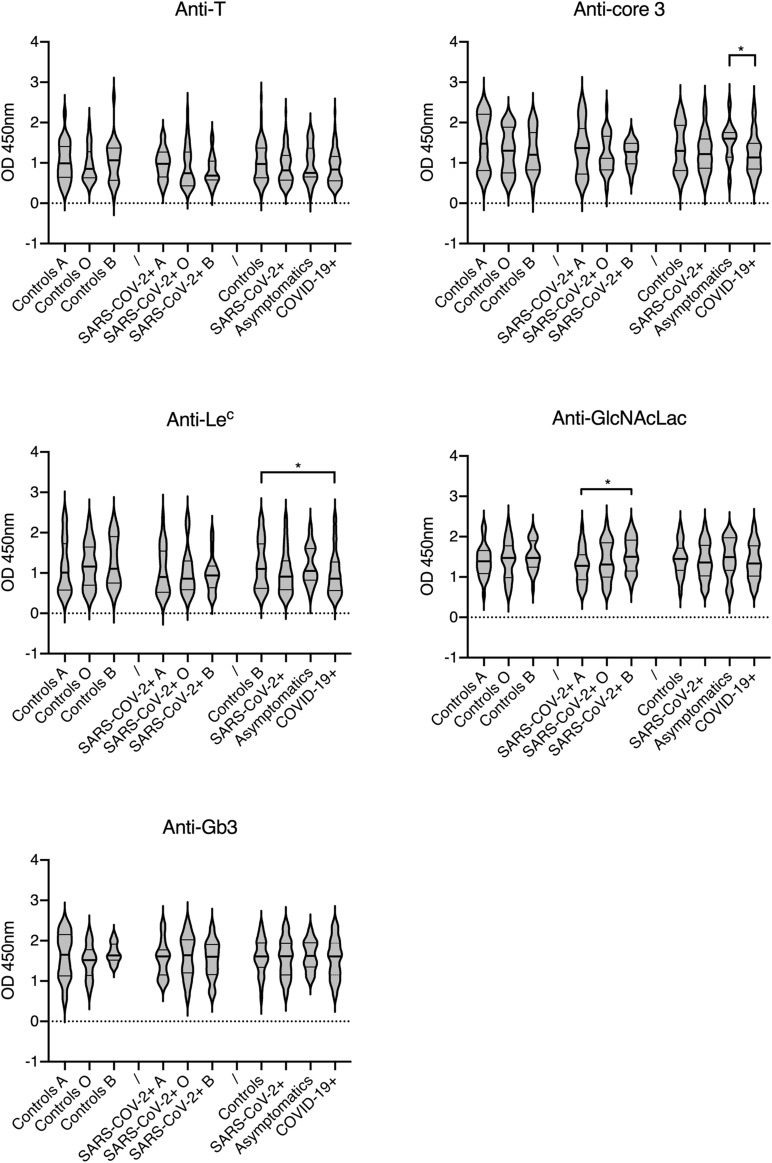
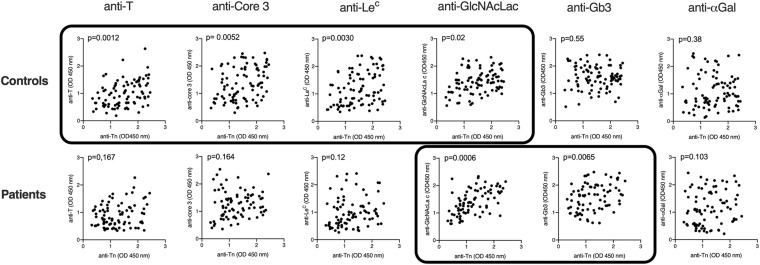
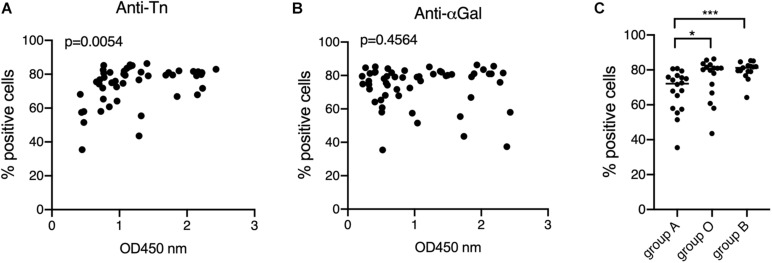
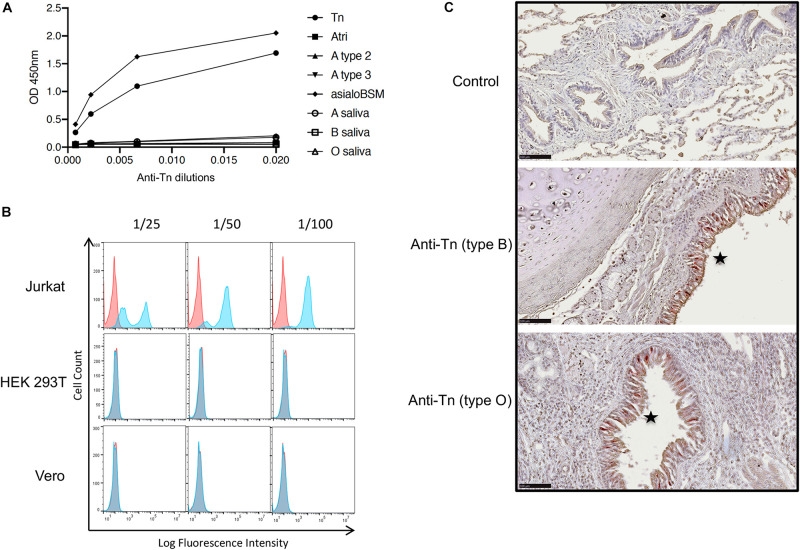
Human serum contains large amounts of anti-carbohydrate antibodies, some of which may recognize epitopes on viral glycans. Here, we tested the hypothesis that such antibodies may confer protection against COVID-19 so that patients would be preferentially found among people with low amounts of specific anti-carbohydrate antibodies since individual repertoires vary considerably. After selecting glycan epitopes commonly represented in the human anti-carbohydrate antibody repertoire that may also be expressed on viral glycans, plasma levels of the corresponding antibodies were determined by ELISA in 88 SARS-CoV-2 infected individuals, including 13 asymptomatic, and in 82 non-infected controls. We observed that anti-Tn antibodies levels were significantly lower in patients as compared to non-infected individuals. This was not observed for any of the other tested carbohydrate epitopes, including anti-αGal antibodies used as a negative control since the epitope cannot be synthesized by humans. Owing to structural homologies with blood groups A and B antigens, we also observed that anti-Tn and anti-αGal antibodies levels were lower in blood group A and B, respectively. Analyses of correlations between anti-Tn and the other anti-carbohydrates tested revealed divergent patterns of correlations between patients and controls, suggesting qualitative differences in addition to the quantitative difference. Furthermore, anti-Tn levels correlated with anti-S protein levels in the patients' group, suggesting that anti-Tn might contribute to the development of the specific antiviral response. Overall, this first analysis allows to hypothesize that natural anti-Tn antibodies might be protective against COVID-19.
Keywords: COVID-19; O-glycans; Tn antigen; histo-blood group antigens; natural antibodies.
Copyright © 2021 Breiman, Ruvoën-Clouet, Deleers, Beauvais, Jouand, Rocher, Bovin, Labarrière, El Kenz and Le Pendu.
Conflict of interest statement
The authors declare that the research was conducted in the absence of any commercial or financial relationships that could be construed as a potential conflict of interest.
Figures
Similar articles
-
COVID-19 and blood group-related antigens: can natural anti-carbohydrate antibodies provide innate protection from symptomatic SARS-CoV-2 infection?Front Med (Lausanne). 2025 Apr 30;12:1554785. doi: 10.3389/fmed.2025.1554785. eCollection 2025. Front Med (Lausanne). 2025. PMID: 40370735 Free PMC article.
-
IgG immune response to tumor-associated carbohydrate antigens (TF, Tn, alphaGal) in patients with breast cancer: impact of neoadjuvant chemotherapy and relation to the survival.Exp Oncol. 2005 Jun;27(2):136-40. Exp Oncol. 2005. PMID: 15995632
-
Specificity of human natural antibodies referred to as anti-Tn.Mol Immunol. 2020 Apr;120:74-82. doi: 10.1016/j.molimm.2020.02.005. Epub 2020 Feb 19. Mol Immunol. 2020. PMID: 32087569
-
Early ovariectomy reveals the germline encoding of natural anti-A- and Tn-cross-reactive immunoglobulin M (IgM) arising from developmental O-GalNAc glycosylations. (Germline-encoded natural anti-A/Tn cross-reactive IgM).Cancer Med. 2017 Jul;6(7):1601-1613. doi: 10.1002/cam4.1079. Epub 2017 Jun 5. Cancer Med. 2017. PMID: 28580709 Free PMC article. Review.
-
Host Synthesized Carbohydrate Antigens on Viral Glycoproteins as "Achilles' Heel" of Viruses Contributing to Anti-Viral Immune Protection.Int J Mol Sci. 2020 Sep 13;21(18):6702. doi: 10.3390/ijms21186702. Int J Mol Sci. 2020. PMID: 32933166 Free PMC article. Review.
Cited by
-
COVID-19 and blood group-related antigens: can natural anti-carbohydrate antibodies provide innate protection from symptomatic SARS-CoV-2 infection?Front Med (Lausanne). 2025 Apr 30;12:1554785. doi: 10.3389/fmed.2025.1554785. eCollection 2025. Front Med (Lausanne). 2025. PMID: 40370735 Free PMC article.
-
Cancer cells and viruses share common glycoepitopes: exciting opportunities toward combined treatments.Front Immunol. 2024 Mar 1;15:1292588. doi: 10.3389/fimmu.2024.1292588. eCollection 2024. Front Immunol. 2024. PMID: 38495885 Free PMC article. Review.
-
Anti-GalNAcα (anti-Tn) antibody repertoire differs between individuals with blood groups A and B.Glycoconj J. 2025 Aug;42(3-4):137-146. doi: 10.1007/s10719-025-10184-z. Epub 2025 Apr 26. Glycoconj J. 2025. PMID: 40285953
-
Lower Levels of ABO Anti-A and Anti-B of IgM, IgG and IgA Isotypes in the Serum but Not the Saliva of COVID-19 Convalescents.J Clin Med. 2022 Aug 2;11(15):4513. doi: 10.3390/jcm11154513. J Clin Med. 2022. PMID: 35956128 Free PMC article.
-
MicroGlycoDB: A database of microbial glycans using Semantic Web technologies.BBA Adv. 2024 Nov 30;6:100126. doi: 10.1016/j.bbadva.2024.100126. eCollection 2024. BBA Adv. 2024. PMID: 39720162 Free PMC article.
References
-
- Aktimur S. H., Sen H., Yazicioglu B., Gunes A. K., Genc S. (2020). The assessment of the relationship between ABO blood groups and Covid-19 infection. Int. J. Hematol. Oncol. 30 121–125. 10.4999/uhod.204348 - DOI
-
- Aljanobi G., Alhajjaj A., Alkhabbaz F., Al-Jishi J. (2020). The relationship between ABO blood group type and the covid-19 susceptibility in qatif central hospital, eastern province, saudi arabia: a retrospective cohort study. Open J. Intern. Med. 10 232–238. 10.4236/ojim.2020.102024 - DOI
LinkOut - more resources
Full Text Sources
Other Literature Sources
Molecular Biology Databases
Miscellaneous