. 2021 Feb 12:11:547102.
doi: 10.3389/fimmu.2020.547102. eCollection 2020.

Optimized Culture Conditions for Improved Growth and Functional Differentiation of Mouse and Human Colon Organoids

Affiliations

Optimized Culture Conditions for Improved Growth and Functional Differentiation of Mouse and Human Colon Organoids

Sarah S Wilson et al. Front Immunol. .

Abstract

Background & aims: Diligent side-by-side comparisons of how different methodologies affect growth efficiency and quality of intestinal colonoids have not been performed leaving a gap in our current knowledge. Here, we summarize our efforts to optimize culture conditions for improved growth and functional differentiation of mouse and human colon organoids.

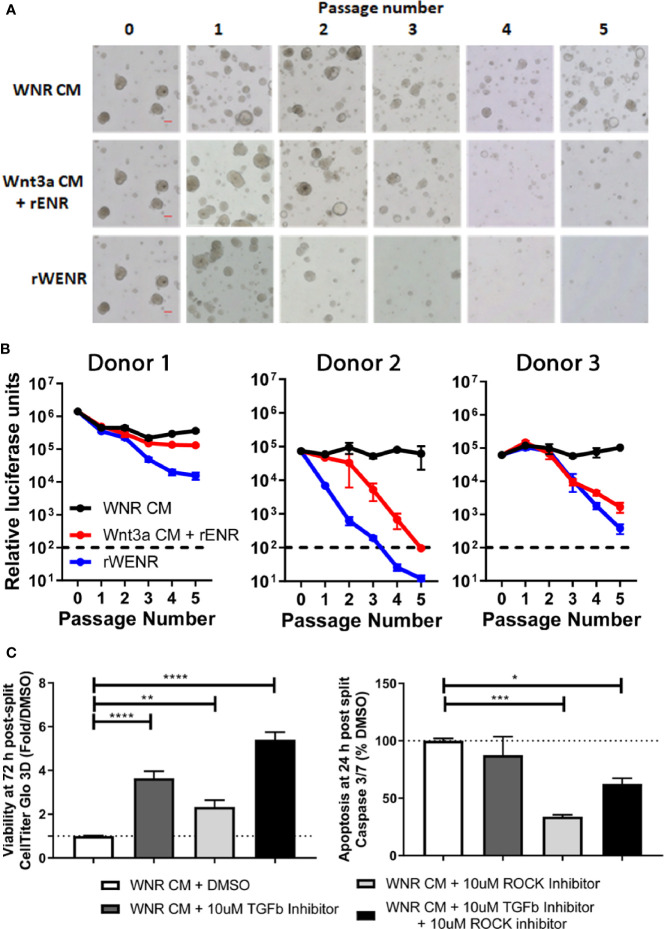
Methods: Mouse and human colon organoids were grown in four different media. Media-dependent long-term growth was measured by quantifying surviving organoids via imaging and a cell viability readout over five passages. The impact of diverse media on differentiation was assessed by quantifying the number of epithelial cell types using markers for enterocytes, stem cells, Goblet cells, and enteroendocrine cells by qPCR and histology upon removal of growth factors.

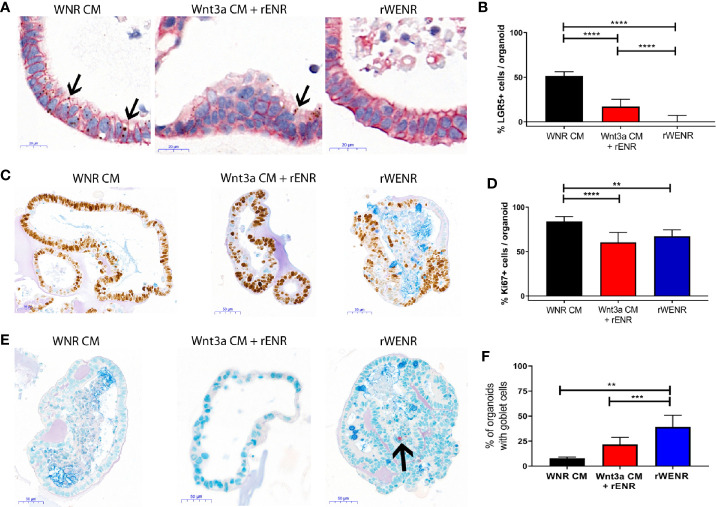
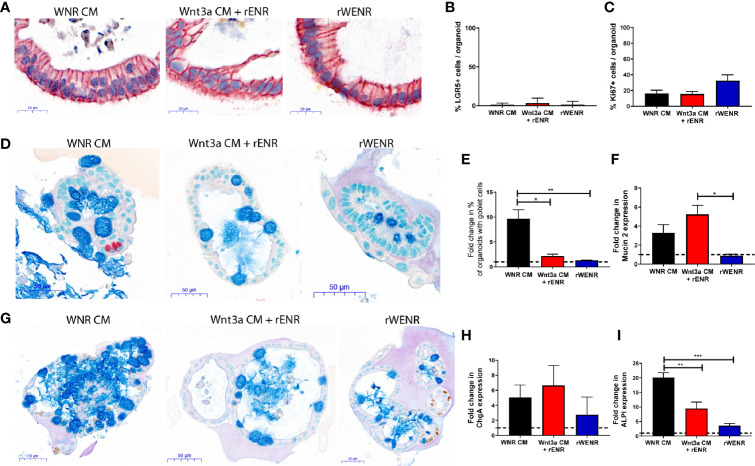
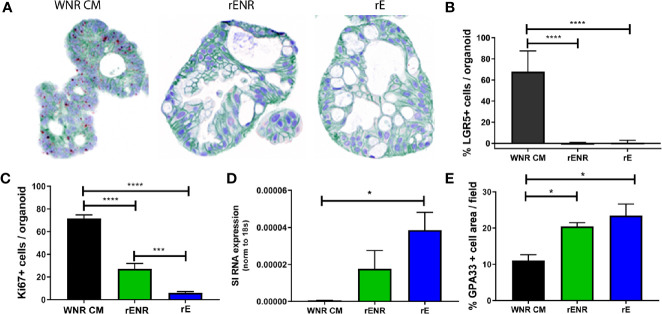
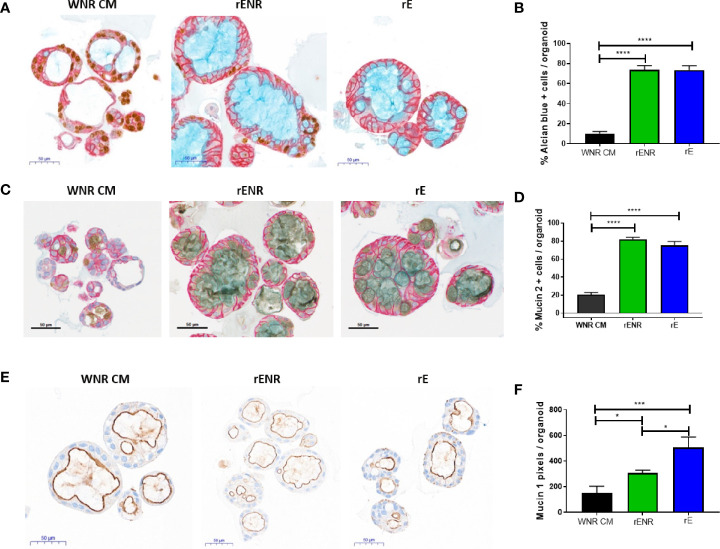
Results: In contrast to Wnt3a-conditioned media, media supplemented with recombinant Wnt3a alone did not support long-term survival of human or mouse colon organoids. Mechanistically, this observation can be attributed to the fact that recombinant Wnt3a did not support stem cell survival or proliferation as demonstrated by decreased LGR5 and Ki67 expression. When monitoring expression of markers for epithelial cell types, the highest level of organoid differentiation was observed after combined removal of Wnt3a, Noggin, and R-spondin from Wnta3a-conditioned media cultures.

Conclusion: Our study defined Wnt3a-containing conditioned media as optimal for growth and survival of human and mouse organoids. Furthermore, we established that the combined removal of Wnt3a, Noggin, and R-spondin results in optimal differentiation. This study provides a step forward in optimizing conditions for intestinal organoid growth to improve standardization and reproducibility of this model platform.

Keywords: Goblet cells; Wnt3 signaling; adult stem cells; colonoids; differentiation; enteroids; intestinal epithelial cells; intestinal organoids.


Conflict of interest statement

All authors are employees of AbbVie. The design, study conduct, and financial support for this research were provided by AbbVie. AbbVie participated in the interpretation of data, review, and approval of the publication.

Figures

Figure 1
Figure 1
Side-by-side culture comparisons demonstrate a crucial role of Wnt3a-conditioned media for the long-term survival of mouse colonoids. Survival of mouse colonoids derived from the crypts of C57Bl/6 mice was compared in different culture conditions over five passages. Media culture conditions from the top: Wnt3a-Noggin-Rspondin conditioned media (WNR CM), Wnt3a-conditioned media supplemented with recombinant EGF, Noggin and R-spondin (Wnt3a CM + rENR), media with recombinant Wnt3a, EGF, Noggin, and R-spondin (rWENR), and media with recombinant EGF, Noggin, and R-spondin but no recombinant Wnt3a (rENR). (A) Representative 4x bright field images for each growth condition medium at every passage. Scale bars indicate 100 microns. (B, C) Colonoid-forming efficiency was assessed before each passage using (B) the Cell Titer-Glo 3D luminescent cell viability assay or (C) counting the number of colonoids per visual field. In B, 3 wells of colonoids were quantified at every passage and in A, images were taken and quantified from 4 wells of colonoids at every passage. Error bars represent the average of the 3 or 4 wells, and representative images and survival from two independent experiments is shown.
Figure 2
Figure 2
Comparative analysis of culture conditions shows that recombinant Wnt3a does not support maintenance and propagation of stem cells in mouse colonoids. Mouse colonoids derived from the crypts of C57Bl/6 mice were cultured for six days in WNR CM, Wnt3a CM + rENR, or rWENR medium and analyzed for phenotypic alterations, proliferation, goblet cell numbers, and Wnt signaling activity using the following readouts: (A, B) Colonoids were stained with in situ hybridization for LGR5 for the quantification of stem cells (brown dots), immunohistochemistry for EpCam to stain all epithelial cells, and nuclei stained with hematoxylin; Arrows indicate LGR5 positive areas (C, D) immunohistochemistry and quantification of Ki67 as a proliferation marker, with an Alcian Blue counterstain (mucus and Goblet cells); (E, F) immunohistochemistry for Chromogranin A (enteroendocrine cells) and Alcian Blue counterstain (mucus and Goblet cells). Arrow indicates a Chromogranin A positive cell. All representative images were taken at 20x. Scale bars in (A) indicate 20 microns and in (C, E) indicate 50 microns. Manual quantification of each measure was performed on an average of 30 colonoids per slide, and error bars and IHC/ISH images are representative of the average of biological duplicates from three independent experiments. Statistical significance was determined by one-way ANOVA. **P < 0.01, ***P < 0.005, ****P < 0.001.
Figure 3
Figure 3
Switching culture conditions from Wnt3a-conditioned medium to Wnt3a free medium induces most efficient differentiation of mouse colonoids. Mouse colonoids derived from C57Bl/6 mice crypts were cultured for two days in WNR CM, Wnt3a CM + rENR or rWENR medium before medium change to rENR or maintenance in original media. After four additional days of culture, colonoids were assayed for markers of epithelial cell types by ISH/IHC and qPCR. (A, B) Colonoids were stained with in situ hybridization for LGR5 for the quantification of stem cells (brown dots), immunohistochemistry for EpCam (epithelial cells) and hematoxylin (nuclei); (C) Quantification of Ki67 histochemistry for measurement of proliferation; (D) immunohistochemistry for Chromogranin A (enteroendocrine cells) and Alcian Blue counterstain (mucus and Goblet cells); (E) quantification of goblet cells; (F) quantification of Mucin 2 mRNA levels; (G) immunohistochemistry of Ki67 as a proliferation marker, with an Alcian Blue counterstain (mucus and Goblet cells); (H) quantification of chromogranin A immunohistochemistry; (I) quantification of enterocytes using mRNA transcript levels of alkaline phosphatase (ALPI). qPCR analysis was performed on biological triplicates for each treatment group at each timepoint. Graphs in (B, C) are the average expression by IHC/ISH of the indicated markers in the stem cell conditions from three independent studies. Graphs in (E, F, H, I) are the average fold increase in markers by IHC (E) or qPCR (F, H, I) after differentiation compared to levels in the stem cell conditions from three independent experiments. Scale bars in A indicate 20 microns and in C and E indicate 50 microns. IHC/ISH quantification was performed on an average of 30 colonoids per slide. Graphs and images are representative of the average of biological duplicates from three independent experiments. Statistical significance was determined by one-way ANOVA. *P < 0.05, **P < 0.01, ***P < 0.005.
Figure 4
Figure 4
Histological characterization of mouse and human colons. Distal and Mid colons were collected from naïve male C57BL/6N mice and paraffin-embedded for staining. Serial sections were stained for [(A) (distal colon) and B (mid colon), from left to right] H&E, In situ hybridization for LGR5 as a stem cell marker (black dots at base of crypt) with Alcian blue counterstain for mucus and nuclei, the proliferation marker Ki67 with hematoxylin counterstain (nuclei), dual Immunohistochemistry for Gob5/CLCA1 to label a subset of Goblet cells (dark brown) and GPA33 for epithelial cells (red) was counterstained with Alcian blue-PAS to capture all goblet cells. In (A, B), representative 20x images are shown and scale bars indicate 50 microns for all images except LGR5 ISH, where scale bars indicate 20 microns. Images in A are from the distal colon and images in (B) are from the mid colon. Stained mouse colons were used for automated quantification to determine the percent Ki67 positive area per mucosal area (C), percent goblet cell area per epithelial area (D), and percent LGR5 positive area per mucosal area (E). Each data point represents the quantification of an image from an individual mouse. Ranges and averages were similar across three independent experiments. Data from one representative study in nine naïve mice is shown. Statistical significance was determined by unpaired t-test. In (F), 20X images show representative staining of a colon from a healthy human for (from left to right) H&E, in situ hybridization for LGR5 (black dots) with hematoxylin counterstain (nuclei), Alcian blue to show Goblet cell content, immunohistochemistry for Mucin 2 counterstained with Alcian blue-PAS to capture all goblet cells, and immunohistochemistry for Mucin 1 (brown) with hematoxylin counterstain (nuclei). Scale bars indicate 50 microns for all images. ****P < 0.001.
Figure 5
Figure 5
Wnt conditions optimized in mouse colonoids allow for the long-term survival of human colonoids. Survival of human colonoids derived from three healthy donors was compared in different culture conditions over five passages. Media culture conditions from the top: Wnt3a-Noggin-Rspondin conditioned media (WNR CM), Wnt3a-conditioned media supplemented with recombinant EGF, Noggin and R-spondin (Wnt3a CM + rENR), and media with recombinant Wnt3a, EGF, Noggin, and R-spondin (rWENR). (A) Representative bright field images for each growth condition medium at every passage from colonoids derived from Donor 1. Scale bars indicate 100 microns. (B) Viability was assessed before each passage using the Cell Titer-Glo 3D luminescent cell viability assay in colonoid cultures from all three donors (WNR CM as black lines, Wnt3a CM + rENR as red lines, and rWENR medium as blue line). For each donor and treatment at each timepoint, 3 wells of colonoids were quantified by Cell Titer-Glo 3D and error bars represent the average. Representative images and survival from two independent experiments is shown. (C) Impact of TGFb inhibitor and ROCK inhibitor on organoid viability and apoptosis during splitting were assessed by Cell Titer-Glo 3D and Caspase-Glo 3/7 Assay, respectively. Data from Donor 2 is shown and is representative of studies done is Donor 1 and Donor 2. Error bars are representative of the average of biological triplicates from two independent experiments, one in Donor 1 and one in Donor 2. Statistical significance was determined by one-way ANOVA. *P < 0.05, **P < 0.01, ***P < 0.005, ****P < 0.001.
Figure 6
Figure 6
Switch from a proliferative to a differentiation program in human colonoids is achieved by the combined removal of Wnt3a, Noggin, and R-spondin in cultures. Human colonoids derived from the Donor 1 biopsy were cultured for one day in WNR CM, and either kept in this medium or switched to rENR and rE as differentiation culture condition. After 3 additional days, colonoids were assayed by histology and qPCR for proliferation and differentiation markers. (A) In situ hybridization for LGR5 (stem cells), immunohistochemistry for GPA33 (all epithelial cells) and Hematoxylin (nuclei) and (B) quantification of LGR5 positive stem cells; (C) Quantification of Ki67 immunohistochemistry (representative images of stain shown in A (D) Sucrose isomaltase mRNA transcript levels; (E) quantification of GPA33 positive cells area from images in (A). Error bars for qPCR are representative of biological triplicates from two independent studies. For automated analysis of LGR5, Ki67, and GPA33, data is the average number for three slides and is representative of two independent studies. For each slide, the average number was determined by collecting and analyzing 15 random 40x images (containing an average of 25 colonoids each) to determine % positive cells per colonoid or per image. Statistical significance was determined by one-way ANOVA.
Figure 7
Figure 7
Phenotypic characterization of mucus and goblet cells in human colonoids after removal of Wnt3a, Noggin, and R-spondin from cultures. Human colonoids derived from the Donor 1 biopsy were cultured for one day in WNR CM, and either kept in this medium or switched to rENR and rE as differentiation culture condition. After three additional days, phenotypic characterization of mucus and goblet cells was performed by histology and qPCR. (A) Immunohistochemistry for Ki67 (proliferation), GPA33 (all epithelial cells) and Alcian blue staining for goblet cells and mucus and (B) quantification of goblet cells; (C) Immunohistochemistry for Mucin 2, GPA33 (all epithelial cells) and Hematoxylin (nuclei); and (D) quantification of Mucin 2 positive Goblet cells; (E) Immunohistochemistry for Mucin 1 with Hematoxylin (nuclei) and (F) quantification of Mucin 1 positive cell area. For automated analysis of Alcian blue and Mucin 2 data is the average number for three slides and is representative of two independent studies. For each slide, the average number was determined by collecting and analyzing 15 random 40x images (containing an average of 25 colonoids each) to determine % positive cells per colonoid or per image. The Mucin 1 staining was defined as the area of Mucin 1 immunopositive pixels per colonoid area pixels after luminal white space was subtracted. Mucin 1 analysis was applied to the entire slide image, each of which contained an average of 570 colonoids. Scale bars indicate 50 microns. Statistical significance was determined by one-way ANOVA.
Figure 8
Figure 8
Organoids as a model for intestinal necroptosis. Human colon organoids derived from Donor 1 and Donor 3 were treated with either vehicle or TNFα 10 ng/ml + zVAD 80 uM + Smac 2 uM for 24 h. (A) pMLKL protein expression was assessed by western blot analysis. Representative blots probed for pMLKL and β-actin obtained with Donor 1 are shown. Densitometric analysis was performed from five independent experiments, four in Donor 1 and one in Donor 3. Data is expressed as mean ± SEM and shows unpaired t-test; (B) Cell viability was assessed by 4X bright field imaging and CellTiter-Glo 3D luminescent assay. Representative images obtained with Donor 1 are shown. Scale bars indicate 100 microns. Data in graph is expressed as mean ± SEM and shows unpaired t-test from six independent experiments, four in Donor 1 and two in Donor 3; (C–E), HMGB1 (C), IP-10 (D), and IL-8 (E) production was measured in culture supernatants using ELISA (C) and MSD (D, E). HMGB1 data generated with Donor 1 is expressed as mean ± SEM and shows unpaired t-test from four independent experiments. IP-10 data generated with Donor 3 is expressed as mean ± SEM and shows unpaired t-test from two independent experiments. IL-8 data is expressed as mean ± SEM and shows unpaired t-test from three independent experiments, one in Donor 1 and two in Donor 3.

Similar articles

Cited by

References

    1. Klunder LJ, Faber KN, Dijkstra G, van ISCD. Mechanisms of Cell Polarity-Controlled Epithelial Homeostasis and Immunity in the Intestine. Cold Spring Harb Perspect Biol (2016) 9:a027888. 10.1101/cshperspect.a027888 - DOI - PMC - PubMed
    1. Ananthakrishnan AN, Bernstein CN, Iliopoulos D, Macpherson A, Neurath MF, Ali RAR, et al. . Environmental triggers in IBD: a review of progress and evidence. Nat Rev Gastroenterol Hepatol (2018) 15(1):39–49. 10.1038/nrgastro.2017.136 - DOI - PubMed
    1. Kaplan GG. The global burden of IBD: from 2015 to 2025. Nat Rev Gastroenterol Hepatol (2015) 12(12):720–7. 10.1038/nrgastro.2015.150 - DOI - PubMed
    1. Tordesillas L, Berin MC, Sampson HA. Immunology of Food Allergy. Immunity (2017) 47(1):32–50. 10.1016/j.immuni.2017.07.004 - DOI - PubMed
    1. Roda G, Sartini A, Zambon E, Calafiore A, Marocchi M, Caponi A, et al. . Intestinal epithelial cells in inflammatory bowel diseases. World J Gastroenterol (2010) 16(34):4264–71. 10.3748/wjg.v16.i34.4264 - DOI - PMC - PubMed

Publication types