. 2021 Feb 11:11:591975.
doi: 10.3389/fimmu.2020.591975. eCollection 2020.

ORMDL2 Deficiency Potentiates the ORMDL3-Dependent Changes in Mast Cell Signaling

Affiliations

ORMDL2 Deficiency Potentiates the ORMDL3-Dependent Changes in Mast Cell Signaling

Viktor Bugajev et al. Front Immunol. .

Abstract

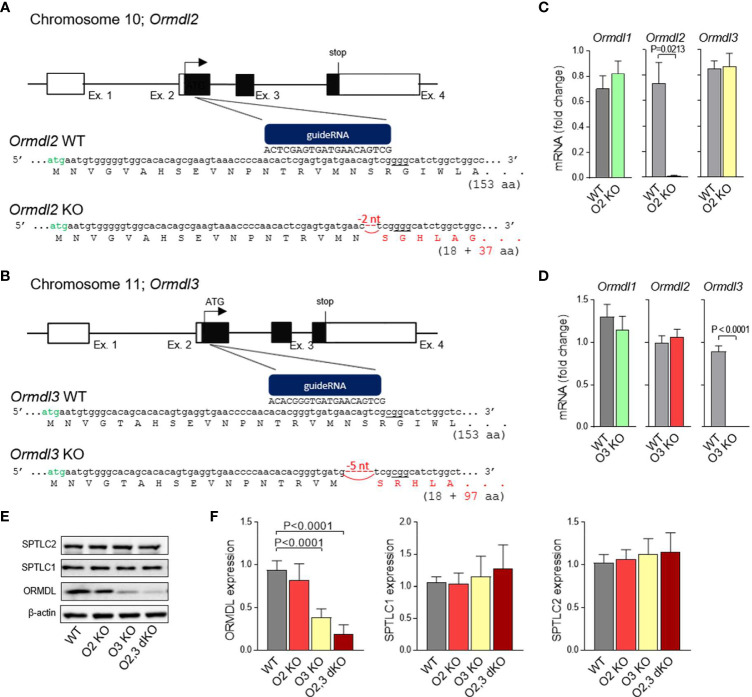
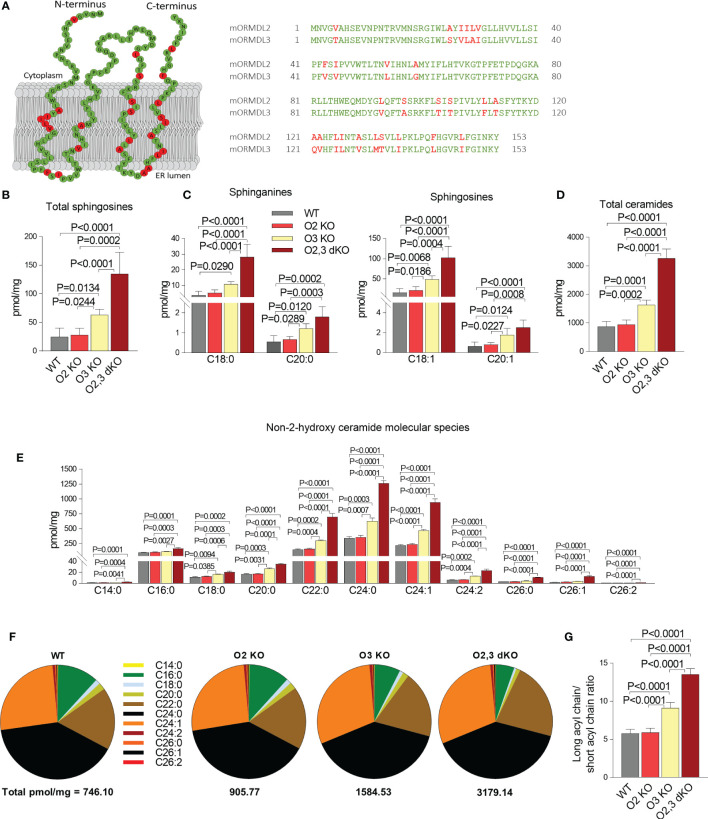
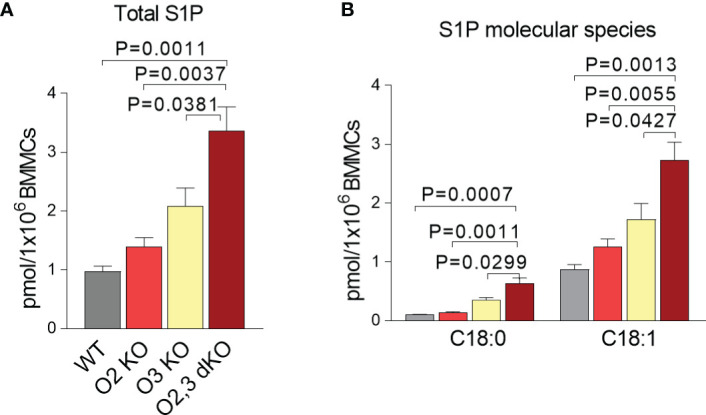
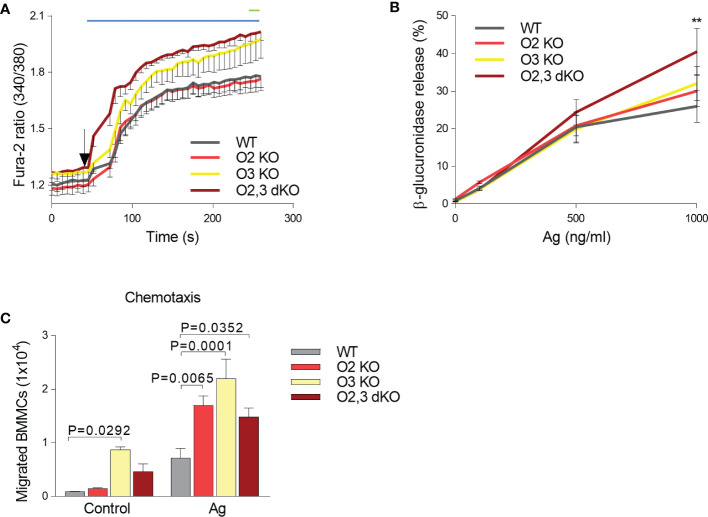
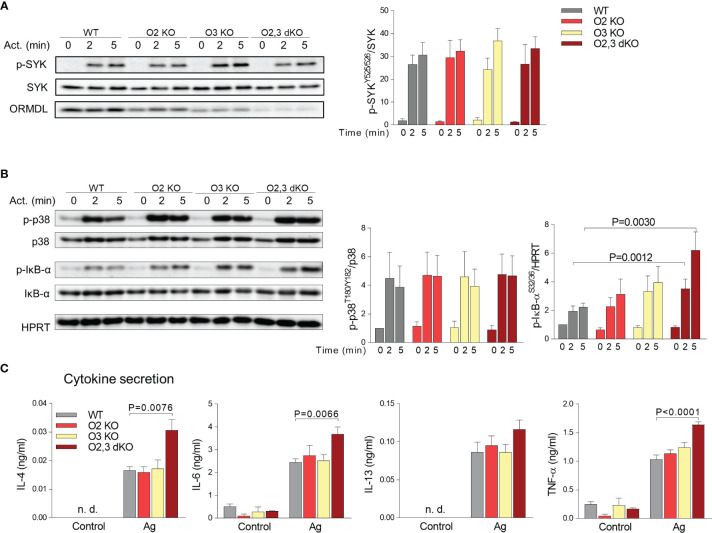
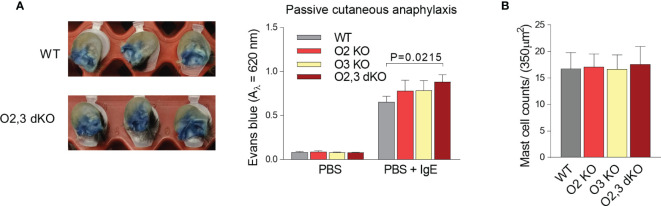
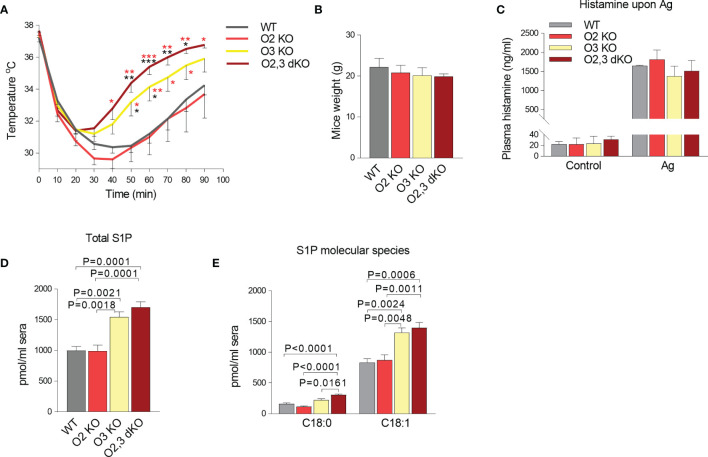
The systemic anaphylactic reaction is a life-threatening allergic response initiated by activated mast cells. Sphingolipids are an essential player in the development and attenuation of this response. De novo synthesis of sphingolipids in mammalian cells is inhibited by the family of three ORMDL proteins (ORMDL1, 2, and 3). However, the cell and tissue-specific functions of ORMDL proteins in mast cell signaling are poorly understood. This study aimed to determine cross-talk of ORMDL2 and ORMDL3 proteins in IgE-mediated responses. To this end, we prepared mice with whole-body knockout (KO) of Ormdl2 and/or Ormdl3 genes and studied their role in mast cell-dependent activation events in vitro and in vivo. We found that the absence of ORMDL3 in bone marrow-derived mast cells (BMMCs) increased the levels of cellular sphingolipids. Such an increase was further raised by simultaneous ORMDL2 deficiency, which alone had no effect on sphingolipid levels. Cells with double ORMDL2 and ORMDL3 KO exhibited increased intracellular levels of sphingosine-1-phosphate (S1P). Furthermore, we found that concurrent ORMDL2 and ORMDL3 deficiency increased IκB-α phosphorylation, degranulation, and production of IL-4, IL-6, and TNF-α cytokines in antigen-activated mast cells. Interestingly, the chemotaxis towards antigen was increased in all mutant cell types analyzed. Experiments in vivo showed that passive cutaneous anaphylaxis (PCA), which is initiated by mast cell activation, was increased only in ORMDL2,3 double KO mice, supporting our in vitro observations with mast cells. On the other hand, ORMDL3 KO and ORMDL2,3 double KO mice showed faster recovery from passive systemic anaphylaxis, which could be mediated by increased levels of blood S1P presented in such mice. Our findings demonstrate that Ormdl2 deficiency potentiates the ORMDL3-dependent changes in mast cell signaling.

Keywords: FcϵRI; ORMDL family; mast cells; passive cutaneous anaphylactic reaction; passive systemic anaphylaxis; sphingolipids; sphingosine-1-phosphate.


Conflict of interest statement

The authors declare that the research was conducted in the absence of any commercial or financial relationships that could be construed as a potential conflict of interest.

Figures

Figure 1
Figure 1
Production and initial characterization of ORMDL2 KO, ORMDL3 KO, and ORMDL2,3 dKO. (A, B) Strategy to generate ORMDL2 KO (O2 KO) and ORMDL3 KO (O3 KO) mice using the CRISPR/Cas9 approach. Specific guideRNAs were prepared to target the Ormdl2 and 3 within exon 2 (sites underlined) downstream of a second ATG codon (in green). Founders with 2-nucleotide or 5-nucleotide deletion leading to a frame shift in a coding sequence of the Ormdl2 and Ormdl3 gene, respectively, were used to establish the ORMDL2 or ORMDL3 KO mice. (C) RT-qPCR quantification of mRNAs encoding ORMDL1, ORMDL2, and ORMDL3 proteins in mast cells isolated from WT mice (n = 4) and O2 KO mice (n = 4). (D) RT-qPCR quantification of mRNAs encoding ORMDL1, ORMDL2, and ORMDL3 proteins in mast cells isolated from WT mice (n = 8) and O3 KO mice (n = 11). ORMDL2 KO and ORMDL3 KO mice were further crossed to produce ORMDL2,3 double KO (O2,3 dKO) mice. (E) Representative immunoblot of the lysates from BMMCs isolated from WT or O2 KO, O3 KO, and O2,3 dKO mice was developed with pan-ORMDL-specific antibody and the antibodies recognizing long chain subunits of the serine palmytoil transferase (SPT) complex. (F) Statistical analysis of the data presented in (E); WT (n = 6), O2 KO (n = 6), O3 KO (n = 6), and O2,3 dKO (n = 6). Quantitative data are mean ± s.e.m., calculated from n, which shows numbers of biological replicates. P values were determined by unpaired two-sided Student’s t-test in (C, D), or by one-way ANOVA with Tukey’s post hoc test in (F).
Figure 2
Figure 2
The role of ORMDL2 and ORMDL3 and their redundancy in the metabolism of sphingolipids in BMMCs. (A) Left: predicted topology of murine ORMDL2 based on recently described ORMDL1 topology (46). Residues marked in the murine ORMDL2 by green color indicate conserved amino acids, in red are shown residues which are different in mORMDL3. Right: alignment of primary amino acid sequences of mORMDL2 and mORMDL3. The amino acid replacements were aligned by DNASTAR Lasergene 15. (B–E) LC-ESI-MS/MS analysis of sphingolipids in BMMCs isolated from WT mice (n = 5), O2 KO mice (n = 6), O3 KO mice (n = 5), and O2,3 dKO mice (n = 3). (B) The level of total sphingosines (C18:1, C18:0, C20:1, and C20:0) is presented. (C) The levels of distinct sphinganines C18:0 and C20:0, and sphingosines C18:1 and C20:1 are shown. (D) The levels of total ceramide fatty acid chain molecular species, derived from C18:1 sphingosine. (E) The levels of non-2-hydroxylated ceramide isoforms derived from C18:1 sphingosine. (F) Proportions of individual non-2-hydroxylated ceramide isoforms. (G) Ratio of long acyl chains of all isoforms (C22–C26) and short acyl chains of all isoforms (C14–C20). Quantitative data are mean ± s.e.m., calculated from n, which show numbers of biological replicates. P values were determined by one-way ANOVA with Tukey’s post hoc test.
Figure 3
Figure 3
The intracellular levels of S1P in ORMDL2 and/or ORMDL3 deficient BMMCs. (A, B) LC-ESI-MS/MS analysis of intracellular S1P levels in BMMCs isolated from WT mice, O2 KO mice, O3 KO mice, and O2,3 dKO mice, n = 3 in all groups. (A) The total levels of S1P (C18:1 and C18:0) are presented. (B) The levels of S1P derived from sphinganine C18:0 and sphingosines C18:1 are shown. Quantitative data are mean ± s.e.m., calculated from n, which show numbers of biological replicates. P values were determined by one-way ANOVA with Tukey’s post hoc test.
Figure 4
Figure 4
ORMDL family-dependent increase in calcium mobilization, β-glucuronidase release and migration in antigen-activated BMMCs. (A) Calcium response in WT (n = 8), O2 KO mice (n = 8), O3 KO mice (n = 5), and O2,3 dKO mice (n = 6). (B) β-glucuronidase release from non-activated and Ag-activated BMMCs isolated from WT, O2 KO, O3 KO and O2,3 dKO mice, n = 5 in all groups (C) Antigen-mediated chemotaxis. IgE-sensitized BMMC derived from WT, O2 KO, O3 KO, and O2,3 dKO mice were examined for their migration through 8 μm-pore-size polycarbonate filters towards antigen (TNP-BSA), n = 3 in all groups. Quantitative data are mean ± s.e.m., calculated from n, which show numbers of biological replicates. P values were determined (in A, B) by two-way ANOVA with Tukey’s post hoc test or by one-way ANOVA with Dunnett’s post hoc test (in C). In A, the range of significant differences (P < 0.05) between O2,3 dKO and WT or O2 KO cells is shown as a blue line, and between ORMDL3 KO and WT or O2 KO cells as a green line. **P < 0.01.
Figure 5
Figure 5
ORMDL family-dependent changes in phosphorylation of IκB-α upon FcϵRI-mediated activation of BMMCs and cytokine secretion. (A, B) Lysates from nonactivated or activated BMMCs were subjected to immunoblotting analysis with the indicated phospho-specific antibodies. Quantification and statistical evaluation of fold changes in protein phosphorylation were normalized to phosphorylation in non-activated cells and to the amount of the corresponding loading control (SYK, p38) or antibody specific for HPRT was used as a p-IκB-α loading control. Typical results from four to five independent experiments are presented. (C) The levels of IL-4, IL-6, IL-13, and TNF-α released into the supernatant from non-activated (Control) or Ag-activated (Ag) BMMCs were determined by bead-based immunoassay. WT (n = 4), O2 KO mice (n = 3), O3 KO mice (n = 4), and O2,3 dKO mice (n = 4). Quantitative data are mean ± s.e.m., calculated from n, which show numbers of biological replicates. P values in (A–C) were determined by one-way ANOVA with Dunnett’s post hoc test. n. d., Non-determined.
Figure 6
Figure 6
The role of ORMDL family members in PCA. (A) TNP-specific IgE was injected intradermally into the right ears and PBS alone into the left ears. After 48 h, TNP-BSA was administered intravenously together with Evans blue dye. Mice were killed 1 h later. The examples of excised IgE-positive ears penetrated with Evans blue from WT mice and ORMDL2,3 dKO mice are shown on the left. On the right, quantification of Evans blue extravasation from control ears (PBS) and IgE-positive ears (PBS + IgE). WT mice (n = 13), O2 KO mice (n = 6), O3 KO mice (n = 8), and O2,3 dKO mice (n = 13). (B) The counts of mast cells stained with toluidine blue in the skin cuts; n = 5 in all groups. Quantitative data are mean ± s.e.m., calculated from n, which show numbers of biological replicates. P values in (A, B) were determined by one-way ANOVA with Dunnett’s post hoc test.
Figure 7
Figure 7
The role of ORMDL family members in the PSA. (A) WT mice (n = 10), O2 KO mice (n = 8), O3 KO mice (n = 10), and O2,3 dKO mice (n = 6) were sensitized i.p. with TNP-specific IgE (45 µg/mouse) and 18 h later were i.v. challenged with antigen to induce systemic anaphylaxis. Changes in body temperature were monitored at the indicated times using rectal thermometer. P values were determined by two-way ANOVA; ***P < 0.001; **P < 0.01; *P < 0.05. The significance in corresponding points is shown in black stars when compared with WT mice or red stars when compared with O2 KO mice. (B) Weight of mice used in the PSA experiment. (C) Histamine levels in WT (n = 3), O2 KO (n = 5), O3 KO (n = 5), and O2,3 dKO (n = 4) mice 90 s after antigen stimulation. (D, E) LC-ESI-MS/MS analysis of S1P levels in sera isolated from WT mice (n = 5), O2 KO (n = 5), O3 KO mice (n = 5), and O2,3 dKO mice (n = 5). (D) The total levels of S1P (C18:1 and C18:0) are presented. (E) The levels of S1P derived from sphinganine C18:0 and sphingosine C18:1 are shown. Quantitative data are mean ± s.e.m., calculated from n, which show numbers of biological replicates. P values in B-E were determined by one-way ANOVA with Tukey’s post hoc test.

Similar articles

Cited by

References

    1. Olivera A, Rivera J. Sphingolipids and the balancing of immune cell function: lessons from the mast cell. J Immunol (2005) 174:1153–8. 10.4049/jimmunol.174.3.1153 - DOI - PubMed
    1. Hanada K. Serine palmitoyltransferase, a key enzyme of sphingolipid metabolism. Biochim Biophys Acta (2003) 1632:16–30. 10.1016/s1388-1981(03)00059-3 - DOI - PubMed
    1. Hannun YA, Obeid LM. Principles of bioactive lipid signalling: lessons from sphingolipids. Nat Rev Mol Cell Biol (2008) 9:139–50. 10.1038/nrm2329 - DOI - PubMed
    1. Schauberger E, Peinhaupt M, Cazares T, Lindsley AW. Lipid mediators of allergic disease: pathways, treatments, and emerging therapeutic targets. Curr Allergy Asthma Rep (2016) 16:48. 10.1007/s11882-016-0628-3 - DOI - PMC - PubMed
    1. Wennekes T, van den Berg RJ, Boot RG, van der Marel GA, Overkleeft HS, Aerts. Glycosphingolipids-nature JM. function, and pharmacological modulation. Angew Chem Int Ed Engl (2009) 48:8848–69. 10.1002/anie.200902620 - DOI - PubMed

Publication types

MeSH terms