. 2021 Feb 10:11:596173.
doi: 10.3389/fimmu.2020.596173. eCollection 2020.

The Peripheral Blood Transcriptome Is Correlated With PET Measures of Lung Inflammation During Successful Tuberculosis Treatment

Collaborators, Affiliations

The Peripheral Blood Transcriptome Is Correlated With PET Measures of Lung Inflammation During Successful Tuberculosis Treatment

Trust Odia et al. Front Immunol. .

Abstract

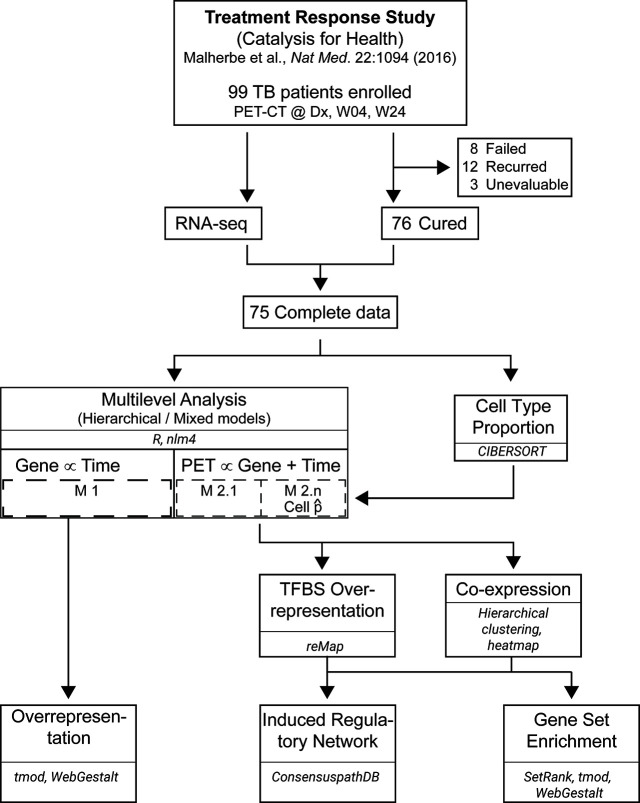
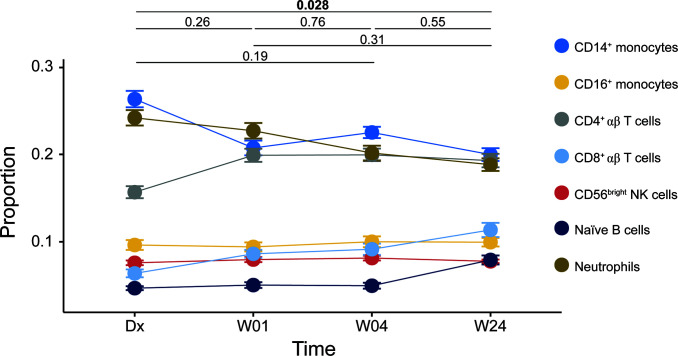
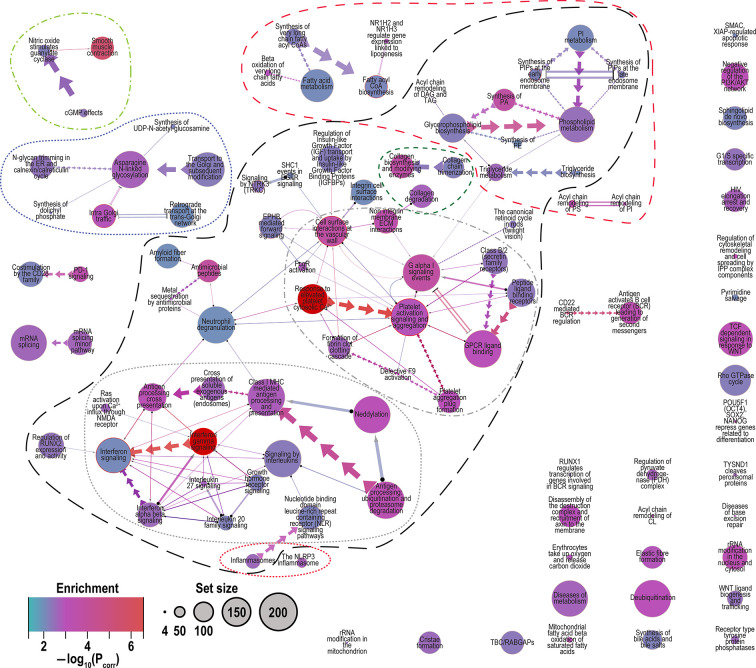
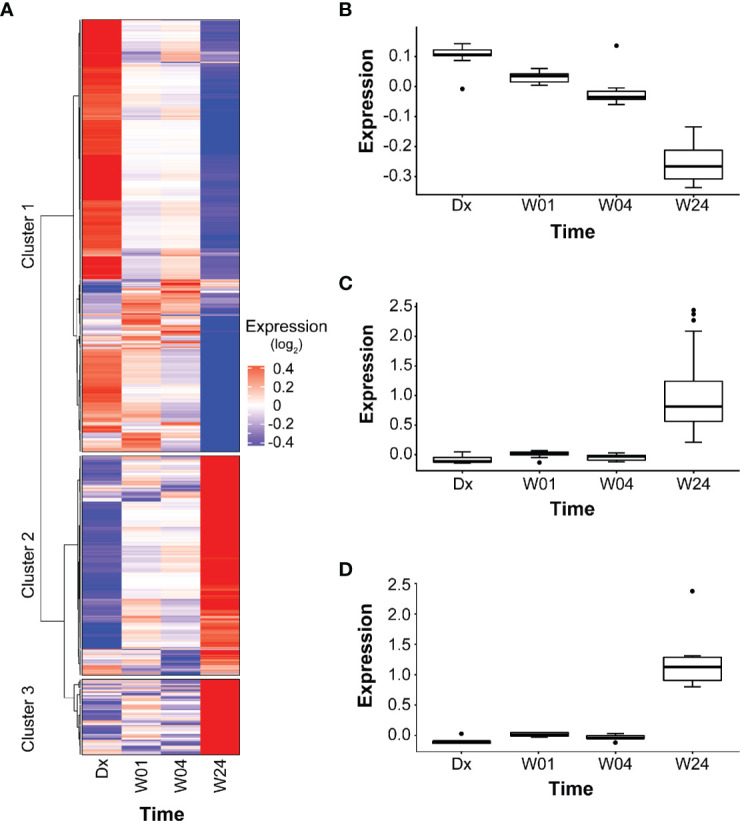
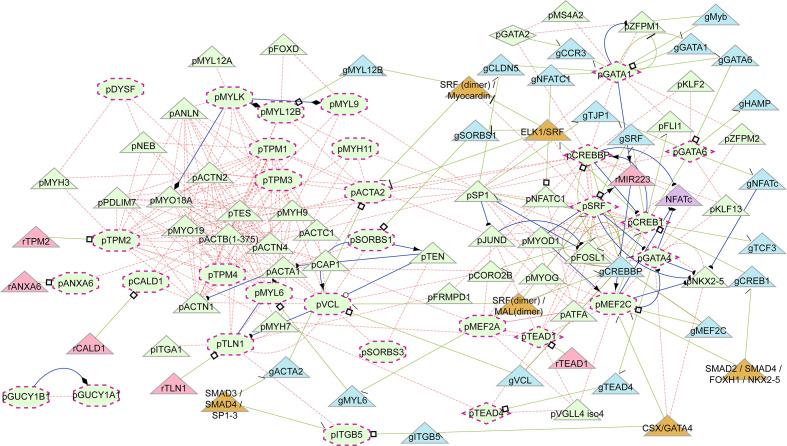
Pulmonary tuberculosis (PTB) is characterized by lung granulomas, inflammation and tissue destruction. Here we used within-subject peripheral blood gene expression over time to correlate with the within-subject lung metabolic activity, as measured by positron emission tomography (PET) to identify biological processes and pathways underlying overall resolution of lung inflammation. We used next-generation RNA sequencing and [18F]FDG PET-CT data, collected at diagnosis, week 4, and week 24, from 75 successfully cured PTB patients, with the [18F]FDG activity as a surrogate for lung inflammation. Our linear mixed-effects models required that for each individual the slope of the line of [18F]FDG data in the outcome and the slope of the peripheral blood transcript expression data correlate, i.e., the slopes of the outcome and explanatory variables had to be similar. Of 10,295 genes that changed as a function of time, we identified 639 genes whose expression profiles correlated with decreasing [18F]FDG uptake levels in the lungs. Gene enrichment over-representation analysis revealed that numerous biological processes were significantly enriched in the 639 genes, including several well known in TB transcriptomics such as platelet degranulation and response to interferon gamma, thus validating our novel approach. Others not previously associated with TB pathobiology included smooth muscle contraction, a set of pathways related to mitochondrial function and cell death, as well as a set of pathways connecting transcription, translation and vesicle formation. We observed up-regulation in genes associated with B cells, and down-regulation in genes associated with platelet activation. We found 254 transcription factor binding sites to be enriched among the 639 gene promoters. In conclusion, we demonstrated that of the 10,295 gene expression changes in peripheral blood, only a subset of 639 genes correlated with inflammation in the lungs, and the enriched pathways provide a description of the biology of resolution of lung inflammation as detectable in peripheral blood. Surprisingly, resolution of PTB inflammation is positively correlated with smooth muscle contraction and, extending our previous observation on mitochondrial genes, shows the presence of mitochondrial stress. We focused on pathway analysis which can enable therapeutic target discovery and potential modulation of the host response to TB.

Keywords: RNA-sequencing; [18F]FDG PET-CT; gene expression; mixed-effect models; pathway analysis; transcription factor binding site; treatment response; tuberculosis.


Conflict of interest statement

The authors declare that the research was conducted in the absence of any commercial or financial relationships that could be construed as a potential conflict of interest.

Figures

Figure 1
Figure 1
Workflow for data analysis. RNA-seq data from 75 PTB patients at Dx, Week 4 (W04) and Week 24 (W24) was merged with [18F]FDG PET-CT data from 75 patients at the same time points. Linear mixed-effect models with varying intercepts, and varying slopes were built with lme4 in R. Whole blood deconvolution of RNA-seq data was performed with CIBERSORT, and the proportions of naïve B cells, CD8+ αβ T cells, CD14+ monocytes and neutrophils were used as a covariable in the models. Transcription factor binding sites (TFBS) over-presentation and co-expression analyses were performed on the results from Models 2.1 to 2.5. The results from co-expression analysis were used to construct an induced gene regulatory network and perform gene set enrichment. Overrepresentation analysis was also performed on the genes from Model 1.
Figure 2
Figure 2
Cell proportions estimated using CIBERSORT. Line plot of repeated-measures ANOVA result. Symbols: filled circles, mean; error bars, standard error of the mean. Significance of the overall comparison between time points is indicated at the top (Tukey HSD).
Figure 3
Figure 3
Merged network of Reactome pathways identified by all models (2.1 to 2.5). Network graphically shows the interconnectedness of many pathways through sharing of genes. Legend: Enrichment, color indicates the degree of enrichment [−log10(Pcorr)]; Set size, circle size represents the number of genes in the pathway conditioned on the observed 14,841 genes. Edge (connector) symbols: straight line, limited gene sharing; arrows, subset; and double lines, substantial overlap; line thickness indicates degree of gene sharing [−log10(Pintersect)]. Related pathways are indicated by the outlines. Long black dashes, the largest interconnected set of pathways comprising “interferon and interleukin signaling”, “platet activation and degranulation” and “phospholipid metabolism”; dotted red, inflammasomes; dotted grey, interferon and interleuking signaling; dash-dot grey, platelet activation and degranulation; short-dash green, collagen metabolism; medium dash red, lipid and phospholipid metabolism; dot-dash light green, smooth muscle contraction; and dotted dark blue, Golgi trafficking and N-linked glycosylation. Note: in the merged network the pathway colors are represented as the minimum corrected P value [or maximum −log10(Pcorr)] among the five models.
Figure 4
Figure 4
Clusters in PETGenes. (A) Co-expression of PETGenes grouped into clusters. Each cluster contains genes with similar expression pattern, over time. Dark blue, very low expression level; grey, moderate expression level; and dark red, very high expression level. Expression (log2), average expression of 75 subjects at each time point. (B) Changes in the expression of Cluster 1 genes. (C) Changes in the expression of Cluster 2 genes, and (D) Changes in the expression of Cluster 3 genes.
Figure 5
Figure 5
Induced regulatory network of smooth muscle cell contraction. Network generated from genes enriched in the smooth muscle contraction pathway together with enriched transcription factors present in their promoters. Shapes: maroon dashed-line border, input elements; octagons, input smooth muscle genes (as proteins); diamonds, input transcription factors (as proteins); triangles, induced elements; light green elements, proteins; light blue, genes; light red, RNA; orange, complexes. Text prefixes: g, gene; p, protein; r, RNA. Lines: light red dashed, protein interaction; light green, gene regulatory interaction; blue, biochemical interaction. Target arrow shapes: arrowhead, activator; open circle, product, half circle, substrate; diamond, enzyme activity; T, suppressor; open square, transcribed product; half arrow/half top, transcription factor binding.

Similar articles

Cited by

References

    1. World Health Organization Global tuberculosis report 2019. (2019). p. 283.
    1. Gadkowski LB, Stout JE. Cavitary pulmonary disease. Clin Microbiol Rev (2008) 21:305–33. 10.1128/cmr.00060-07 - DOI - PMC - PubMed
    1. Silva Miranda M, Breiman A, Allain S, Deknuydt F, Altare F. The tuberculous granuloma: an unsuccessful host defence mechanism providing a safety shelter for the bacteria? Clin Dev Immunol (2012) 2012:139127. 10.1155/2012/139127 - DOI - PMC - PubMed
    1. Ryu YJ. Diagnosis of pulmonary tuberculosis: recent advances and diagnostic algorithms. Tuberc Respir Dis (Seoul) (2015) 78:64–71. 10.4046/trd.2015.78.2.64 - DOI - PMC - PubMed
    1. Skoura E, Zumla A, Bomanji J. Imaging in tuberculosis. Int J Infect Dis (2015) 32:87–93. 10.1016/j.ijid.2014.12.007 - DOI - PubMed

Publication types

MeSH terms

LinkOut - more resources