

Characterization of the Signaling Modalities of Prostaglandin E2 Receptors EP2 and EP4 Reveals Crosstalk and a Role for Microtubules
- PMID: 33643295
- PMCID: PMC7907432
- DOI: 10.3389/fimmu.2020.613286
Characterization of the Signaling Modalities of Prostaglandin E2 Receptors EP2 and EP4 Reveals Crosstalk and a Role for Microtubules
Abstract
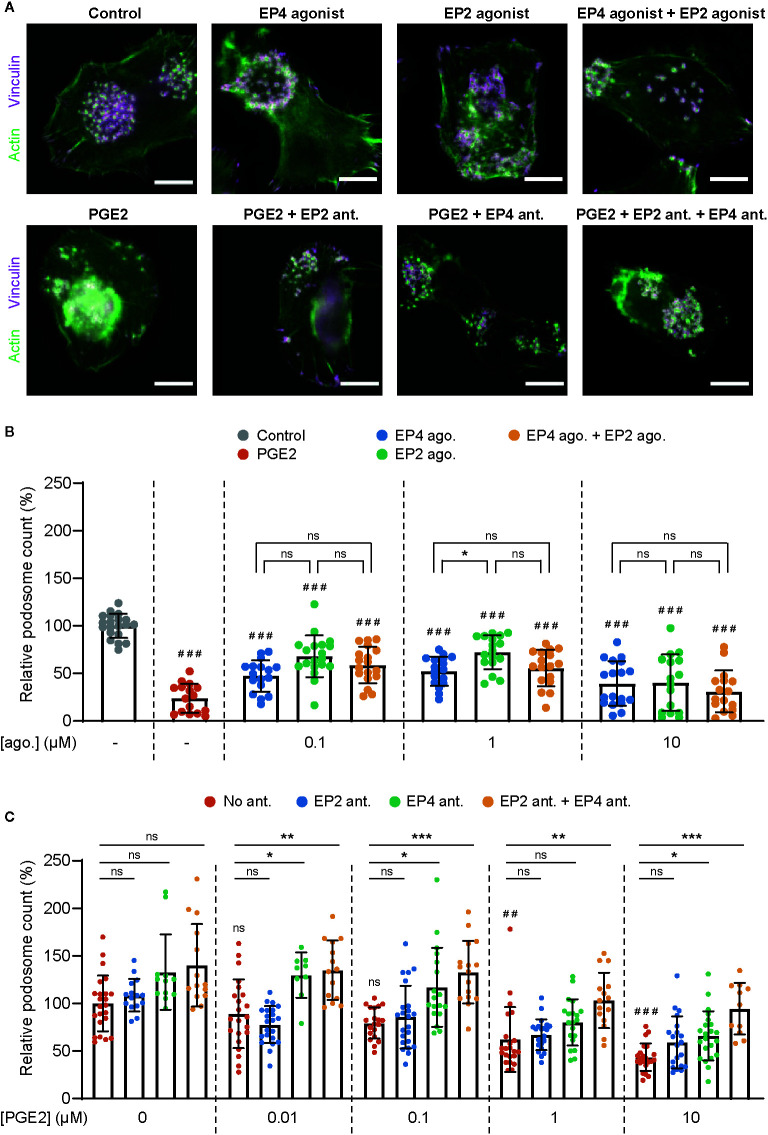
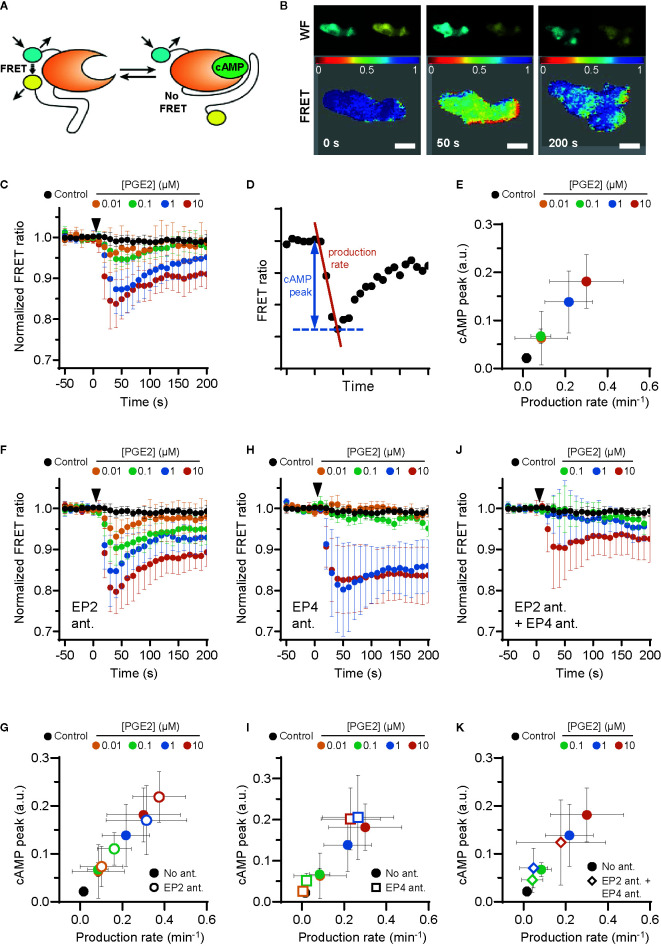
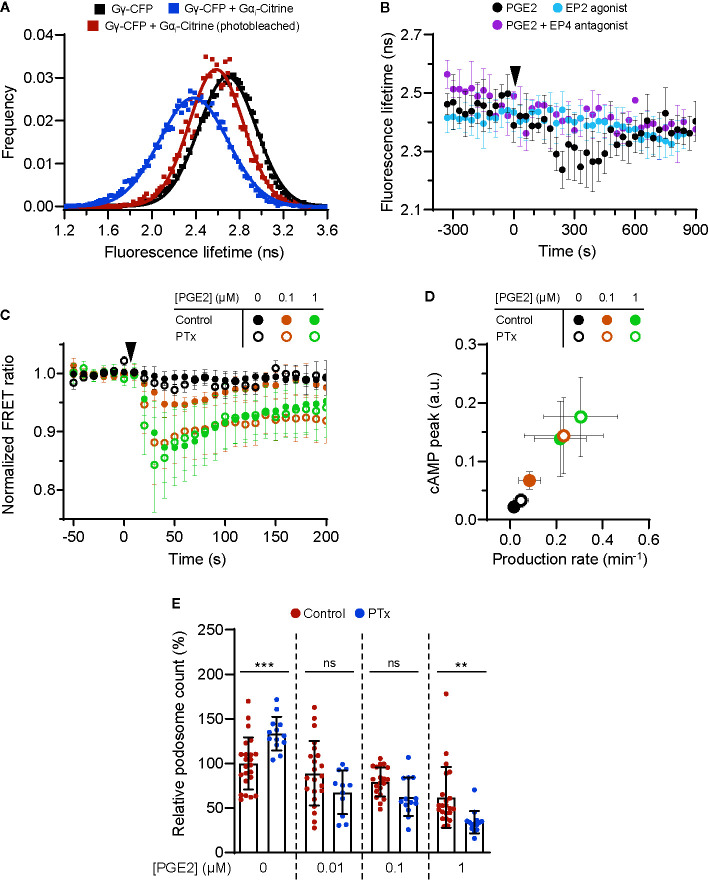
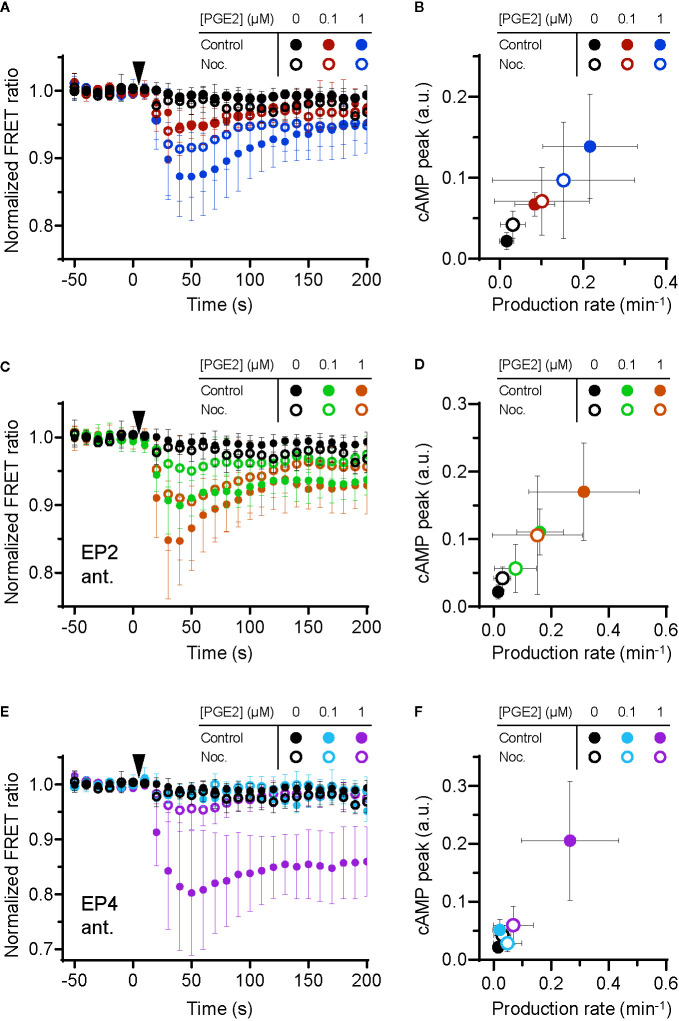
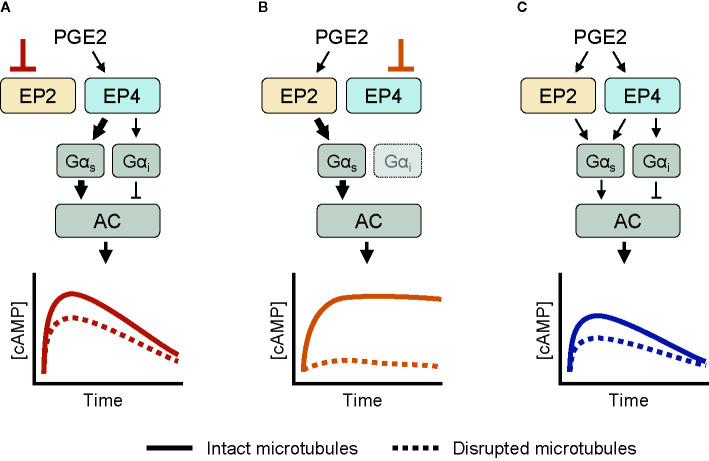
Prostaglandin E2 (PGE2) is a lipid mediator that modulates the function of myeloid immune cells such as macrophages and dendritic cells (DCs) through the activation of the G protein-coupled receptors EP2 and EP4. While both EP2 and EP4 signaling leads to an elevation of intracellular cyclic adenosine monophosphate (cAMP) levels through the stimulating Gαs protein, EP4 also couples to the inhibitory Gαi protein to decrease the production of cAMP. The receptor-specific contributions to downstream immune modulatory functions are still poorly defined. Here, we employed quantitative imaging methods to characterize the early EP2 and EP4 signaling events in myeloid cells and their contribution to the dissolution of adhesion structures called podosomes, which is a first and essential step in DC maturation. We first show that podosome loss in DCs is primarily mediated by EP4. Next, we demonstrate that EP2 and EP4 signaling leads to distinct cAMP production profiles, with EP4 inducing a transient cAMP response and EP2 inducing a sustained cAMP response only at high PGE2 levels. We further find that simultaneous EP2 and EP4 stimulation attenuates cAMP production, suggesting a reciprocal control of EP2 and EP4 signaling. Finally, we demonstrate that efficient signaling of both EP2 and EP4 relies on an intact microtubule network. Together, these results enhance our understanding of early EP2 and EP4 signaling in myeloid cells. Considering that modulation of PGE2 signaling is regarded as an important therapeutic possibility in anti-tumor immunotherapy, our findings may facilitate the development of efficient and specific immune modulators of PGE2 receptors.
Keywords: G protein-coupled receptor; membrane receptor; myeloid cells; podosome; prostaglandin E2 signaling.
Copyright © 2021 Vleeshouwers, van den Dries, de Keijzer, Joosten, Lidke and Cambi.
Conflict of interest statement
The authors declare that the research was conducted in the absence of any commercial or financial relationships that could be construed as a potential conflict of interest.
Figures
Similar articles
-
Distinct roles of PGE2 signaling via EP2 and EP4 in circulating pDCs: Implications for immune modulation in the tumor microenvironment.J Leukoc Biol. 2025 May 7;117(5):qiaf034. doi: 10.1093/jleuko/qiaf034. J Leukoc Biol. 2025. PMID: 40116121
-
T cell-intrinsic prostaglandin E2-EP2/EP4 signaling is critical in pathogenic TH17 cell-driven inflammation.J Allergy Clin Immunol. 2019 Feb;143(2):631-643. doi: 10.1016/j.jaci.2018.05.036. Epub 2018 Jun 20. J Allergy Clin Immunol. 2019. PMID: 29935220 Free PMC article.
-
Activation of prostaglandin EP4 receptor attenuates the induction of cyclooxygenase-2 expression by EP2 receptor activation in human amnion fibroblasts: implications for parturition.FASEB J. 2019 Jul;33(7):8148-8160. doi: 10.1096/fj.201802642R. Epub 2019 Mar 27. FASEB J. 2019. PMID: 30917001
-
[Cooperation of two subtypes of PGE2 receptor, Gi coupled EP3 and Gs coupled EP2 or EP4 subtype].Yakugaku Zasshi. 2003 Oct;123(10):837-43. doi: 10.1248/yakushi.123.837. Yakugaku Zasshi. 2003. PMID: 14577329 Review. Japanese.
-
Prostaglandin E2 in the Tumor Microenvironment, a Convoluted Affair Mediated by EP Receptors 2 and 4.Pharmacol Rev. 2024 May 2;76(3):388-413. doi: 10.1124/pharmrev.123.000901. Pharmacol Rev. 2024. PMID: 38697857 Review.
Cited by
-
Prostaglandin E2 receptor EP4 activation induces tolerogenic dendritic cells to mitigate ischemic acute kidney injury.Sci Rep. 2025 May 31;15(1):19170. doi: 10.1038/s41598-025-03085-6. Sci Rep. 2025. PMID: 40450025 Free PMC article.
-
Arachidonic acid-derived lipid mediators in multiple sclerosis pathogenesis: fueling or dampening disease progression?J Neuroinflammation. 2024 Jan 17;21(1):21. doi: 10.1186/s12974-023-02981-w. J Neuroinflammation. 2024. PMID: 38233951 Free PMC article. Review.
-
Receptor-mediated activation of CFTR via prostaglandin signaling pathways in the airway.Am J Physiol Lung Cell Mol Physiol. 2022 Mar 1;322(3):L305-L314. doi: 10.1152/ajplung.00388.2021. Epub 2022 Jan 12. Am J Physiol Lung Cell Mol Physiol. 2022. PMID: 35020527 Free PMC article.
-
Drug repurposing screens to identify potential drugs for chronic kidney disease by targeting prostaglandin E2 receptor.Comput Struct Biotechnol J. 2023 Jul 7;21:3490-3502. doi: 10.1016/j.csbj.2023.07.007. eCollection 2023. Comput Struct Biotechnol J. 2023. PMID: 37484490 Free PMC article.
-
Crosstalk between P2Y receptors and cyclooxygenase activity in inflammation and tissue repair.Purinergic Signal. 2024 Apr;20(2):145-155. doi: 10.1007/s11302-023-09938-x. Epub 2023 Apr 13. Purinergic Signal. 2024. PMID: 37052777 Free PMC article. Review.
References
-
- Coleman RA, Smith WL, Narumiya S. International Union of Pharmacology classification of prostanoid receptors: properties, distribution, and structure of the receptors and their subtypes. Pharmacol Rev (1994) 46:205–29. - PubMed
Publication types
MeSH terms
Substances
Grants and funding
LinkOut - more resources
Full Text Sources
Other Literature Sources