. 2021 Feb 11:11:614372.
doi: 10.3389/fimmu.2020.614372. eCollection 2020.

Multipathogen Analysis of IgA and IgG Antigen Specificity for Selected Pathogens in Milk Produced by Women From Diverse Geographical Regions: The INSPIRE Study

Affiliations

Multipathogen Analysis of IgA and IgG Antigen Specificity for Selected Pathogens in Milk Produced by Women From Diverse Geographical Regions: The INSPIRE Study

Michelle K McGuire et al. Front Immunol. .

Abstract

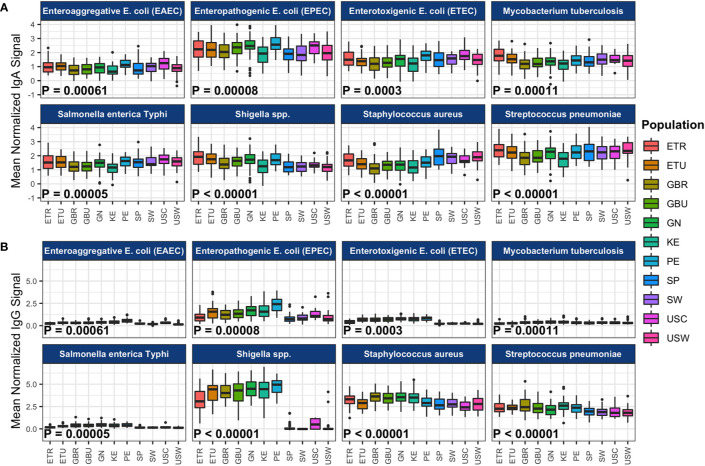
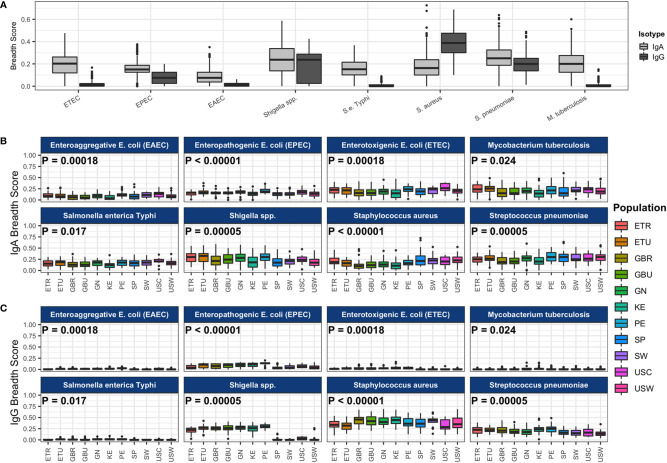
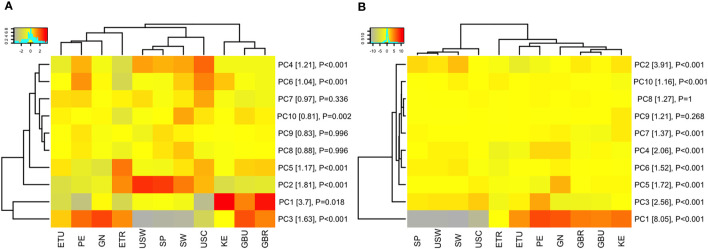
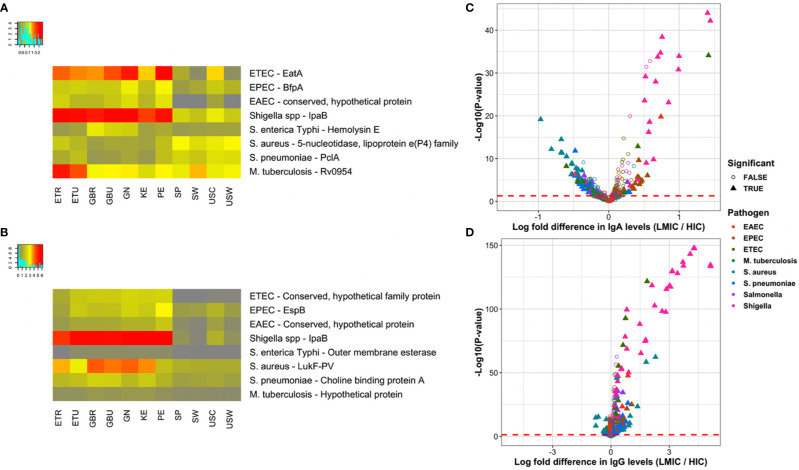
Breastfeeding provides defense against infectious disease during early life. The mechanisms underlying this protection are complex but likely include the vast array of immune cells and components, such as immunoglobulins, in milk. Simply characterizing the concentrations of these bioactives, however, provides only limited information regarding their potential relationships with disease risk in the recipient infant. Rather, understanding pathogen and antigen specificity profiles of milk-borne immunoglobulins might lead to a more complete understanding of how maternal immunity impacts infant health and wellbeing. Milk produced by women living in 11 geographically dispersed populations was applied to a protein microarray containing antigens from 16 pathogens, including diarrheagenic E. coli, Shigella spp., Salmonella enterica serovar Typhi, Staphylococcus aureus, Streptococcus pneumoniae, Mycobacterium tuberculosis and other pathogens of global health concern, and specific IgA and IgG binding was measured. Our analysis identified novel disease-specific antigen responses and suggests that some IgA and IgG responses vary substantially within and among populations. Patterns of antibody reactivity analyzed by principal component analysis and differential reactivity analysis were associated with either lower-to-middle-income countries (LMICs) or high-income countries (HICs). Antibody levels were generally higher in LMICs than HICs, particularly for Shigella and diarrheagenic E. coli antigens, although sets of S. aureus, S. pneumoniae, and some M. tuberculosis antigens were more reactive in HICs. Differential responses were typically specific to canonical immunodominant antigens, but a set of nondifferential but highly reactive antibodies were specific to antigens possibly universally recognized by antibodies in human milk. This approach provides a promising means to understand how breastfeeding and human milk protect (or do not protect) infants from environmentally relevant pathogens. Furthermore, this approach might lead to interventions to boost population-specific immunity in at-risk breastfeeding mothers and their infants.

Keywords: IgA; IgG; breastfeeding; breastmilk; human milk; immunoglobulins; pathogen; protein array.


Conflict of interest statement

AR and JC are employees of Antigen Discovery Incorporated, a company that carries patents related to the protein array analyses used here and the location where the arrays were conducted. The remaining authors declare that the research was conducted in the absence of any commercial or financial relationships that could be construed as a potential conflict of interest.

Figures

Figure 1
Figure 1
Population-level immunoglobulin A (IgA) and immunoglobulin G (IgG) reactivity to specific pathogen proteins. The boxplots represent the distributions of individuals’ mean normalized (A) IgA and (B) IgG signal intensities for the 10 most reactive proteins per pathogen, for the primary pathogens. Reactivity was determined by the mean signal intensity per protein across all samples in the study. Samples from each cohort are displayed in colored boxes. Normalized signal intensity scales for IgA and IgG are independent. Abbreviations: ETR, rural Ethiopia; ETU, urban Ethiopia; GBR, rural The Gambia; GBU, urban The Gambia; GN, Ghana; KE, Kenya; PE, Peru; SP, Spain; SW, Sweden; USC, U.S.-California; USW, U.S.-Washington.
Figure 2
Figure 2
Antibody breadth scores for each pathogen. (A) The boxplot represents the distributions of individual subject breadth scores for each pathogen. Breadth score is calculated for each subject for each of the primary pathogens as the proportion of reactive protein array spots among all spots (for each pathogen separately). All study populations are shown together. Immunoglobulin A (IgA) breadth scores are shown in light gray boxes, and immunoglobulin G (IgG) breadth scores are shown in dark gray boxes. Pathogen IgA breadth scores (B) and IgG breadth scores (C) by population are shown in the colored boxes. P-values from ANOVA of the mean breadth scores among study populations are shown in each pathogen panel. Abbreviations: ETEC, enterotoxigenic E. coli; EPEC, enteropathogenic E. coli; EAEC, enteroaggregative E. coli. Abbreviations: ETR, rural Ethiopia; ETU, urban Ethiopia; GBR, rural The Gambia; GBU, urban The Gambia; GN, Ghana; KE, Kenya; PE, Peru; SP, Spain; SW, Sweden; USC, U.S.-California; USW, U.S.-Washington.
Figure 3
Figure 3
Population clustering by principle component analysis. The heat maps display the mean of each principle component (rows) for each study population (columns). For example, the mean of the first principle component (PC1) for all volunteers in Peru (PE) is summarized in a single value on the heat map. PCA was performed on (A) immunoglobulin A (IgA) responses and (B) immunoglobulin G (IgG) responses for all in vitro transcription and translation (IVTT) proteins represented on the multipathogen protein microarray (purified protein PCA results are shown in the Supplemental Information ). Only the first 10 PCs are shown, capturing approximately 14% and 25% of the variation in the IgA and IgG data, respectively (a heat map of all PCs are shown in Supplemental Information ). Populations and PCs were ordered by hierarchical clustering. The color keys show the scale of gray/yellow lower PC values to red higher PC values. Row labels include percent variation captured by each PC in brackets and P-values from ANOVA of the PC means among study populations. Abbreviations: ETR, rural Ethiopia; ETU, urban Ethiopia; GBR, rural The Gambia; GBU, urban The Gambia; GN, Ghana; KE, Kenya; PE, Peru; SP, Spain; SW, Sweden; USC, U.S.-California; USW, U.S.-Washington; PC#, principal component.
Figure 4
Figure 4
Top differentially reactive antigens per pathogen. (A, B) The heat maps present the most significant differentially reactive protein for each of the primary pathogens by ANOVA F-statistic for immunoglobulin A (IgA) and immunoglobulin G (IgG), respectively. ANOVA results for all proteins is included in the Supplemental Information . Rows represent per-pathogen proteins with the lowest P-values, and columns represent the mean normalized signals for each study population. All antigens had ANOVA adjusted P-values < 0.05, with the exception of the DENV envelope protein for IgA (P=0.06). (C, D) The volcano plots show the log-fold increase in IgA and IgG levels, respectively, between LMIC and HIC cohorts on the x-axis by the inverse log10 unadjusted P-value on the y-axis. Each point represents a protein on the multipathogen array that has been colored by pathogen. Filled triangles represent proteins that remain significantly differentially reactive after adjustment, defined as an adjusted P-value < 0.05 and mean normalized signal above the mixed model cutoffs ( Figure S6 ) in at least one of the comparator groups. Points to the right of zero indicate higher antibody levels in LMICs, whereas points left of zero indicate higher levels in HICs. Abbreviations: ETEC, enterotoxigenic E. coli; EPEC, enteropathogenic E. coli; EAEC, enteroaggregative E. coli; LMIC, lower- and middle-income country; ETR, rural Ethiopia; ETU, urban Ethiopia; GBR, rural The Gambia; GBU, urban The Gambia; GN, Ghana; KE, Kenya; PE, Peru; SP, Spain; SW, Sweden; USC, U.S.-California; USW, U.S.-Washington.

References

    1. American Academy of Pediatrics Section on Breastfeeding Breastfeeding and the use of human milk. Pediatrics (2012) 129:e827–41. 10.1542/peds.2011-3552 - DOI - PubMed
    1. World Health Organization Exclusive breastfeeding for six months best for babies everywhere. Statement. WHO; (2011) Available at: http://www.who.int/mediacentre/news/statements/2011/breastfeeding_201101..., January 15, 2011.
    1. Wold AE, Adlerberth I. Breast feeding and the intestinal microflora of the infant - implications for protection against infectious diseases. Adv Exp Med Biol (2000) 478:77–93. 10.1007/0-306-46830-1_7 - DOI - PubMed
    1. Verduci E, Martelli A, Miniello VL, Landi M, Mariani B, Brambilla M, et al. Nutrition in the first 1000 days and respiratory health: A descriptive review of the last five years’ literature. Allergol Immunopathol (Madr) (2017) 45(4):405–13. 10.1016/j.aller.2017.01.003 - DOI - PubMed
    1. Oddy WH. Infant feeding and obesity risk in the child. Breastfeed Rev (2012) 20(2):7–12. - PubMed

Publication types

MeSH terms