Review
. 2021 Feb 10:11:620170.
doi: 10.3389/fimmu.2020.620170. eCollection 2020.

Intestinal Bacteria Encapsulated by Biomaterials Enhance Immunotherapy

Affiliations
Review

Intestinal Bacteria Encapsulated by Biomaterials Enhance Immunotherapy

Yilun Liu et al. Front Immunol. .

Abstract

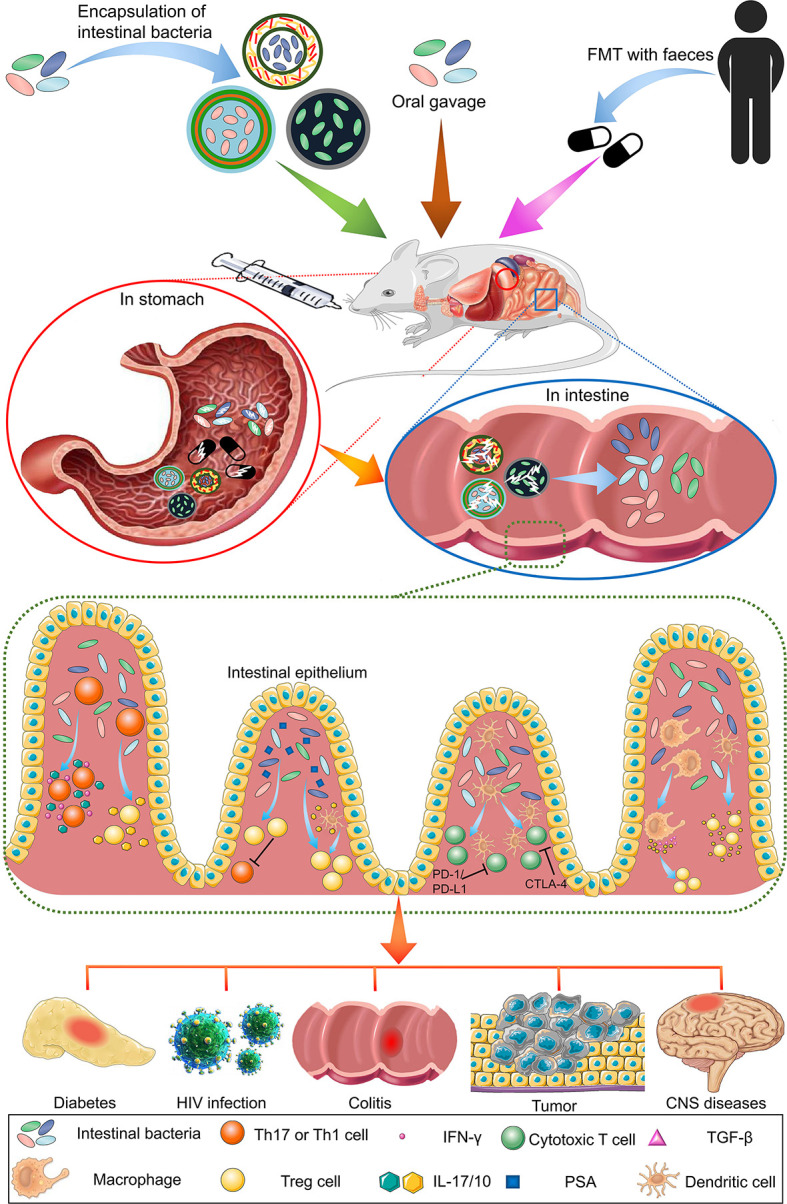
The human intestine contains thousands of bacterial species essential for optimal health. Aside from their pathogenic effects, these bacteria have been associated with the efficacy of various treatments of diseases. Due to their impact on many human diseases, intestinal bacteria are receiving increasing research attention, and recent studies on intestinal bacteria and their effects on treatments has yielded valuable results. Particularly, intestinal bacteria can affect responses to numerous forms of immunotherapy, especially cancer therapy. With the development of precision medicine, understanding the factors that influence intestinal bacteria and how they can be regulated to enhance immunotherapy effects will improve the application prospects of intestinal bacteria therapy. Further, biomaterials employed for the convenient and efficient delivery of intestinal bacteria to the body have also become a research hotspot. In this review, we discuss the recent findings on the regulatory role of intestinal bacteria in immunotherapy, focusing on immune cells they regulate. We also summarize biomaterials used for their delivery.

Keywords: biomaterial; immune cell; immunotherapy; intestinal bacteria; oral delivery; probiotic.


Conflict of interest statement

The authors declare that the research was conducted in the absence of any commercial or financial relationships that could be construed as a potential conflict of interest. The reviewer XW declared a shared affiliation with several of the authors YL, ZL, YW, LL, XJ, XF, to the handling editor at time of review.

Figures

Figure 1
Figure 1
Overview of the oral administration of intestinal bacteria for immunotherapy in various diseases. Common intestinal bacterial delivery methods include oral delivery (gavage) and intravenous injection. Gavage is more widely used because of its safety profile. Compared with free bacteria and FMT, bacteria encapsulated by biomaterials can resist the acidic environment of the stomach, and their contents can be released in the intestine. The released bacteria exert immune regulation functions beneficial to the treatment of various diseases.
Figure 2
Figure 2
The Prohep intestinal bacterial mixture improves hypoxia in tumor tissues and reduces tumor volume. (A) Changes in tumor size during 38 d. (B) Tumor weight of each group after the experiment. (C) Immunostaining of representative tumor sections using the CD31 angiogenesis (red) and GLUT-1 hypoxia (blue) markers. (D) Images of a 3D model acquired after superimposing multiple confocal planes by confocal Z-stack imaging (section thickness of 25 μm). *0.01 < P value < 0.05; **0.001 < P value < 0.01; ***P value < 0.001. Adapted from ref. (16).
Figure 3
Figure 3
Differences in the composition of intestinal bacteria related to the effects of anti-PD-1 immunotherapy and antitumor immunity. (A) Taxonomic cladogram from LEfSe showing differences in stool taxa. The size of dot is positively correlated with the abundance of the taxon. Letters a–r represent the following taxa respectively: (a) Gardnerella vaginalis, (b) Gardnerella, (c) Rothia, (d) Micrococcaceae, (e) Collinsella stercoris, (f) Bacteroides mediterraneensis, (g) Porphyromonas pasteri, (h) Prevotella histicola, (i) Faecalibacterium prausnitzii, (j) Faecalibacterium, (k) Clostridium hungatei, (l) Ruminococcus bromii, (m) Ruminococcaceae, (n) Phascolarctobacterium faecium, (o) Phascolarctobacterium, (p) Veilonellaceae, (q) Peptoniphilus, (r) Desulfovbrio alaskensis. (B) Experiment designed to study the GF mice. Relative to days (indicated as D) of tumor injection (2.5 - 8 × 10⁵ tumor cells). (C) Tumor growth curves for each GF mouse from anti-PD-L1-treated R-FMT (blue, n = 2; median tumor volume = 403.7 mm3), NR-FMT (red, n = 3; median tumor volume = 2301 mm3), and Control (black, n = 2; median tumor volume = 771.35 mm3) mice. Statistics are as follows: p = 0.20 (R-FMT vs NR-FMT), p = 0.33 (NR-FMT vs Control) by the MW test. The black dotted line indicates the size limit of the tumor when treated with anti-PD-L1 (500 mm3). (D) Using the MW test, on the 14th day of implantation in NR-FMT mice (red) and R-FMT (blue), difference in tumor size expressed as fold change (FC) relative to the average tumor volume of Control GF mice. Data from 2 independent FMT experiments (R-FMT, n = 5, median FC = 0.18; NR-FMT, n = 6, median FC = 1.52). **P value < 0.01. Adapted from ref. (68).
Figure 4
Figure 4
The composition of intestinal bacterial from stool samples determines the efficacy of PD-1 mAb therapy in cancer patients after 3 months. (A) Shotgun sequencing of stool samples at the time of diagnosis, using responders (R) (partial response or stable disease) determined according to the best clinical response relative to the non-responder (NR) (progress or death) of each MGS according to RECIST1.1 standard. P value of the entire cohort of n = 100 (60 patients with NSCLC and 40 with RCC). (B, C) Immune responses of circulating memory T-cells detected during PD-1 blockade and evaluation of the time to progression. (B) Heat map of the P values for each intestinal bacterium and each cytokine, classifying the PFS of patients with NSCLC RCC based on the median value of the production of cytokines in the entire cohort. Significant P values (<0.05, Student’s t test) are marked by asterisks as relevant intestinal bacteria. (C) Kaplan-Meier curves and Univariate analysis showing immune responses of PBS against peripheral blood memory Th1 and Tc1 directed against A. muciniphila and E. hirae 13144, respectively. (D) Stool samples of 16 R and 16 NR patients with NSCLC (defined as the best clinical outcome) analyzed based on culturomic before treatment; each intestinal bacterium having been identified by mass spectrometry. Colored bars show relative frequencies of each commensal in all stool cultures in R over NR patients, and the right graph shows P values with difference. *P value < 0.05. Adapted from ref. (45).
Figure 5
Figure 5
Tumor patients can benefit from direct administration of Bifidobacterium, which was shown to improve the DC cell-related tumor-specific immunity and effect of anti-PD-L1 monoclonal antibody treatment. (A) In newly obtained TAC and JAX mice, the phylogenetic analysis of taxa with obviously different abundance FDR < 0.05 (nonparametric t test); bars represent log-transformed fold changes, inner circle, log10(10); middle circle, log10(100); outer circle, log10(1000). (B) 7 and 14 d after the implantation of B16.SIY tumor, the tumor growth kinetics in TAC mice, untreated or treated with Bifidobacterium, anti-PD-L1 mAb 7, 10, 13, and 16 d after tumor implantation, or both regimens. (C) Heat map of key antitumor immunity genes in DCs isolated from untreated TAC, Bifidobacterium-treated TAC, and JAX mice. Mean fold change for each gene transcript is shown on the right. ****P value < 0.0001. Adapted from ref. (15).
Figure 6
Figure 6
PH-responsive ACMs designed for delivery and release of L. plantarum. Overview of (A) the process of ACMs embeding L. plantarum and (B) ACMs designed for protecting L. plantarum against SGF and releasing in SIF. (C) SEM images of the freeze-dried ACMs. Adapted from ref. (161).
Figure 7
Figure 7
CAP beads and dual-core microcapsules prepared for encapsulating Lactobacillus casei, Bacillus subtilis, and Lactobacillus (NO. 21790). (A) Schematic illustration of the preparation process and the design concept of the proposed intestinal-targeted CAP carrier for the pH-responsive protection and release of L. casei. (a, c) CA beads prepared by a coextrusion method. “A” is Na-alginate solution containing L. casei, whereas “B” is pure Na-alginate solution. (b, d) CAP beads prepared by adsorption of protamine molecules. (e) Ingestion of CAP beads. (f) CAP beads offer improved protection to Lactobacillus in the stomach. (g) CAP beads rapidly release L. casei in the small intestine. (B) Characterization of microcapsules. optical microscope images of (a) the Lactobacillus microcapsules, (b) the Bacillus Subtilis microcapsules, and (c) dual-core microcapsules. (d) SEM images of dual-core microcapsules. Scale bars are 100 μm. (C) Alginate neutralizes HCL through metathesis reaction. (D) Detection of the activity of bacteria embeded in microspheres and dual-core microcapsules in SGF via fluorescent staining. The scale bar is 100 μm. Adapted from ref. (127, 166).
Figure 8
Figure 8
Layer-by-layer encapsulation of probiotics employed to enhance their survival rate against acidic and bile conditions, and their physical retention in the intestine. (A) Schematic LbL encapsulation of chitosan and alginate on probiotic. (B) LbL formulated (CHI/ALG)2 (black bars) BC were protected against both acidic and bile salt conditions at 37°C for up to 2 h. LbL coatings of chitosan (dark gray bars), (CHI/L100)1 (white bars), (CHI/L100)2 (light gray bars), and (CHI/ALG)1 (cross-hatched bars) were less effective at protecting BC against both acidic and bile conditions. Error bars represent standard deviation (n = 3). *denotes statistical difference (P < 0.05) using Student’s t-test between plain and LbL groups. **denotes statistical difference (P < 0.05) using individual Student’s t-test between the designated and any other group. (C) IVIS images of porcine intestine with plain- and (CHI/ALG)2-probiotics. Adapted from ref. (143).

Similar articles

Cited by

References

    1. Sender R, Fuchs S, Milo R. Revised Estimates for the Number of Human and Bacteria Cells in the Body. PloS Biol (2016) 14(8):e1002533. 10.1371/journal.pbio.1002533 - DOI - PMC - PubMed
    1. West NR, Powrie F. Immunotherapy Not Working? Check Your Microbiota. Cancer Cell (2015) 28(6):687–9. 10.1016/j.ccell.2015.11.010 - DOI - PubMed
    1. Hold GL. Gastrointestinal Microbiota and Colon Cancer. Dig Dis (2016) 34(3):244–50. 10.1159/000443358 - DOI - PubMed
    1. Khosravi A, Yanez A, Price JG, Chow A, Merad M, Goodridge HS, et al. Gut microbiota promote hematopoiesis to control bacterial infection. Cell Host Microbe (2014) 15(3):374–81. 10.1016/j.chom.2014.02.006 - DOI - PMC - PubMed
    1. Trompette A, Gollwitzer ES, Yadava K, Sichelstiel AK, Sprenger N, Ngom-Bru C, et al. Gut microbiota metabolism of dietary fiber influences allergic airway disease and hematopoiesis. Nat Med (2014) 20(2):159–66. 10.1038/nm.3444 - DOI - PubMed

MeSH terms