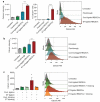
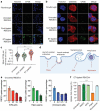
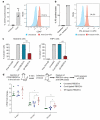
. 2021 Feb;10(4):e12057.
doi: 10.1002/jev2.12057. Epub 2021 Feb 16.

Covalent conjugation of extracellular vesicles with peptides and nanobodies for targeted therapeutic delivery

Affiliations

Covalent conjugation of extracellular vesicles with peptides and nanobodies for targeted therapeutic delivery

Tin Chanh Pham et al. J Extracell Vesicles. 2021 Feb.

Abstract

Natural extracellular vesicles (EVs) are ideal drug carriers due to their remarkable biocompatibility. Their delivery specificity can be achieved by the conjugation of targeting ligands. However, existing methods to engineer target-specific EVs are tedious or inefficient, having to compromise between harsh chemical treatments and transient interactions. Here, we describe a novel method for the covalent conjugation of EVs with high copy numbers of targeting moieties using protein ligases. Conjugation of EVs with either an epidermal growth factor receptor (EGFR)-targeting peptide or anti-EGFR nanobody facilitates their accumulation in EGFR-positive cancer cells, both in vitro and in vivo. Systemic delivery of paclitaxel by EGFR-targeting EVs at a low dose significantly increases drug efficacy in a xenografted mouse model of EGFR-positive lung cancer. The method is also applicable to the conjugation of EVs with peptides and nanobodies targeting other receptors, such as HER2 and SIRP alpha, and the conjugated EVs can deliver RNA in addition to small molecules, supporting the versatile application of EVs in cancer therapies. This simple, yet efficient and versatile method for the stable surface modification of EVs bypasses the need for genetic and chemical modifications, thus facilitating safe and specific delivery of therapeutic payloads to target cells.

Keywords: conjugation; delivery; extracellular vesicles; targeted; therapeutics.


Conflict of interest statement

Minh TN Le and Jiahai Shi are scientific co‐founders, and advisors of Carmine Therapeutics. Other authors declare no conflict of interest.

Figures

FIGURE 1
FIGURE 1
Protein ligating enzymes mediate a covalent conjugation of RBCEVs with peptides. (a) Design of an EGFR‐targeting (ET) peptide with a sortase binding site and biotin (bi) conjugation (bi‐ETS peptide). Sortagging reaction occurs between the bi‐ETS peptide and proteins with N‐terminal Glycine (G) on RBCEVs, mediated by Sortase A. (b) Western blot (WB) analysis of biotin following an SDS‐PAGE separation of RBCEV proteins conjugated with the bi‐ETS peptide. Sortase intermediates were removed in three washes with PBS. Biotin was detected using HRP‐conjugated streptavidin. Molecular weights (kDa) of protein markers are shown on the left. (c) Design of a typical OaAEP1‐ligase‐mediated reaction between a biotinylated ET peptide with a ligase binding site (bi‐ETL peptide) and proteins containing N‐terminal GL (preferred but not required) on RBCEVs. (d) Western blot analysis of biotin resulted from the OaAEP1‐ ligase‐mediated conjugation of RBCEVs with the bi‐ETL peptide, similar to (b). (e) Western Blot analysis of RBCEVs from three different donors (D1‐D3) ligated with a biotinylated control peptide using OaAEP1 ligase. Dibiotinylated HRP was used as a reference for quantification, and a particle analyzer was used to obtain the number of ligated EVs loaded per well. (f) Average number of peptides ligated to each EV ± SEM (n = 8 donors).
FIGURE 2
FIGURE 2
Characterization of peptide‐conjugated RBCEVs. (a) Representative TEM images of uncoated and coated RBCEVs (conjugated with biotinylated peptide TR5 using OaAEP1 ligase). Scale bar, 200 nm. (b‐c) Single‐EV FACS analysis of RBCEVs conjugated with biotinylated peptide (using OaAEP1 ligase). The biotin on RBCEVs was detected via sequential incubation of the EVs with streptavidin followed by a biotinylated antibody which was subsequently detected using an AF488‐conjugated secondary antibody (2o Ab). Background noise (VSSC < 104) was excluded to obtain a distinct EV population.(d) Identification of RBCEV proteins associated with biotinylated TR5 peptide after OaAEP1‐mediated ligation using biotin‐streptavidin pulldown assay and label‐free quantitative mass spectrometry analysis. Volcano plot of biotin pulldown with lysates from TR5‐ligated RBCEVs (ligated) compared to uncoated RBCEVs incubated with biotinylated TR5 peptide without ligase addition (control). Specifically enriched proteins (numbered circles) are distinguished from background binders by a two‐dimensional cut‐off of > 4‐fold enrichment and P < 0.01. Two‐dimensional error bars represent the standard deviation based on iterative imputation cycles during the label‐free analysis to substitute zero values. Membrane proteins with the molecular weight of 25–50 kDa are highlighted in blue. Student's t‐test *** P < 0.001
FIGURE 3
FIGURE 3
Conjugation of RBCEVs with EGFR‐targeting peptides increases the uptake of the EVs by EGFR‐positive cells. (a) Uptake of Cont. or ET‐ligated‐RBCEVs (using OaAEP1 ligase) by EGFR+ H358 cells, quantified based on FACS analysis of Calcein AM, the fluorescent label of RBCEVs. (b) Uptake of Cont/ET‐sortagged‐RBCEVs (using Sortase A) by H358 cells, quantified using FACS analysis of Calcein AM. (c) Effect of blocking peptides, which compete for binding to EGFR, on the uptake of ligated RBCEVs, indicated by Calcein AM intensity in H358 cells treated with Cont/ET‐peptide‐ligated RBCEVs. In each uptake assay, 200,000 cells were incubated with 5 μg Calcein‐AM labelled RBCEVs (2.5 × 109 particles) at 37°C for 2 h. Control cells were treated with the flowthrough of the last wash of Calcein‐AM‐labelled RBCEVs. The graphs present the mean ± SEM (n = 3 donors). Student's one‐tailed t‐test *P < 0.05, ***P < 0.001
FIGURE 4
FIGURE 4
Conjugation of RBCEVs with EGFR‐targeting peptides increases the uptake of the EVs by EGFR‐positive cells.(a) Representative images of the uptake of CFSE‐labelled RBCEVs by H358 cells, obtained using confocal microscopy. Scale bar, 50 μm. (b) Representative Z‐stacked images of H358 cells taking up CFSE‐labelled RBCEVs, also stained with CellMask (red) and Hoechst (blue). Scale bar, 10 μm. (c) Mean CFSE signal per cell area unit was determined from the quantification of CFSE intensity in 1200‐1600 cells per condition. (d) Possible effects of chemical inhibitors, EIPA, Filipin and Wortmannin on the uptake of RBCEVs via separate routes of endocytosis. Image was created using biorender.com. (e) Uptake of uncoated Calcein‐AM‐labelled RBCEVs by H358 cells after treatments with EIPA, Filipin and Wortmanin at indicated concentrations, determined using flow cytometry and presented as the percentage of Calcein‐AM‐positive cells. (f) Uptake of Calcein‐AM‐labelled RBCEVs that are conjugated with ET peptide by H358 cells after treatments with 100 μM EIPA, 10 μg/ml Filipin, and 0.5 μM Wortmanin, presented as fold change in Calcein AM intensity relative to the untreated control. In each uptake assay, 200,000 cells were incubated with 5 μg RBCEVs at 37°C for 2 h with or without 1‐h prior treatment with indicated inhibitors. Peptide conjugation was performed using OaAEP1 ligase. The graphs present the mean ± SEM (n = 3 donors). Student's one‐tailed t‐test ***P < 0.001
FIGURE 5
FIGURE 5
Conjugation with self‐peptide prevents phagocytosis of RBCEVs and enhances the availability of RBCEVs in the circulation. (a) Flow cytometry analysis of CD47 on RBCEV‐bound beads. (b) Flow cytometry analysis of Annexin V binding to PS on RBCEVs that were immobilized on latex beads. (c) FACS analysis of Calcein AM in MOLM13 and THP1 monocytes that were treated with control or self‐peptide (SP) ligated Calcein‐labelled RBCEVs. 200,000 cells were incubated with 5 μg RBCEVs (2.5 × 109 particles) at 37°C for 2 h. The graphs present the average percentage of Calcein‐positive cells ± SEM (n = 3 to 6 donors). (d) FACS analysis of CFSE‐labelled RBCEVs that were captured by anti‐GPA‐antibody‐coated streptavidin beads from the plasma of NSG mice, 5–15 min after a tail vein injection of 0.5 mg CFSE‐labelled human RBCEVs (2.5 × 1011 particles). RBCEVs were uncoated or ligated with the control or self‐peptide. The graph presents the mean intensity of CFSE ± SEM (n = 5 mice). Student's one‐tailed t‐test *P < 0.05, **P < 0.01, ***P < 0.001
FIGURE 6
FIGURE 6
Nanobodies are conjugated to RBCEVs via a linker peptide, increasing the specific uptake of RBCEVs. (a) Two‐step conjugation of RBCEVs with nanobodies: EVs were first ligated with a linker peptide which was then ligated to a VHH nanobody. (b) Western blot analysis of α‐EGFR VHH (using α‐FLAG‐tag antibody), with or without conjugation to RBCEVs, after SDS‐PAGE separation. (c) Uptake of Calcein‐labelled α‐EGFR‐VHH‐ligated RBCEVs by EGFR+ lung cancer HCC827 cells. (d) Uptake of Calcein‐labelled α‐mCherry‐VHH‐ligated RBCEVs by mCherry‐expressing breast cancer CA1a cells. (e) Uptake of Calcein‐labelled α‐HER2‐VHH‐ligated RBCEVs by HER2‐expressing breast cancer SKBR3 cells. (f) Uptake of CFSE‐labelled RBCEVs ligated with α‐EGFR or control (α‐mCherry) VHH after 2–10 h of incubation with EGFR‐positive HCC827 or H358 cells versus EGFR‐negative MOLM13 cells. Graphs in (c) – (f) present the mean intensity of Calcein AM or CFSE ± SEM (n = 3 donors), analyzed using FACS. Student's one‐tailed t‐test: **P < 0.01, ***P < 0.001
FIGURE 7
FIGURE 7
Conjugation of RBCEVs with targeting nanobodies and peptides facilitates cell‐specific delivery of therapeutic payloads. (a) Representative images of H358 cells that have taken up CFSE‐labelled RBCEVs, also stained with CellMask (red) and Hoechst (blue). (b) Mean CFSE signal per cell area unit was determined from the quantification of CFSE intensity in 1200‐1600 cells per condition. (c) Delivery of luciferase‐expressing (luc) mRNA using control (α‐mCherry‐VHH) or α‐EGFR‐VHH‐ligated RBCEVs, quantified based on luciferase activity in H358 cells after a 24‐h incubation with mRNA‐loaded RBCEVs (uncoated or ligated with VHH). Luciferase mRNA was loaded in RBCEVs using REG1 loading reagent. Graph presents luciferase signal ± SEM (n = 6 repeats). (d) Delivery of anti‐cancer drug paclitaxel (PTX) to lung cancer cells using ET‐peptide coated RBCEVs. PTX was loaded into RBCEVs using sonication. The loading capacity, percentage of PTX in RBCEVs (by weight) was determined using HPLC. Viability of H358 cells treated with different concentrations of PTX delivered by ET‐peptide‐ligated RBCEVs was calculated based on CCK8 assay readings ± SEM (n = 3 EV donors). Student's one‐tailed t‐test: **P < 0.01, ***P < 0.001
FIGURE 8
FIGURE 8
EGFR‐targeting RBCEVs accumulate in xenografted EGFR‐positive lung cancer cells. (a) Biodistribution of DiR‐labelled RBCEVs in NSG mice bearing EGFR+ H358 lung cancer. Shown are representative DiR fluorescent images of organs from lung‐cancer bearing mice preconditioned and injected with uncoated RBCEVs, control/ET‐RBCEVs or with the flowthrough of the RBCEV wash. (b) Average DiR intensity in each organ relative to the average mean intensity of all organs, subtracted by signals detected in flowthrough controls. Abbreviations: Panc, pancreas; GI, gastro‐intestinal tract. (c) In vivo uptake of CFSE‐labelled RBCEVs by mCherry‐positive H358 cancer cells, gated based on mCherry expression, in the lung of the mice that were treated with cont/ET‐peptide or cont/α‐EGFR‐VHH ligated RBCEVs, analyzed using FACS. Student's one‐tailed t‐test: *P < 0.05, **P < 0.01 (n = 3 to 5 mice)
FIGURE 9
FIGURE 9
Delivery of PTX using EGFR‐targeting RBCEVs increases the treatment efficacy in an EGFR‐positive lung cancer mouse model. (a) Representative bioluminescent images of NSG mice with EGFR+ luciferase‐expressing H358 cancer cells in the lung during a course of systemic (i.v.) treatments with 1 mg/kg PTX only or the same dose of PTX loaded in cont/ET‐RBCEVs. Treatments were repeated every 3 days and images were taken 1 day after every treatment. Colours indicate bioluminescent signals (photon/s) in two scales (the images are divided into two groups, day 1–28 and day 31–43 from the treatment start date, to avoid saturated signals).(b) Representative images of H & E staining and TUNEL assay (green fluorescence) of lung sections from the lung cancer mice treated with PTX, with or without RBCEV‐mediated delivery. Nuclei were stained with DAPI (blue). Scale bar, 100 μm. (c) Average bioluminescent signals quantified in the lung area during the development of H358 lung tumours (photons/s), normalized by the signals at the start of the treatments, and presented as mean ± SEM. (d) Average fold change in TUNEL staining signals relative to the untreated control ± SEM. Two‐way ANOVA test (c) and Student's one‐tailed t‐test (d): *P < 0.05, ***P < 0.001 (n = 3 to 4 mice)

References

    1. Alvarez‐Erviti, L. , Seow, Y. , Yin, H. , Betts, C. , Lakhal, S. , & Wood, M. J. A. (2011). Delivery of siRNA to the mouse brain by systemic injection of targeted exosomes. Nature Biotechnology 29, 341–345. - PubMed
    1. Andaloussi, S. E. L. , Mäger, I. , Breakefield, X. O. , & Wood, M. J. A. (2013). Extracellular vesicles: Biology and emerging therapeutic opportunities. Nature Reviews Drug Discovery 12, 347–357. - PubMed
    1. Antes, T. J. , Middleton, R. C. , Luther, K. M. , Ijichi, T. , Peck, K. A. , Liu, W. J. , Valle, J. , Echavez, A. K. , & Marbán, E. (2018). Targeting extracellular vesicles to injured tissue using membrane cloaking and surface display. Journal of Nanobiotechnology, 16, 61. - PMC - PubMed
    1. Armstrong, J. P. K. , Holme, M. N. , & Stevens, M. M. (2017). Re‐engineering extracellular vesicles as smart nanoscale therapeutics. ACS Nano. 11, 69–83. - PMC - PubMed
    1. Balaj, L. , Lessard, R. , Dai, L. , Cho, Y. ‐ J. , Pomeroy, S. L. , Breakefield, X. O. , & Skog, J. (2011). Tumour microvesicles contain retrotransposon elements and amplified oncogene sequences. Nature Communications 2, 180. - PMC - PubMed

Publication types

MeSH terms