. 2021 Feb 16:12:2041731420974147.
doi: 10.1177/2041731420974147. eCollection 2021 Jan-Dec.

Changes in the extracellular microenvironment and osteogenic responses of mesenchymal stem/stromal cells induced by in vitro direct electrical stimulation

Affiliations

Changes in the extracellular microenvironment and osteogenic responses of mesenchymal stem/stromal cells induced by in vitro direct electrical stimulation

Kasama Srirussamee et al. J Tissue Eng. .

Abstract

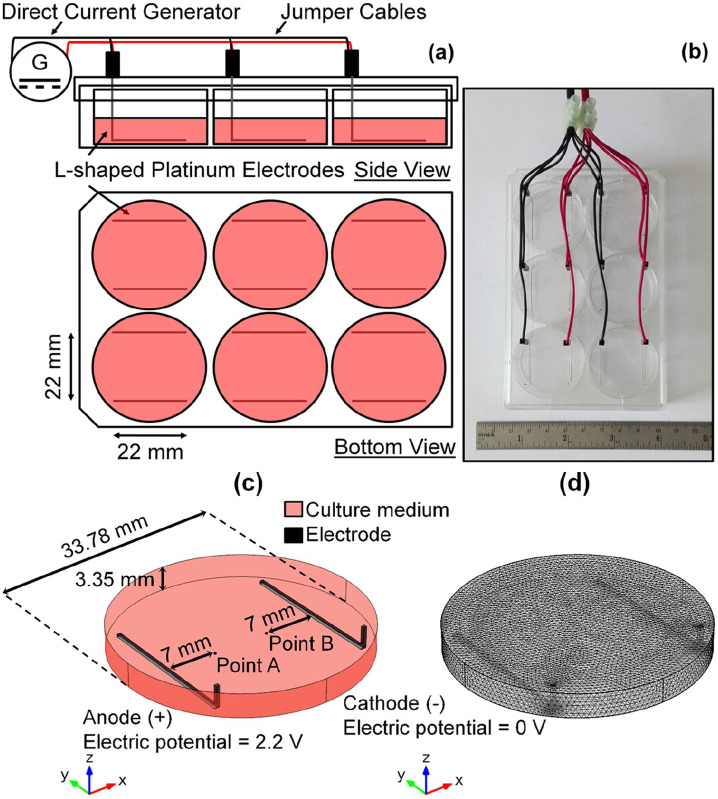
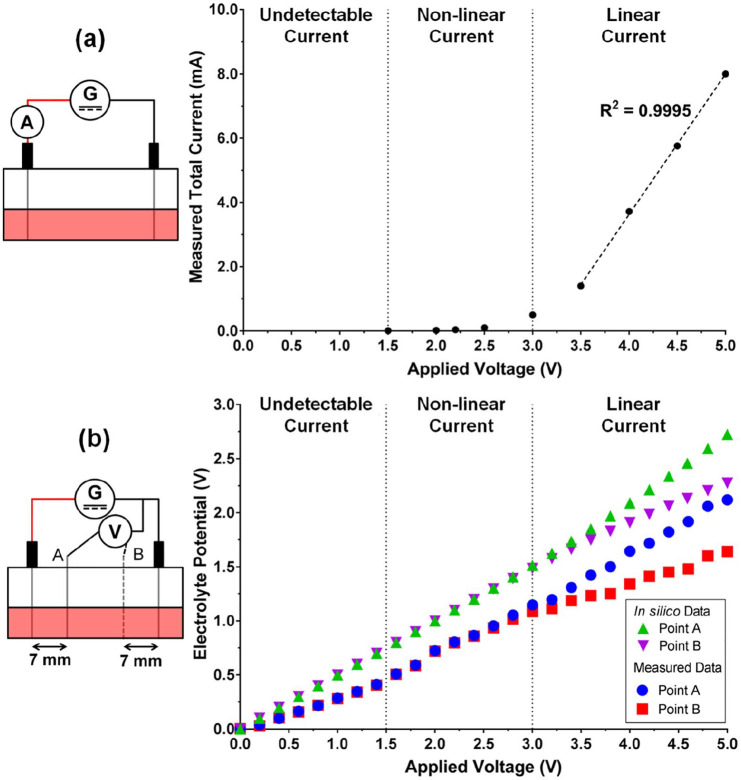
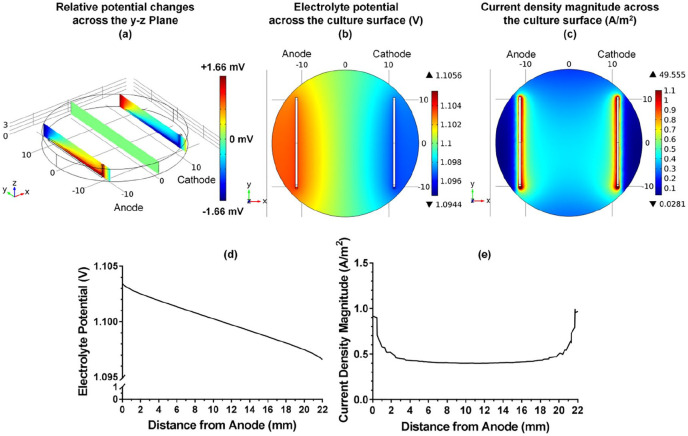
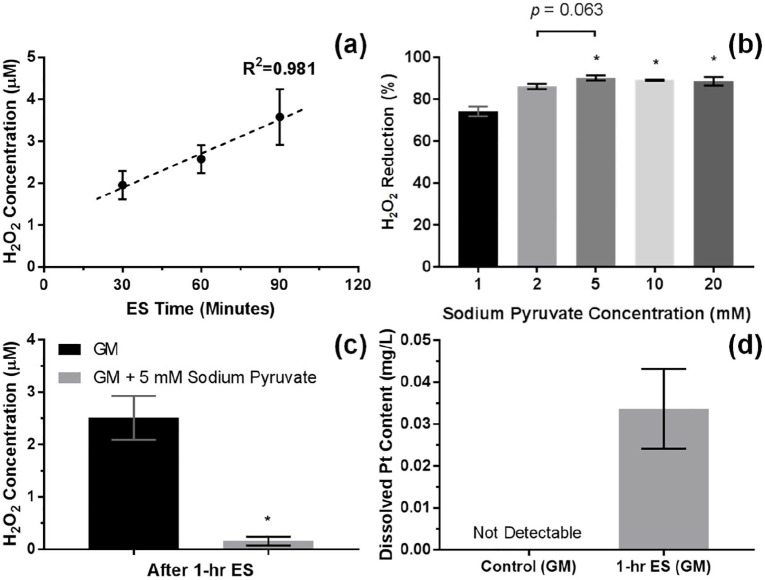
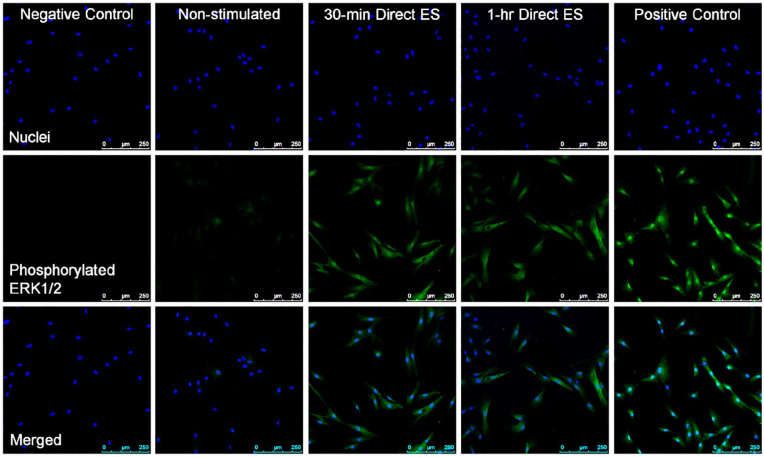
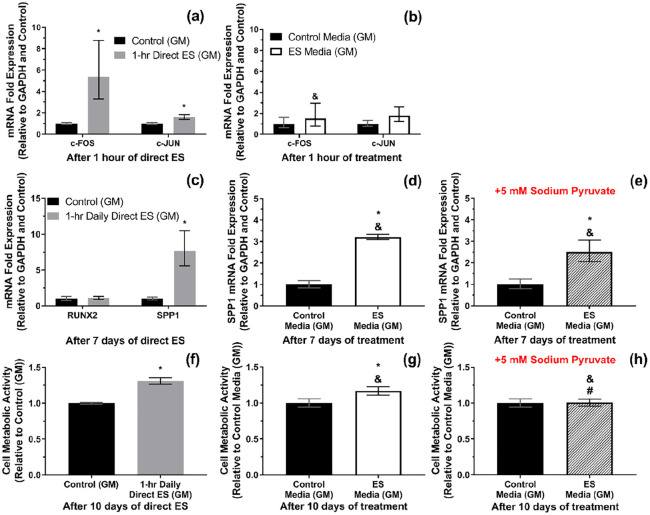
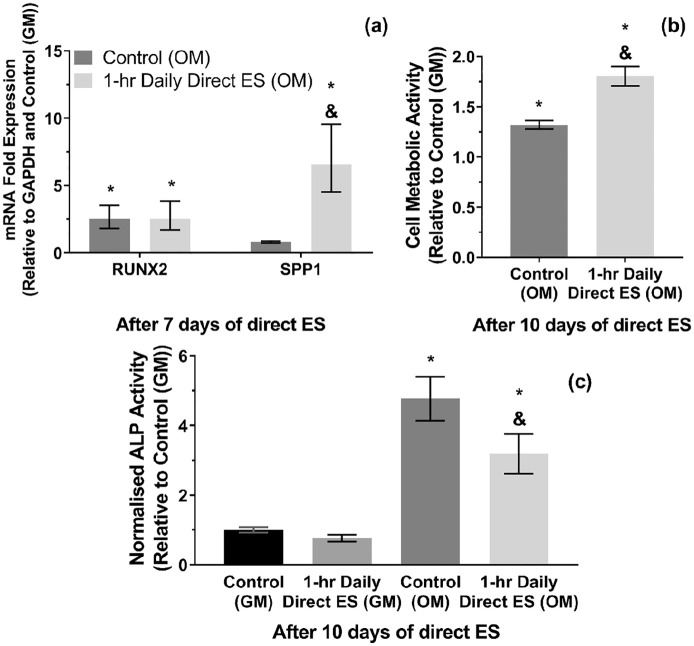
Electrical stimulation (ES) has potential to be an effective tool for bone injury treatment in clinics. However, the therapeutic mechanism associated with ES is still being discussed. This study aims to investigate the initial mechanism of action by characterising the physical and chemical changes in the extracellular environment during ES and correlate them with the responses of mesenchymal stem/stromal cells (MSCs). Computational modelling was used to estimate the electrical potentials relative to the cathode and the current density across the cell monolayer. We showed expression of phosphorylated ERK1/2, c-FOS, c-JUN, and SPP1 mRNAs, as well as the increased metabolic activities of MSCs at different time points. Moreover, the average of 2.5 μM of H2O2 and 34 μg/L of dissolved Pt were measured from the electrically stimulated media (ES media), which also corresponded with the increases in SPP1 mRNA expression and cell metabolic activities. The addition of sodium pyruvate to the ES media as an antioxidant did not alter the SPP1 mRNA expression, but eliminated an increase in cell metabolic activities induced by ES media treatment. These findings suggest that H2O2 was influencing cell metabolic activity, whereas SPP1 mRNA expression was regulated by other faradic by-products. This study reveals how different electrical stimulation regime alters cellular regenerative responses and the roles of faradic by-products, that might be used as a physical tool to guide and control cell behaviour.

Keywords: Electrical stimulation; bone regeneration; computational modelling; faradic by-products; mesenchymal stem/stromal cells.


Conflict of interest statement

Declaration of conflicting interests: The author(s) declared no potential conflicts of interest with respect to the research, authorship, and/or publication of this article.

Figures

Figure 1.
Figure 1.
Direct electrical stimulation device used in this study. (a) Schematic diagram and (b) representative image of the assembled devices. (c) Computer-aided geometry and (d) meshed structure used in computational modelling.
Figure 2.
Figure 2.
(a) Measured total current passing through one representative chamber during electrical stimulation (ES). (b) Computational (in silico) and measured electrolytic potential in one representative chamber during ES. The associated front-view schematic diagrams of each experimental set-up are shown on the left.
Figure 3.
Figure 3.
(a and b) Distribution of the computational electrolyte potential relative to the cathode at the applied voltage of 2.2 V across the y-z plane and across the x-y plane (cell culture surface), respectively. (c) Computational current density magnitude distribution across the x-y plane at the applied voltage of 2.2 V. Scale grids are in mm. (d and e) Computational electrolyte potential and current density magnitude between two electrodes at the centre of the well at the applied voltage of 2.2 V.
Figure 4.
Figure 4.
(a) H2O2 concentration of the acellular growth media (GM) in function of the electrical stimulation (ES) time. Error bars represent SD (n = 6 replicates), and dash line represents linear trend line. (b) The reduction in H2O2 concentration of the acellular GM after 1 h of ES by sodium pyruvate ranging from 1 to 20 mM relative to 0 mM. Error bars represent SD (n = 3 replicates). * represents p < 0.05 (one-way ANOVA with Tukey’s pairwise comparison) when compared with 1 mM. (c) H2O2 concentration of the acellular GM after 1 h of ES without and with 5 mM sodium pyruvate. Error bars represent SD (n = 3 experiments). *represents p < 0.05 (unpaired two-tailed Student’s t-test) when compared with GM without sodium pyruvate. (d) Measured dissolved Pt content in the acellular GM after 1 h of ES using ICP-MS. Error bars represent SD (n = 3 experiments).
Figure 5.
Figure 5.
Fluorescence images of cells after 30 min and 1 h of electrical stimulation in comparison with non-stimulated cells with 10× optical magnification. Nuclei are stained blue, and phosphorylated ERK1/2 is stained green. Scale bars = 250 µm. The images are representative from three experiments. Positive control samples are cells treated with 200 ng/ml phorbol 12-myristate 13-acetate (PMA) for 30 min, and negative control samples are also PMA-treated cells with the absence of primary antibody staining.
Figure 6.
Figure 6.
(a and b) c-FOS and c-JUN mRNA expressions after 1 h of direct electrical stimulation (ES) and after 1 h of exposure to the electrically stimulated media (ES media), respectively. (c) RUNX2 and SPP1 mRNA expression after 7 days of 1-h daily direct ES. (d and e) SPP1 expression after 7 days of treatment with ES media and ES media containing 5 mM sodium pyruvate, respectively. (f–h) Cell metabolic activity after 10 days of 1-h daily direct ES, treatment with ES media, and treatment with ES media containing 5 mM sodium pyruvate, respectively. Error bars in (a–e) represent upper and lower 95% confidence limits (n = 3 experiments). Error bars in (f–h) represent SD (n = 3 experiments). * represents p < 0.05 (unpaired two-tailed Student’s t-test) when compared with Control (non-stimulated) group. In (b), & represents p < 0.05 (unpaired two-tailed Student’s t-test) when compared with Direct ES group. In (d, e, g and h), & and # represent p < 0.05 (one-way ANOVA with Tukey’s pairwise comparison) when compared with Direct ES and ES media without sodium pyruvate groups, respectively.
Figure 7.
Figure 7.
(a) RUNX2 and SPP1 m RNA expressions after 7 days of 1-h daily direct ES in osteogenic media (OM). (b) Cell metabolic activity and (c) ALP activity after 10 days of 1-h daily direct ES in OM. Error bars in (a) represent upper and lower 95% confidence limits (n = 3 experiments). Error bars in (b and c) represent SD (n = 3 experiments). * and & represent p < 0.05 (two-way ANOVA with Tukey’s pairwise comparison) when compared with Control (GM) and Control (OM) groups, respectively.

Similar articles

Cited by

References

    1. Yasuda I. The classic fundamental aspects of fracture treatment. Clin Orthop Relat R 1977; 124: 5–8. - PubMed
    1. Bassett CA, Pawluk RJ, Becker RO. Effects of electric currents on bone in vivo. Nature 1964; 204: 652–654. - PubMed
    1. Baranowski TJ, Black J, Brighton CT, et al. Electrical osteogenesis by low direct current. J Orthop Res 1983; 1: 120–128. - PubMed
    1. Brighton CT, Friedenberg ZB, Black J, et al. Electrically induced osteogenesis - relationship between charge, current-density, and the amount of bone formed - introduction of a new cathode concept. Clin Orthop Relat R 1981; 161: 122–132. - PubMed
    1. Bassett CA, Pawluk RJ, Pilla AA. Acceleration of fracture repair by electromagnetic fields. A surgically noninvasive method. Ann N Y Acad Sci 1974; 238: 242–262. - PubMed