. 2021 Jan 16:11:05002.
doi: 10.7189/jogh.10.05002.

The effect of COVID-19 on the economy: Evidence from an early adopter of localized lockdowns

Affiliations

The effect of COVID-19 on the economy: Evidence from an early adopter of localized lockdowns

Kenzo Asahi et al. J Glob Health. .

Abstract

Background: Governments worldwide have implemented large-scale non-pharmaceutical interventions, such as social distancing or school closures, to prevent and control the growth of the COVID-19 pandemic. These strategies, implemented with varying stringency, have imposed substantial social and economic costs to society. As some countries begin to reopen and ease mobility restrictions, lockdowns in smaller geographic areas are increasingly considered an attractive policy intervention to mitigate societal costs while controlling epidemic growth. Nevertheless, there is a lack of empirical evidence to support these decisions.

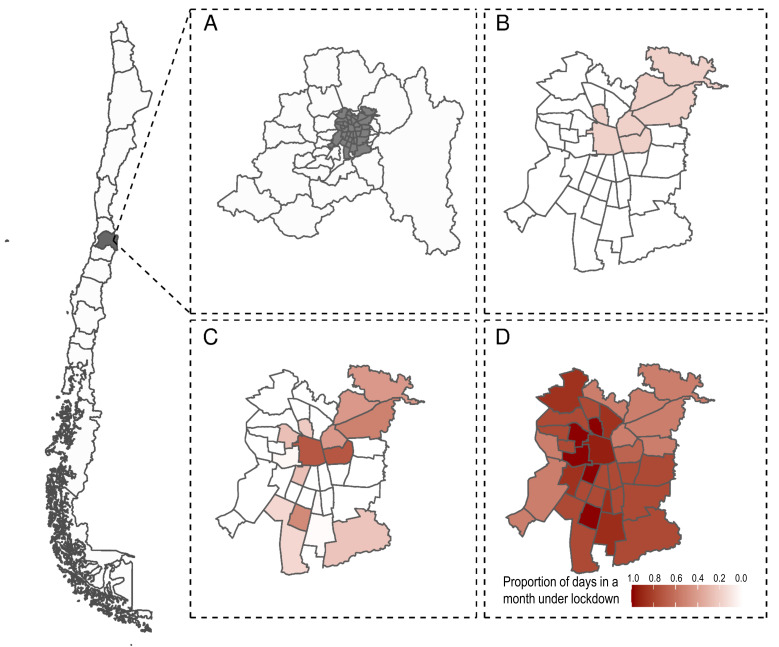
Methods: Drawing from a rich data set of localized lockdowns in Chile, we used econometric methods to measure the reduction in local economic activity from lockdowns when applied to smaller or larger geographical areas. We measured economic activity by tax collection at the municipality-level.

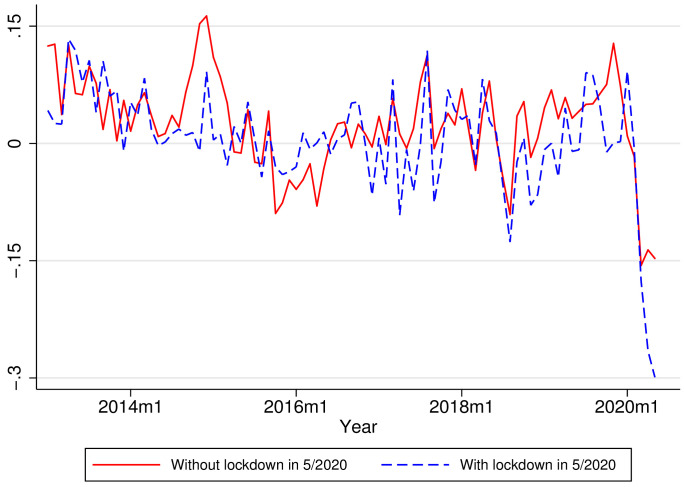
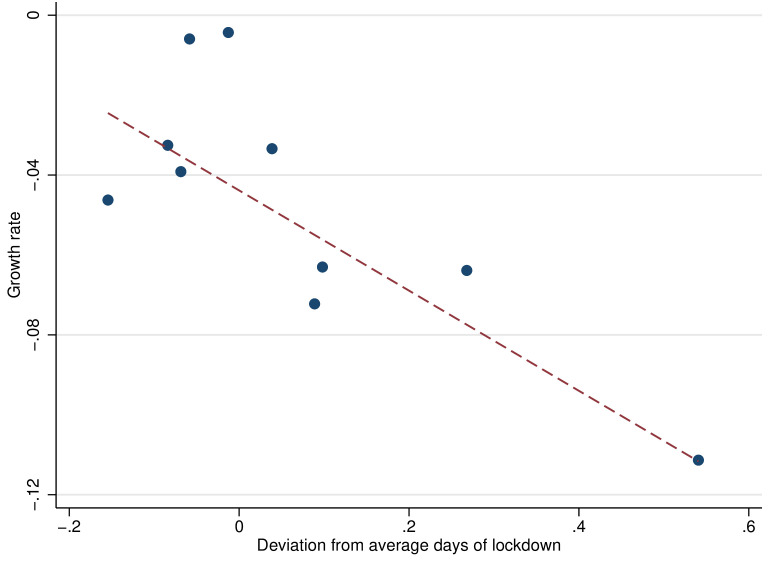
Results: Our results show that lockdowns were associated with a 10%-15% drop in local economic activity, which is twice the reduction in local economic activity suffered by municipalities that were not under lockdown. A three-to-four-month lockdown had a similar effect on economic activity than a year of the 2009 great recession. We found costs are proportional to the population under lockdown, without differences when lockdowns were measured at the municipality or city-wide levels.

Conclusions: Our findings suggest that localized lockdowns have a large effect on local economic activity, but these effects are proportional to the population under lockdown. Our results suggest that epidemiological criteria should guide decisions about the optimal size of lockdown areas since the proportional impact of lockdowns on the economy seems to be unchanged by scale.


Conflict of interest statement

Competing interests: The authors completed the Unified Competing Interest form at www.icmje.org/coi_disclosure.pdf (available upon request from the corresponding author), and declare no conflicts of interest.

Figures

Figure 1
Figure 1
Illustration of localized lockdowns at the municipality level, Greater Santiago, Chile, March-May 2020. To control COVID-19 growth, the Ministry of Health implemented localized lockdowns at the country's municipality level, the smallest administrative subdivision. The figure illustrates these lockdowns implemented in Greater Santiago (A in grey) during different months: March (B), April (C), and May (D), where the colour scale represents the proportion of days in a month under lockdown for each municipality.
Figure 2
Figure 2
VAT and population cumulative distribution across all municipalities. Panel (a) shows the proportion of total 2018 VAT considered in our baseline sample. We sorted the 343 municipalities in our data set in ascending order by 2018 VAT. We calculated the accumulated tax from the one with the lowest to the highest VAT level. Municipalities not considered in our baseline sample account for 2.9% of the total 2018 VAT (darker area), while the remaining 97.1% (lighter area) is in our preferred sample. Panel (b) shows the proportion of the total population, according to the 2017 Census within our preferred sample. In this case, we sorted the municipalities in ascending order. We then calculated the total population's accumulated percentage not considered in our sample, which is 10.9% (darker area). Hence, the remaining 89.1% (lighter area) is in our sample.
Figure 3
Figure 3
Median of the real value-added-tax (VAT) year-on-year growth rates. The graphs show the median of VAT growth rates for municipalities under lockdown in May 2020 (blue) and municipalities that were not under lockdown (red). The median of the value-added-tax (VAT) growth rate in May 2020 for municipalities with and without lockdown is 2.67 and 5.37 standard deviations lower than the mean of such medians in the 2006-2019 period. The sample of municipalities includes municipalities over the 50th percentile of the total 2018 VAT.
Figure 4
Figure 4
Effect of lockdown on value-added-tax (VAT) collection for January 2020 through May 2020, controlling for month and municipality fixed effects. The results show the association between lockdown on VAT collection for January 2020 through May 2020, controlling for month and municipality fixed effects. We group the municipalities of our baseline sample into equal-sized bins according to days of lockdown between January 2020 and May 2020. Each dot represents the mean VAT collection growth rate (y-axis) and the mean deviation from lockdown as a percentage of a month (x-axis) within each bin. Each bin has 17 municipalities. The red dashed line represents the population regression line.

References

    1. Ledford H, Cyranoski D, Noorden RV.The UK has approved a COVID vaccine – here’s what scientists now want to know. Nature. 2020;588:205-6. 10.1038/d41586-020-03441-8 - DOI - PubMed
    1. Tanne JH.Covid-19: FDA panel votes to authorise Pfizer BioNTech vaccine. BMJ. 2020;371:m4799. 10.1136/bmj.m4799 - DOI - PubMed
    1. Hsiang S, Allen D, Annan-Phan S, Bell K, Bolliger I, Chong T, et al. The effect of large-scale anti-contagion policies on the COVID-19 pandemic. Nature. 2020;584:262-7. 10.1038/s41586-020-2404-8 - DOI - PubMed
    1. Walker PGT, Whittaker C, Watson OJ, Baguelin M, Winskill P, Hamlet A, et al. The impact of COVID-19 and strategies for mitigation and suppression in low- and middle-income countries. Science. 2020;369:413-22. - PMC - PubMed
    1. Wiersinga WJ, Rhodes A, Cheng AC, Peacock SJ, Prescott HC.Pathophysiology, Transmission, Diagnosis, and Treatment of Coronavirus Disease 2019 (COVID-19): A Review. JAMA. 2020;324:782-93. 10.1001/jama.2020.12839 - DOI - PubMed