

Mathematical modeling of the SARS-CoV-2 epidemic in Qatar and its impact on the national response to COVID-19
- PMID: 33643638
- PMCID: PMC7897910
- DOI: 10.7189/jogh.11.05005
Mathematical modeling of the SARS-CoV-2 epidemic in Qatar and its impact on the national response to COVID-19
Abstract
Background: Mathematical modeling constitutes an important tool for planning robust responses to epidemics. This study was conducted to guide the Qatari national response to the severe acute respiratory syndrome coronavirus 2 (SARS-CoV-2) epidemic. The study investigated the epidemic's time-course, forecasted health care needs, predicted the impact of social and physical distancing restrictions, and rationalized and justified easing of restrictions.
Methods: An age-structured deterministic model was constructed to describe SARS-CoV-2 transmission dynamics and disease progression throughout the population.
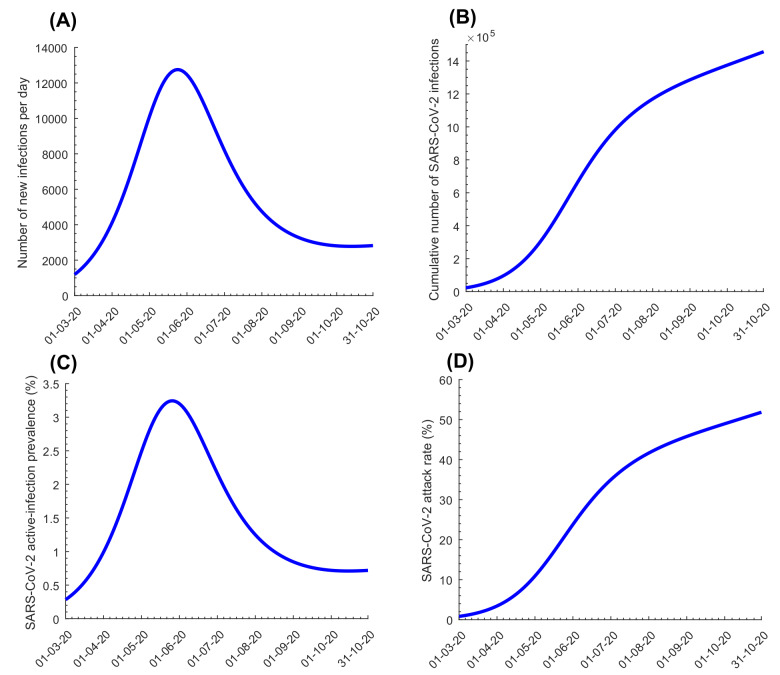
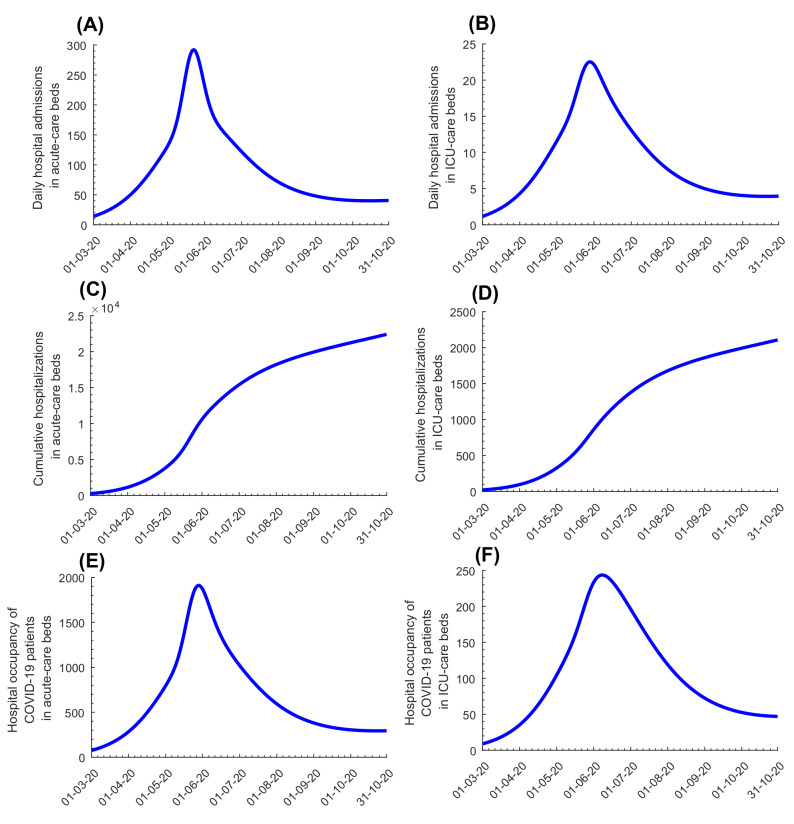
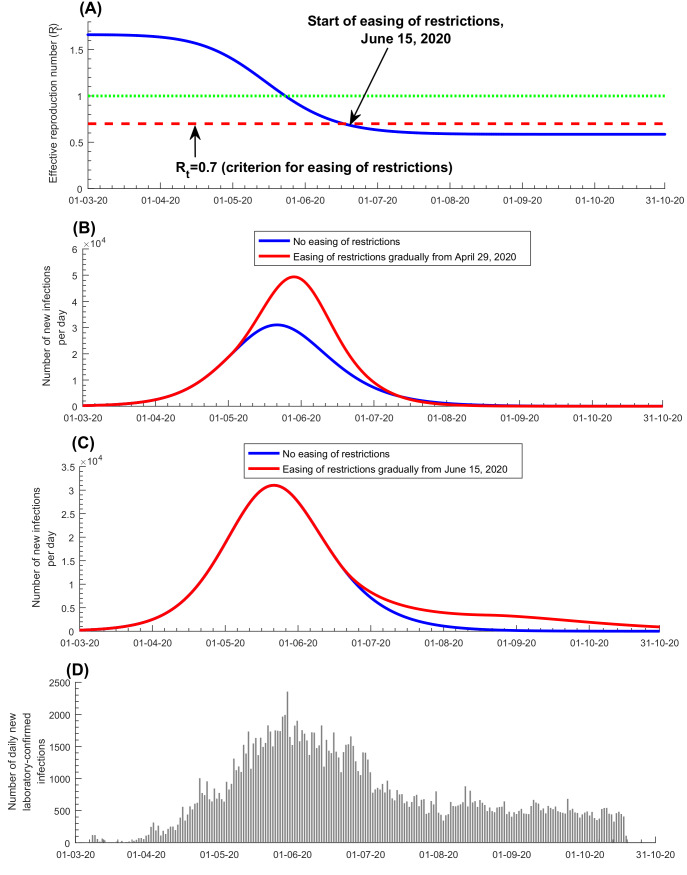
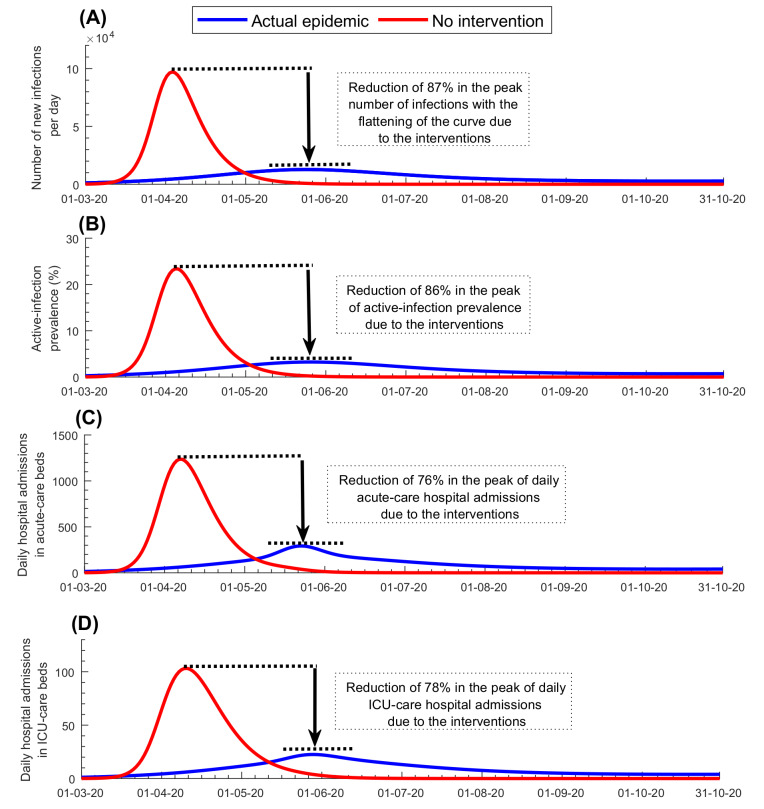
Results: The enforced social and physical distancing interventions flattened the epidemic curve, reducing the peaks for incidence, prevalence, acute-care hospitalization, and intensive care unit (ICU) hospitalizations by 87%, 86%, 76%, and 78%, respectively. The daily number of new infections was predicted to peak at 12 750 on May 23, and active-infection prevalence was predicted to peak at 3.2% on May 25. Daily acute-care and ICU-care hospital admissions and occupancy were forecast accurately and precisely. By October 15, 2020, the basic reproduction number R0 had varied between 1.07-2.78, and 50.8% of the population were estimated to have been infected (1.43 million infections). The proportion of actual infections diagnosed was estimated at 11.6%. Applying the concept of Rt tuning, gradual easing of restrictions was rationalized and justified to start on June 15, 2020, when Rt declined to 0.7, to buffer the increased interpersonal contact with easing of restrictions and to minimize the risk of a second wave. No second wave has materialized as of October 15, 2020, five months after the epidemic peak.
Conclusions: Use of modeling and forecasting to guide the national response proved to be a successful strategy, reducing the toll of the epidemic to a manageable level for the health care system.
Copyright © 2021 by the Journal of Global Health. All rights reserved.
Conflict of interest statement
Competing interests: The authors completed the ICMJE Unified Competing Interest form (available upon request from the corresponding author), and declare no conflicts of interest.
Figures
References
-
- Anderson RM, May RM. Infectious diseases of humans: dynamics and control. Oxford; New York: Oxford University Press; 1991.
-
- Planning and Statistics Authority-State of Qatar. The Simplified Census of Population, Housing & Establishments. 2019. Available https://www.psa.gov.qa/en/statistics/Statistical%20Releases/Population/P.... Accessed: 2 April 2020.
MeSH terms
LinkOut - more resources
Full Text Sources
Other Literature Sources
Medical
Miscellaneous
