

Estimation of parameters for a humidity-dependent compartmental model of the COVID-19 outbreak
- PMID: 33643707
- PMCID: PMC7897412
- DOI: 10.7717/peerj.10790
Estimation of parameters for a humidity-dependent compartmental model of the COVID-19 outbreak
Abstract
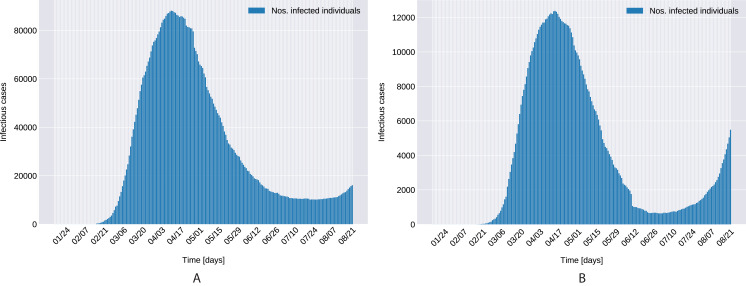
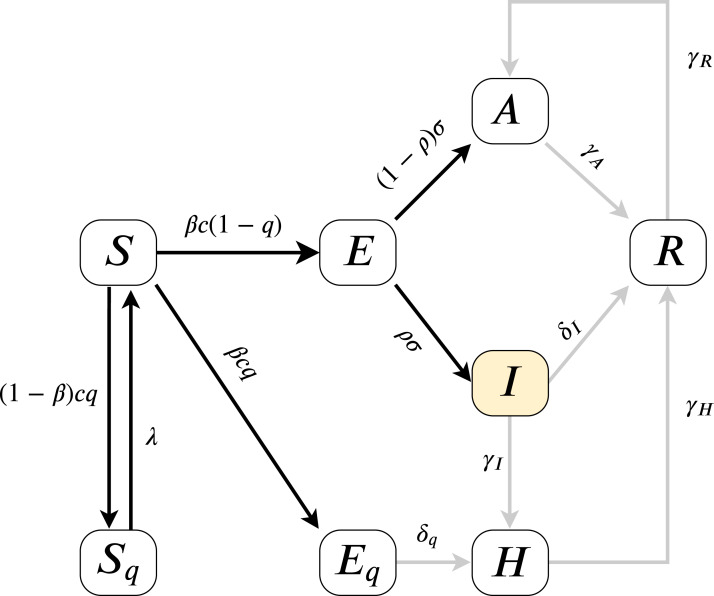
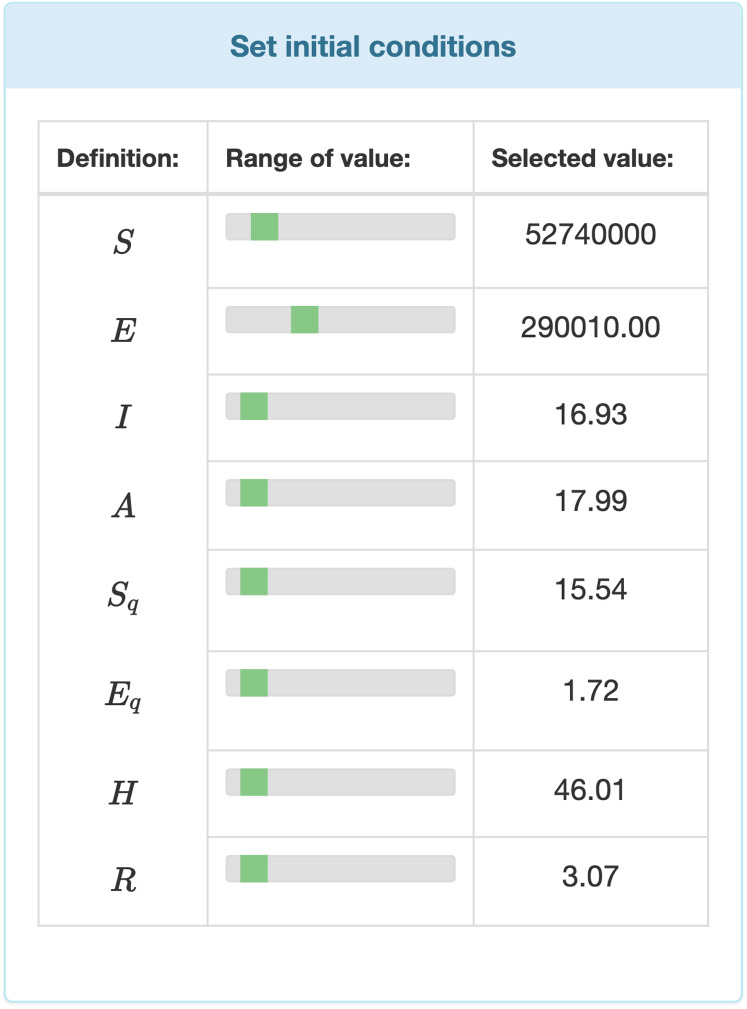
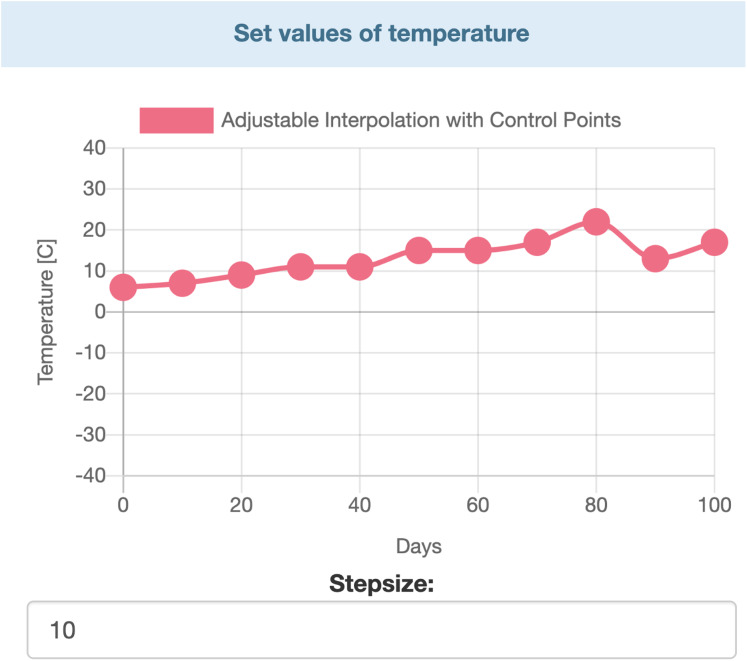
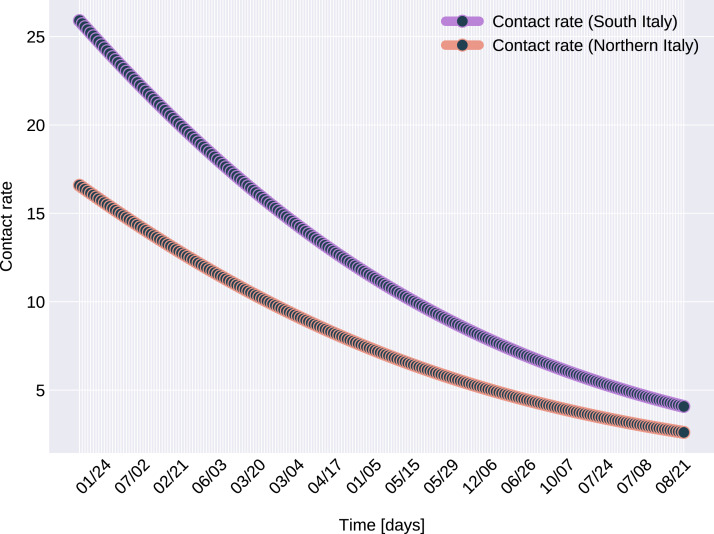
Building an effective and highly usable epidemiology model presents two main challenges: finding the appropriate, realistic enough model that takes into account complex biological, social and environmental parameters and efficiently estimating the parameter values with which the model can accurately match the available outbreak data, provide useful projections. The reproduction number of the novel coronavirus (SARS-CoV-2) has been found to vary over time, potentially being influenced by a multitude of factors such as varying control strategies, changes in public awareness and reaction or, as a recent study suggests, sensitivity to temperature or humidity changes. To take into consideration these constantly evolving factors, the paper introduces a time dynamic, humidity-dependent SEIR-type extended epidemiological model with range-defined parameters. Using primarily the historical data of the outbreak from Northern and Southern Italy and with the help of stochastic global optimization algorithms, we are able to determine a model parameter estimation that provides a high-quality fit to the data. The time-dependent contact rate showed a quick drop to a value slightly below 2. Applying the model for the COVID-19 outbreak in the northern region of Italy, we obtained parameters that suggest a slower shrinkage of the contact rate to a value slightly above 4. These findings indicate that model fitting and validation, even on a limited amount of available data, can provide useful insights and projections, uncover aspects that upon improvement might help mitigate the disease spreading.
Keywords: COVID-19; Data fitting; Mathematical model; PSO algorithm; Parameter estimation SARS-nCoV-2.
© 2021 Farkas et al.
Conflict of interest statement
The authors declare that they have no competing interests.
Figures
References
-
- Adnani J, Hattaf K, Yousfi N. Stability analysis of a stochastic SIR epidemic model with specific nonlinear incidence rate. International Journal of Stochastic Analysis. 2013;2013:4.
-
- Akman D, Akman O, Schaefer E. Parameter estimation in ordinary differential equations modeling via particle swarm optimization. Journal of Applied Mathematics. 2018;2018:1–9. doi: 10.1155/2018/9160793. - DOI
-
- Akman O, Corby MR, Schaefer E. Examination of models for cholera: insights into model comparison methods. Letters in Biomathematics. 2016;3(1):93–118. doi: 10.30707/LiB3.1Akman. - DOI
-
- Anderson RM, May RM. Infectious diseases of humans: dynamics and control. Oxford: Oxford University Press; 1992.
LinkOut - more resources
Full Text Sources
Other Literature Sources
Miscellaneous
