. 2020 Dec 31;8(4):2001961.
doi: 10.1002/advs.202001961. eCollection 2021 Feb.

RNF219/ α-Catenin/LGALS3 Axis Promotes Hepatocellular Carcinoma Bone Metastasis and Associated Skeletal Complications

Affiliations

RNF219/ α-Catenin/LGALS3 Axis Promotes Hepatocellular Carcinoma Bone Metastasis and Associated Skeletal Complications

Shuxia Zhang et al. Adv Sci (Weinh). .

Erratum in

Abstract

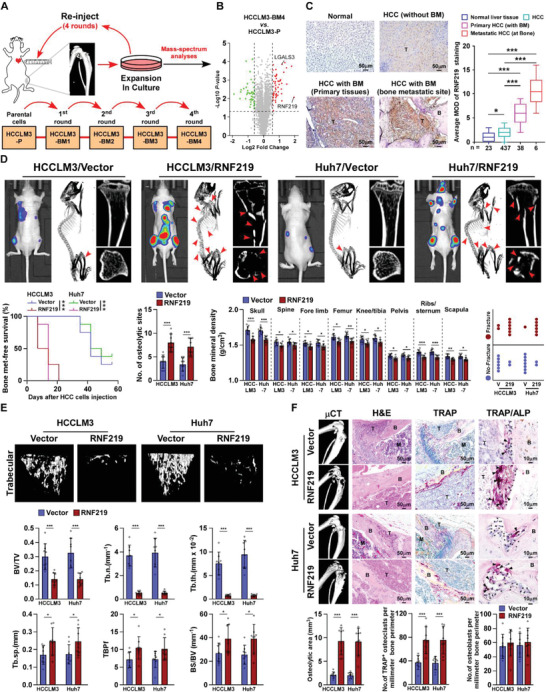
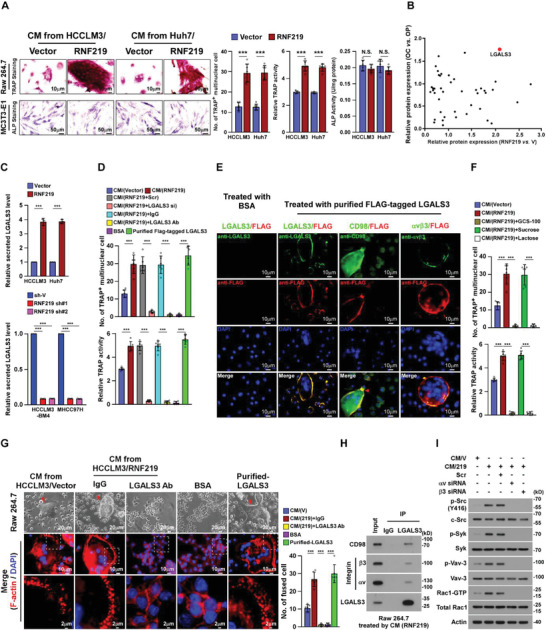
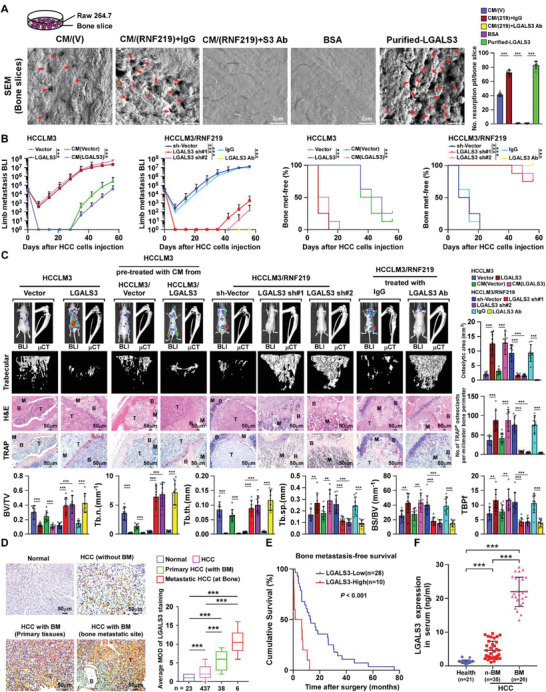
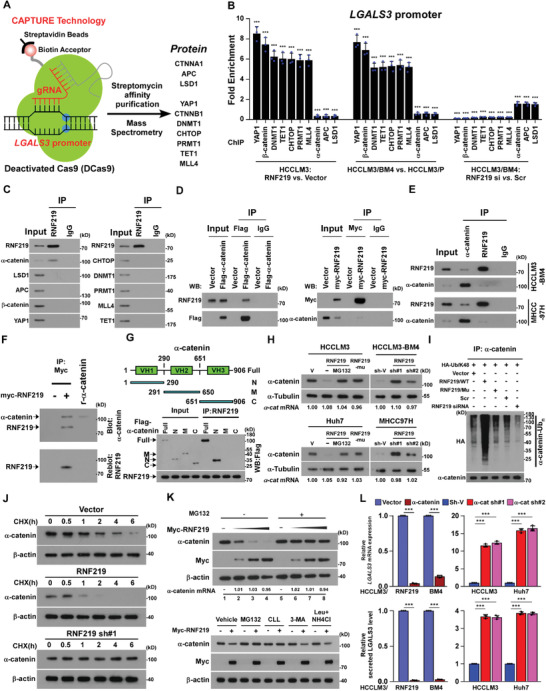
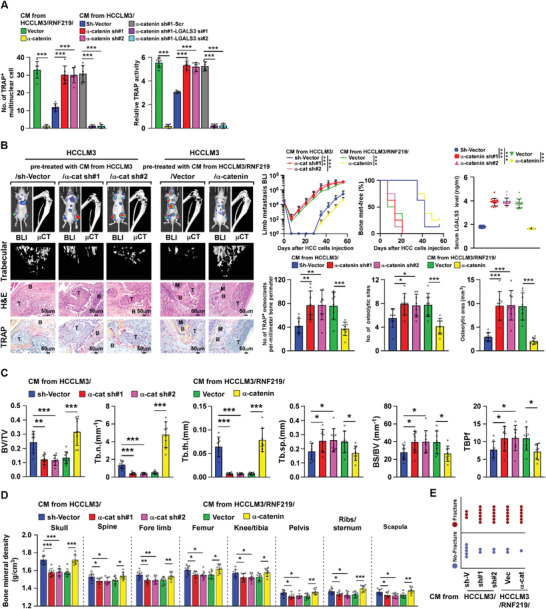
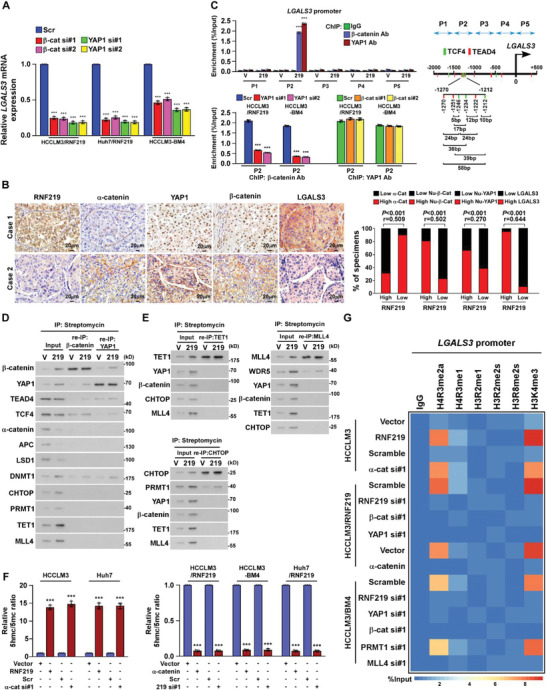
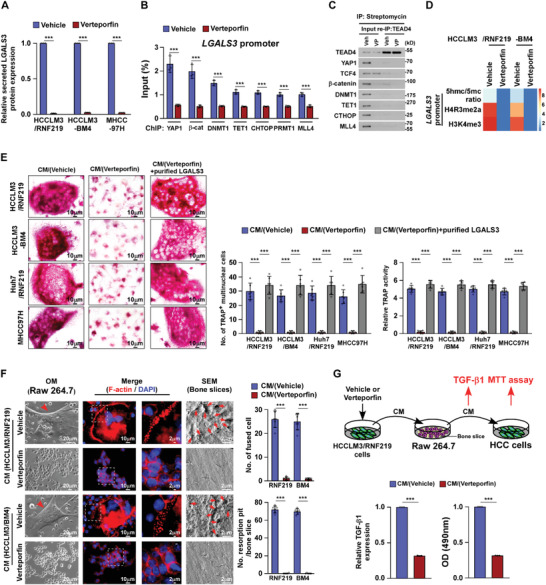
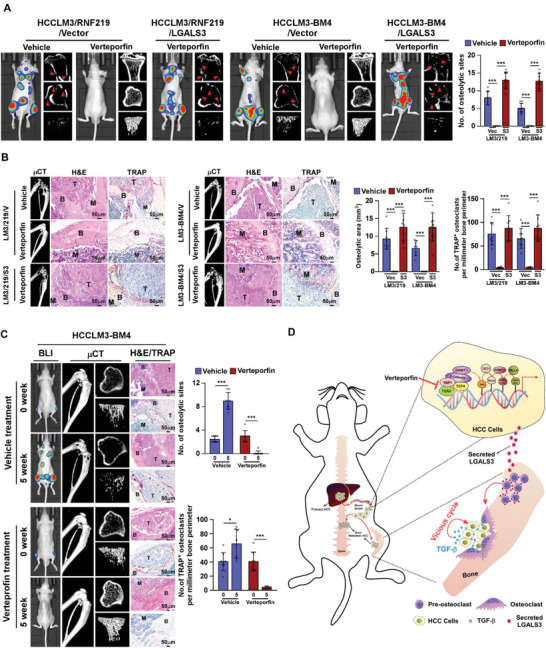
The incidence of bone metastases in hepatocellular carcinoma (HCC) has increased prominently over the past decade owing to the prolonged overall survival of HCC patients. However, the mechanisms underlying HCC bone-metastasis remain largely unknown. In the current study, HCC-secreted lectin galactoside-binding soluble 3 (LGALS3) is found to be significantly upregulated and correlates with shorter bone-metastasis-free survival of HCC patients. Overexpression of LGALS3 enhances the metastatic capability of HCC cells to bone and induces skeletal-related events by forming a bone pre-metastatic niche via promoting osteoclast fusion and podosome formation. Mechanically, ubiquitin ligaseRNF219-meidated α-catenin degradation prompts YAP1/β-catenin complex-dependent epigenetic modifications of LGALS3 promoter, resulting in LGALS3 upregulation and metastatic bone diseases. Importantly, treatment with verteporfin, a clinical drug for macular degeneration, decreases LGALS3 expression and effectively inhibits skeletal complications of HCC. These findings unveil a plausible role for HCC-secreted LGALS3 in pre-metastatic niche and can suggest a promising strategy for clinical intervention in HCC bone-metastasis.

Keywords: LGALS3; RNF219; bone metastasis; hepatocellular carcinoma; skeletal‐related events.


Conflict of interest statement

The authors declare no conflict of interest.

Figures

Figure 1
Figure 1
RNF219 overexpression promotes bone metastasis and SREs in HCC. A) Schematic representation of the establishment of a highly bone‐metastasis HCCLM3‐BM4 cell line. Tumor cells were isolated from bone lesions in mice injected intracardially with HCCLM3‐P/luc cells and cultured, and re‐injected intracardially into mice. This procedure was repeated for four cycles. B) Volcano plot analysis of dysregulated proteins comparing HCCLM3‐BM4 cells with HCCLM3‐P cells. C) Representative images (left) and quantification (right) of RNF219 expression in normal liver tissue (n = 23), HCC tissues without bone‐metastasis (n = 437), primary HCC tissues with bone‐metastasis (n = 38), and HCC bone‐metastasis tissues (n = 6) (left panel). Scale bar, 50 µm. D) Upper: BLI (left) and µCT images (middle and right) of bone lesions from representative mice. Arrowheads: fractured bone site. Lower: Kaplan–Meier bone metastasis‐free survival curve and quantification of the osteolytic sites, BMD and fracture frequency from representative mice (n = 8/group). E) µCT images of trabecular section (upper) and quantification (lower) of bone parameters from representative mice (n = 8/group). BV/TV, bone/tissue volume ratio; BS/TV, bone surface/ tissue volume ratio; Tb. n, trabecular number; Tb. sp., trabecular separation; Tb. th., trabecular thickness; TBPf, trabecular bone pattern factor. F) µCT and histological (H&E, TRAP and TRAP/ALP) images (upper) and quantification (lower) of osteolytic area and TRAP+‐osteoclasts/ALP+‐osteoblasts along the bone‐tumor interface of metastases from representative mice (n = 8/group). Scale bar, 50 µm. Each error bar in panels (C−F) represents the mean ± SD of three independent experiments. Significant differences were determined by one‐way ANOVA with Tukey's multiple comparison test (C–F). * p < 0.05, ** p < 0.01, *** p < 0.001.
Figure 2
Figure 2
RNF219 induced‐LGALS3 promotes osteoclastogenesis in vitro. A) Left: Osteoclast differentiation assays by TRAP staining (upper) or osteoblast differentiation assay by ALP staining (lower) in the presence of CM from indicated cells. Right: Quantification of the number of TRAP+‐multinuclear osteoclasts, TRAP activity and ALP activity from the experiment in the left panel. B) Scatter diagram generated from dysregulated proteins in CM‐HCCLM3/vector compared with CM‐HCCLM3/RNF219 and in osteoclast (OC) compared with osteoclast precursor (OP). A full list is available in Table S7, Supporting Information. C) ELISA analysis of secreted LGALS3 protein expression in CM from indicated cells. D) Osteoclast differentiation assays in the presence of the indicated CM, or BSA, or purified LGALS3 from CM‐HCCLM3/Flag‐tagged LGALS3 cells. E) Osteoclast precursor Raw 264.7 cells were treated with BSA, or purified LGALS3 from CM‐HCCLM3/flag‐tagged LGALS3 cells, and then IF staining of LGALS3, Flag‐LGALS3, CD98 and integrin αvβ3. Scale bar, 10 µm. F) Quantification of the osteoclast differentiation in the presence of the CM‐HCCLM3/Vector, or CM‐HCCLM3/RNF219, or CM‐HCCLM3 plus GCS‐100, or CM‐HCCLM3 plus sucrose, or CM‐HCCLM3 plus lactose. G) Left: Phase contrast micrograph of RAW 264.7 cells as indicated treatments (upper) and IF staining images of phalloidin (F‐actin) (middle and lower). Scale Bar, 20 µm (upper), 10 µm (middle) and 2 µm (lower). Right: Quantification of the number of fused multinuclear cells from the experiment in the left panel. H) Co‐IP assays using anti‐LGALS3 or anti‐IgG antibodies in CM‐HCCLM3/RNF219‐treated RAW264.7 cells and WB analysis of expression of CD98, integrin αv, integrin β3, and LGALS3. I) WB analysis of phosphorylation level of SRC, SYK, and VAV‐3 and expression of RAC‐GTP in Raw 264.7 cells as indicated treatments. β‐actin served as the loading control. Each error bar in panels A, C, D, F, and G represents the mean ± SD of three independent experiments. Significant differences were determined by one‐way ANOVA with Tukey's multiple comparison test (A, C, D, F, and G). ** p < 0.01, *** p < 0.001 and N.S.: not significant (p > 0.05).
Figure 3
Figure 3
LGALS3 promotes osteolytic bone metastasis of HCC. A) Bone resorption assays of RAW 264.7 cells cultured onto the bone slices for indicated treatments. Then bone slice was fixed for scanning electron microscopy (SEM) (left) and quantification of the number of resorption pit per bone slice (right). B) Normalized BLI signals of bone metastases and Kaplan–Meier bone metastasis‐free survival curve of mice from the indicated experimental group (n = 8/group). C) Upper left: BLI, μCT (longitudinal and trabecular section), and histological (H&E and TRAP staining) images of bone lesions from representative mice. Scale bar, 50 µm. Upper right and lower: Quantification of the μCT osteolytic lesion area and TRAP+ osteoclasts along the bone‐tumor interface of metastases (upper right) and bone parameters (lower) from the experiment in the upper left panel. D) Representative images (left) and quantification (right) of LGALS3 expression in normal liver tissue (n = 23), HCC tissues without bone metastasis (n = 437), primary HCC tissues with bone metastasis (n = 38), and HCC tissues in bone metastatic site (n = 6) (left panel). Scale bar, 50 µm. E) Kaplan–Meier analysis of bone metastasis‐free survival curves in HCC‐BM with low versus high expression of LGALS3 (n = 38; p < 0.001, log‐rank test). F) ELISA analysis of serum LGALS3 expression from healthy donors (n = 21), HCC patients without bone metastasis (n‐BM, n = 35), HCC patients with bone metastasis (BM, n = 26). Each error bar in panels (A–D) and (F) represents the mean ± SD of three independent experiments. Significant differences were determined by one‐way ANOVA with Tukey's multiple comparison test (A–D, F). ** p < 0.01, *** p < 0.001.
Figure 4
Figure 4
RNF219‐mediated α‐catenin proteasomal degradation induced LGALS3 upregulation. A) Schematic of dCas9‐mediated capture of LGALS3 promoter using five sequence‐specific sgRNAs (Left) and mass spectrometry (MS) analysis of trans‐regulatory factors targeting LGALS3 promoter (right). B) ChIP analyses of enrichment of the indicated trans‐regulatory factors on the LGALS3 promoter. C) Co‐IP analysis of interaction of RNF219 with the indicated trans‐regulatory factors in HCCLM3 cells. D) Co‐IP/IB analysis of expression of RNF219 and immunoprecipitated flag‐α‐catenin (left) and IB analysis of expression of α‐catenin and immunoprecipitated myc‐RNF219 (right) in the indicated cells. E) Co‐IP/IB analyses of expression of RNF219 and α‐catenin using indicated antibodies. F) Far‐western blotting analysis was performed using anti‐Myc antibody‐immunoprecipitated proteins and detected using anti‐α‐catenin antibody and then reblotted with anti‐RNF219 antibody. Recombinant α‐catenin served as the control. G) Schematic illustration of the wild‐type and truncated α‐catenin protein (upper) and co‐IP assays were performed using anti‐RNF219 antibody in the indicated cells (lower). H) IB analysis of α‐catenin expression and I) K48‐linked polyubiquitin levels of α‐catenin in the indicated cells. α‐tubulin served as a loading control. J) IB analysis of the half‐life of α‐catenin protein in the indicated cells treated with cycloheximide. β‐actin served as a loading control. K) IB analysis of α‐catenin and myc‐RNF219 expression in the 0, 0.5, 1.5, and 5.0 µg of myc‐RNF219‐tranfected cells treated without or with MG132 (20 µm, upper) or in the myc‐RNF219‐tranfected cells treated with the vehicle or each inhibitor (20 µm MG132, 20 µm cLL, 10 mm 3‐MA, or 100 µm leupeptin and 20 mm NH4Cl) (lower). β‐actin served as a loading control. L) Real‐time PCR analysis and ELISA analysis of mRNA and serum LGALS3 expression in the indicated cells. GAPDH served as a loading control. Each error bar in panels B, L represents the mean ± SD of three independent experiments. Significant differences were determined by Student's t‐test (B) and one‐way ANOVA with Tukey's multiple comparison test (L). *** p < 0.001.
Figure 5
Figure 5
α‐catenin reduction is vital for RNF219/LGALS3‐induced bone metastasis and SREs. A) Quantification of the osteoclast differentiation in the presence of CM collected from the indicated cells. B) Left: BLI, μCT (longitudinal and trabecular section), and histological (H&E and TRAP staining) images of bone lesions from representative mice. Scale bar, 50 µm. Right upper: Normalized BLI signals of bone metastases, Kaplan–Meier bone metastasis‐free survival curve of mice from indicated experimental mice and ELISA analysis of serum LGALS3 expression in the indicated mice (n = 8/group). Right lower: quantification of the TRAP+ osteoclasts along the bone‐tumor interface of metastases and μCT osteolytic lesion sites and area from experiment in left panel. C) Quantification of the bone parameters analyzed by μCT assay, and D) BMD, and E) fracture frequency in the indicated mice from the experiment in Figure 5B. Each error bar in panels (A–D) represents the mean ± SD of three independent experiments. Significant differences were determined by one‐way ANOVA with Tukey's multiple comparison test (A–D). * p < 0.05, ** p < 0.01, *** p < 0.001.
Figure 6
Figure 6
RNF219 induced spatial epigenetic modifications of the LGALS3 promoter. A) Real‐time PCR analysis of mRNA level of LGALS3 in the indicated cells. GAPDH serve as a loading control. B) RNF219 levels were negatively associated with α‐catenin and positively related to nuclear β‐catenin, YAP1, or LGALS3 expression in 475 human HCC specimens. Left: Two representative specimens are shown. Scale bars, 20 µm. Right: Percentages of specimens showing low or high RNF219 expression relative to the levels of α‐catenin, nuclear β‐catenin, nuclear YAP1, or LGALS3. C) Left: ChIP assay analyses of enrichment of β‐catenin and YAP1 on the LGALS3 promoter in the indicated cells. Right: Schematic illustration of TCF4 and TEAD4 binding site at LGALS3 promoter. D) Re‐co‐IP assay, using CAPTURE‐approached proteins, analyses of interaction of β‐catenin or YAP1 with the indicated trans‐regulatory factors, identified in experiment in Figure 4A, in vector‐ or RNF219‐transduced HCCLM3 cells. E) Re‐co‐IP assay, using CAPTURE‐approached proteins, analyses of interaction of TET1 (left upper), or CHTOP 9 (left lower), or MLL4 (right upper) with the indicated trans‐regulatory factors on the LGALS3 promoter in the vector‐ or RNF219‐transduced HCCLM3 cells. F) Relative 5hmc/5mc ratio was examined in the indicated cells. G) Heatmap represented by pseudocolors was generated using the ChIP‐qPCR values that represented the enrichment of H4R3me2a, H4R3me1, H2AR11me1, H3R2me1, H3R2me2s, H3R8me2s, and H3K4me3 on the LGALS3 promoter in the indicated cells. Each error bar in panels (A,C,F) represents the mean ± SD of three independent experiments. Significant differences were determined by one‐way ANOVA with Tukey's multiple comparison test (A,C,F). *** p < 0.001.
Figure 7
Figure 7
Verteporfin treatment represses LGALS3 expression and inhibits osteoclastogenesis. A) ELISA analysis of secreted LGALS3 protein expression in the indicated cells. B) ChIP assays analyses of enrichment of YAP1, β‐catenin, DNMT1, CHTOP, PRMT1, TET1, and MLL4 on the LGALS3 promoter in the vehicle‐ or verteporfin (10 µm)‐treated cells. C) Re‐co‐IP assay, using CAPTURE‐approached proteins, analyses of the interaction of TEAD4 with the indicated trans‐regulatory factors in the vehicle‐ or verteporfin (10 µm)‐treated cells. D) Heatmap represented by pseudocolors was generated using the ChIP‐qPCR values that represented the relative 5hmc/5mc ratio and enrichment of H4R3me2a and H3K4me3 on the LGALS3 promoter in the vehicle‐ or verteporfin (10 µm)‐treated cells. E) Left: Osteoclast differentiation assays by TRAP staining (left) in the presence of CM from the indicated cells treated with vehicle or verteporfin (10 µm). Right: Quantification of the number of TRAP+ multinuclear cells and TRAP activity from the experiment in the left panel. F) Left: Phase contrast and IF (staining of F‐actin) images of RAW 264.7 cells and SEM images of bone slice in the presence of CM from vehicle‐ or verteporfin (10 µm)‐treated cells. Right: Quantification of the number of fused multinuclear cells and resorption fit per bone slice TRAP activity from the experiment in the left panel. G) Upper: Schematic illustration of verteporfin inhibited “vicious cycle” between cancer cells and osteoclasts. Lower left: ELISA analysis of TGF‐β1 levels in CM from RAW 264.7 cells cultured onto the bone slice in the presence of CM form vehicle‐ or verteporfin (10 µm)‐treated cells. Lower right: MTT analysis of growth curves of HCC cells from the experiment in the upper panel. Each error bar in panels (A,B,E–G) represents the mean ± SD of three independent experiments. Significant differences were determined by Student's t‐test (A,B,E–G). *** p < 0.001.
Figure 8
Figure 8
verteporfin treatment inhibits osteolytic bone metastasis of HCC. A) BLI and μCT (longitudinal, cross and trabecular section) images of bone lesions from vehicle‐ or verteporfin (20 mg kg−1)‐treated mice (n = 8/group) intracardially injected with HCCLM3/vector, or HCCLM3/RNF219, or HCCLM3/RNF219/LGALS3 cells (left) and quantification of the osteolytic sites (n = 8/group) (right) from the experiment in the left panel. B) Histological (H&E and TRAP) images of bone lesions (left and middle) and quantification of the osteolytic lesion area and TRAP+ osteoclasts along the bone‐tumor interface of metastases (right) from representative mice from experiment in (A). Scale bar, 50 µm. C) Left: BLI, μCT (longitudinal, cross, and trabecular section) and histological (H&E and TRAP) images of HCCLM3‐BM4‐injected mice (n = 8/group) treated with verteporfin (20 mg kg−1) at indicated time. Right: quantification of the osteolytic sites and TRAP+ osteoclasts along the bone‐tumor interface of metastases from the representative mice from the experiment in the left panel. D) Model: ubiquitin ligase RNF219‐mediated α‐catenin degradation prompted YAP1/β‐catenin‐dependent epigenetic modifications of LGALS3 promoter, resulting in LGALS3 upregulation and metastatic bone diseases, and verteporfin therapy might serve as a promising approach to inhibit HCC bone‐metastasis. Each error bar in panels (A–C) represents the mean ± SD of three independent experiments. Significant differences were determined by Student's t‐test (A–C). * p < 0.05, *** p < 0.001.

References

    1. a) Natsuizaka M., Omura T., Akaike T., Kuwata Y., Yamazaki K., Sato T., Karino Y., Toyota J., Suga T., Asaka M., J. Gastroenterol. Hepatol. 2005, 20, 1781; - PubMed
    2. b) Okazaki N., Yoshino M., Yoshida T., Hirohashi S., Kishi K., Shimosato Y., Cancer 1985, 55, 1991. - PubMed
    1. Xiang Z. L., Zeng Z. C., Tang Z. Y., Fan J., He J., Zeng H. Y., Zhu X. D., Oncologist 2011, 16, 1028. - PMC - PubMed
    1. Liu N. N., Shen D. L., Chen X. Q., He Y. L., Chin. J. Oncol. 2010, 32, 203. - PubMed
    1. Harding J. J., Abu‐Zeinah G., Chou J. F., Owen D. H., Ly M., Lowery M. A., Capanu M., Do R., Kemeny N. E., O'Reilly E. M., Saltz L. B., Abou‐Alfa G. K., J. Natl. Compr. Cancer Network 2018, 16, 50. - PubMed
    1. Greco C., Forte L., Erba P., Mariani G., Q. J. Nucl. Med. Mol. Imaging 2011, 55, 337. - PubMed