. 2021 Jan 4;8(4):2002497.
doi: 10.1002/advs.202002497. eCollection 2021 Feb.

Senescent Tumor Cells Build a Cytokine Shield in Colorectal Cancer

Affiliations

Senescent Tumor Cells Build a Cytokine Shield in Colorectal Cancer

Yong Won Choi et al. Adv Sci (Weinh). .

Abstract

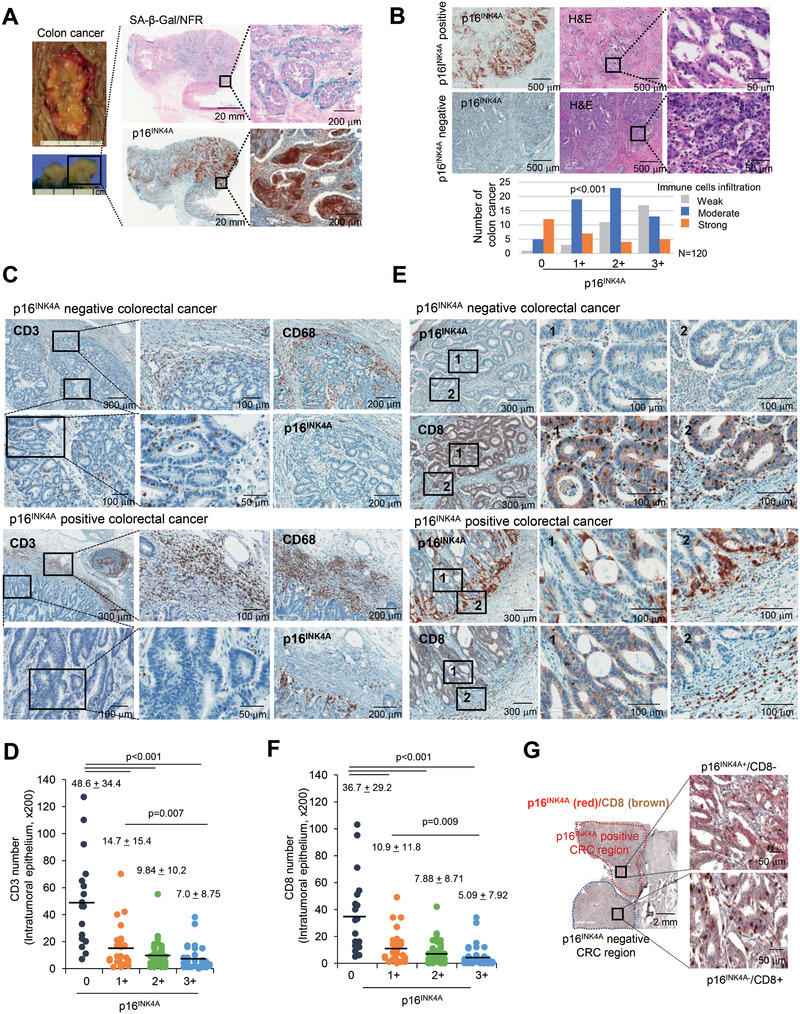
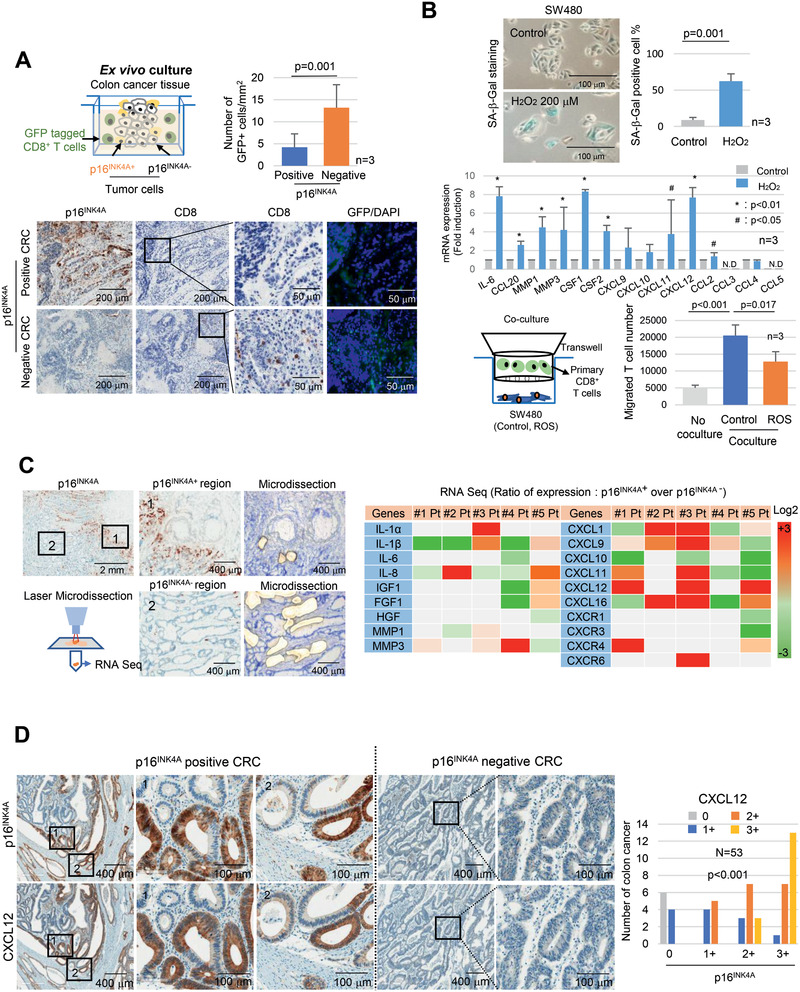
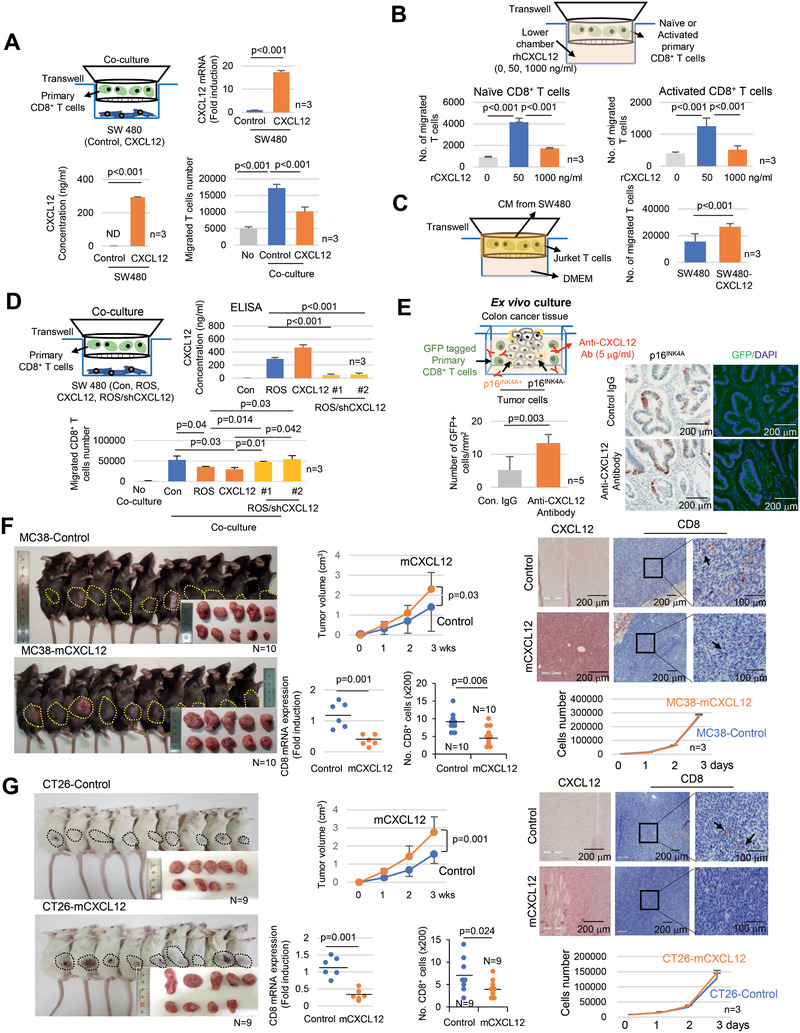
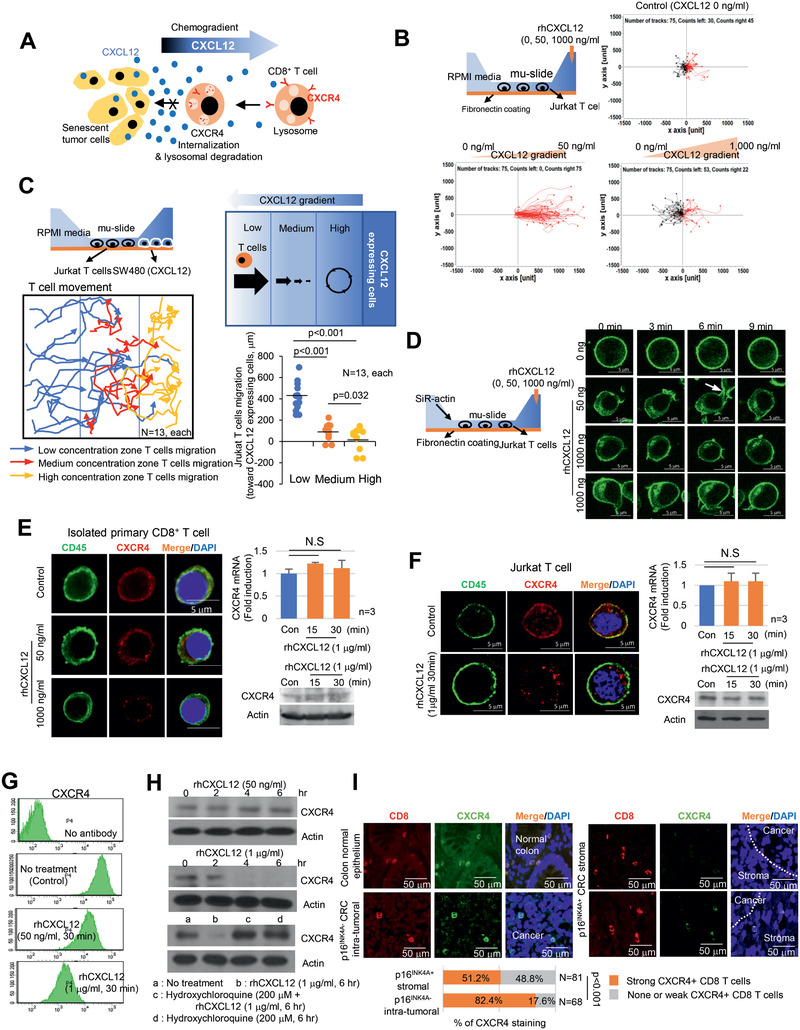
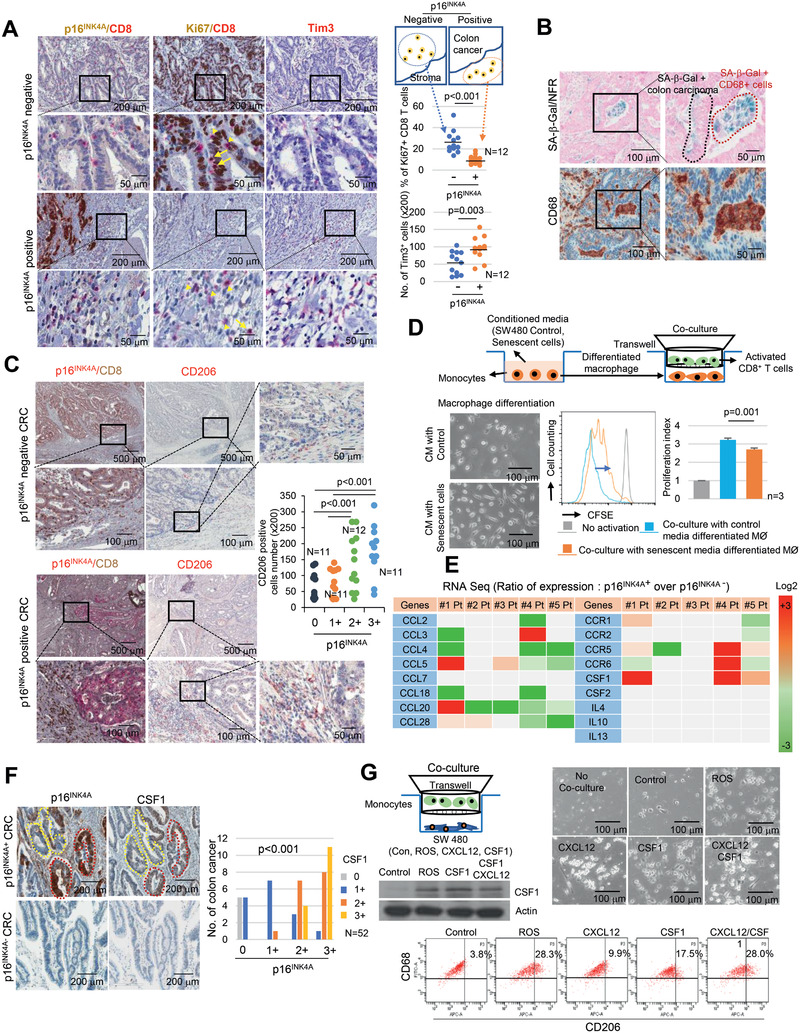
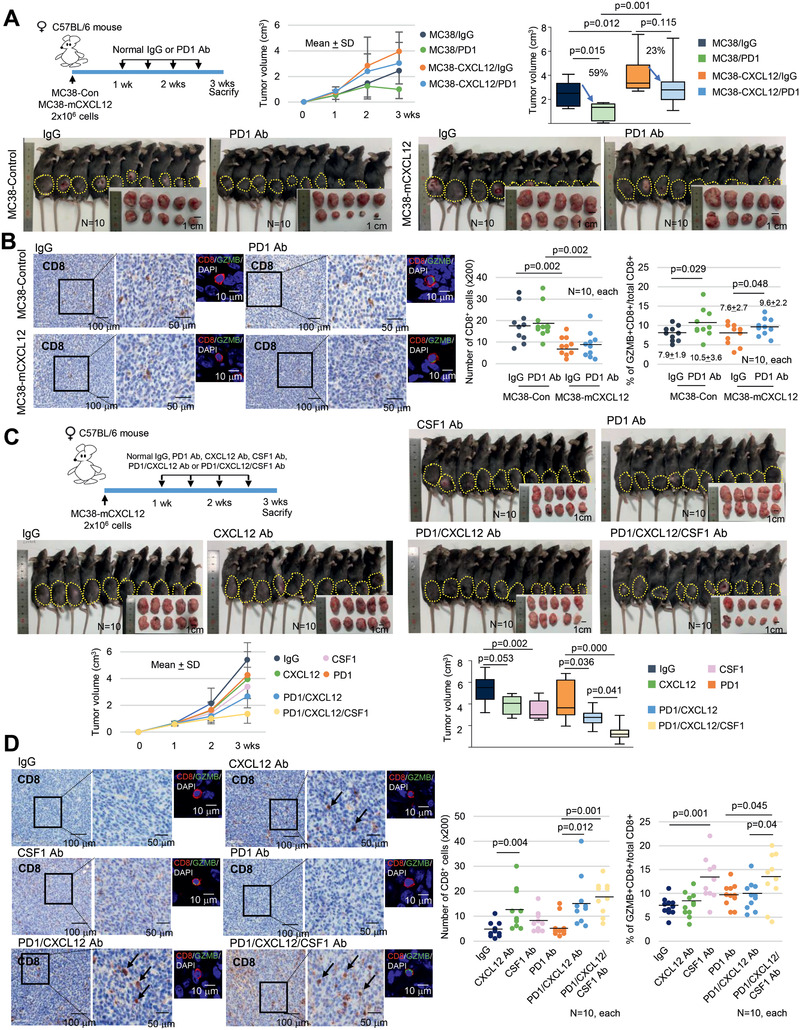
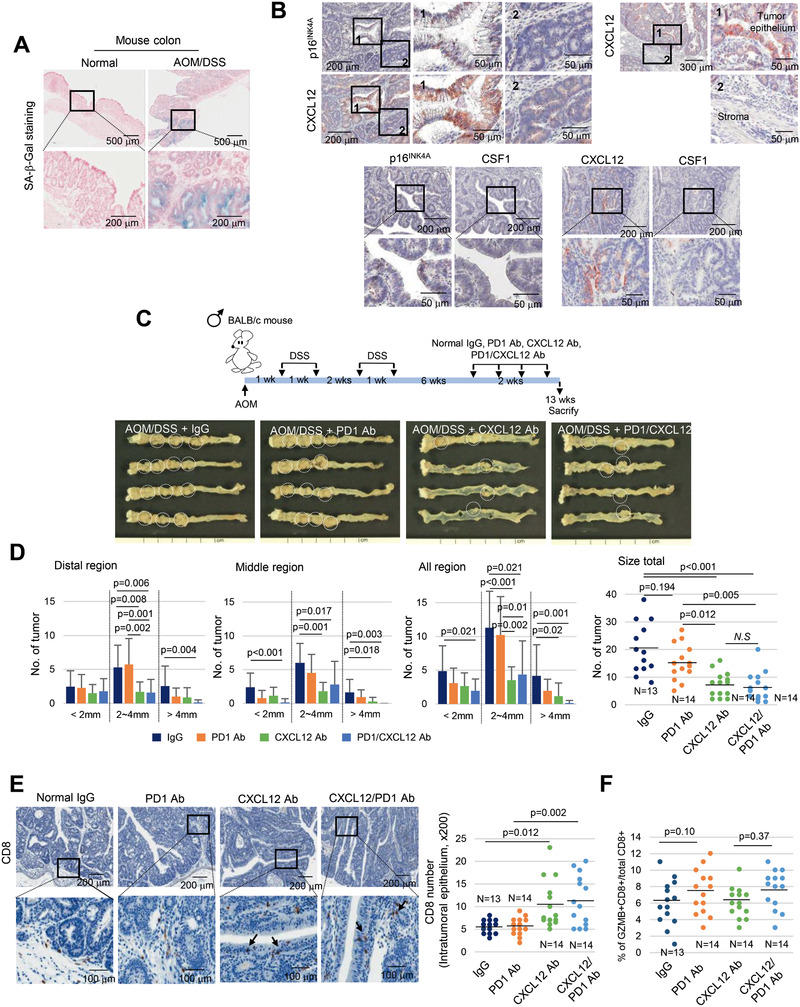
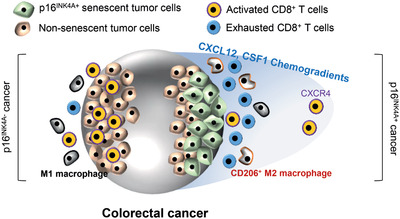
Cellular senescence can either support or inhibit cancer progression. Here, it is shown that intratumoral infiltration of CD8+ T cells is negatively associated with the proportion of senescent tumor cells in colorectal cancer (CRC). Gene expression analysis reveals increased expression of C-X-C motif chemokine ligand 12 (CXCL12) and colony stimulating factor 1 (CSF1) in senescent tumor cells. Senescent tumor cells inhibit CD8+ T cell infiltration by secreting a high concentration of CXCL12, which induces a loss of CXCR4 in T cells that result in impaired directional migration. CSF1 from senescent tumor cells enhance monocyte differentiation into M2 macrophages, which inhibit CD8+ T cell activation. Neutralization of CXCL12/CSF1 increases the effect of anti-PD1 antibody in allograft tumors. Furthermore, inhibition of CXCL12 from senescent tumor cells enhances T cell infiltration and results in reducing the number and size of tumors in azoxymethane (AOM)/dextran sulfate sodium (DSS)-induced CRC. These findings suggest senescent tumor cells generate a cytokine barrier protecting nonsenescent tumor cells from immune attack and provide a new target for overcoming the immunotherapy resistance of CRC.

Keywords: CD8+ T cells; CXCL12; cancer immunotherapy; colorectal cancers; senescent tumor cells.


Conflict of interest statement

The authors declare no conflict of interest.

Figures

Figure 1
Figure 1
Senescent tumor cells are frequently identified in CRC. A) Fresh CRC tissues were divided into two identical tissue sections and processed for either fresh frozen section for SA‐β‐Gal staining or as FFPE section for p16INK4A immunostaining. Nuclear fast red (NFR) for SA‐β‐Gal staining was applied as counterstain. The upper left panel shows the gross appearance of CRC, and the lower left panel shows the cross section of the CRC. The upper and lower right panels show the results of SA‐β‐Gal/NFR and p16INK4A immunostaining, respectively. B) χ 2 analysis of immune cell infiltration according to grades of p16INK4A immunostaining in 120 cases of MSS CRC tissues. C) CD3 positive cells infiltrated into p16INK4A negative CRC. p16INK4A negative and positive CRC tissues were serially dissected and immunostained for CD3, p16INK4A and CD68. D) Infiltrated CD3+ T cell numbers were analyzed according to the grades of p16INK4A (200× field). E) CD8 and p16INK4A immunostaining in CRC. “1” and “2” indicate the high magnification views of the original figure. F) Infiltrated CD8+ T cell numbers were analyzed according to the grades of p16INK4A (200× field). G) CRC tissues were stained with p16INK4A and CD8. The upper p16INK4A positive area and the lower p16INK4A negative area of the cancer showed different patterns of CD8+ T cell infiltration. p16INK4A negative and positive CRC indicates grade 0 and 1+, 2+, and 3+, respectively. The p value (D, F) was calculated by one‐way ANOVA and post hoc analysis. Results are presented as mean ± SD.
Figure 2
Figure 2
Senescent tumor cells exclude CD8+ T cells. A) Ex vivo culture. p16INK4A positive or negative CRC tissues were cocultured with the GFP lentivirus infected isolated primary CD8+ T cells for 24 h and then stained with p16INK4A, CD8, and GFP. The number of GFP positive cells was counted and presented as a bar graph. B) Senescent tumor cells inhibited CD8+ T cell migration. SW480 cells were treated with H2O2 (200 × 10−6 m) for 3 days and analyzed for SA‐β‐Gal expression (upper panel) and SASP expression (middle panel). T cell migration assay. Isolated primary CD8+ T cells were cocultured with SW480 (control or H2O2 treated) for 3 h, and the number of migrated CD8+ T cells was counted. C) Microdissection analysis. CRC tissues were serially dissected and stained with p16INK4A and toluidine blue. p16INK4A positive and negative regions were microdissected and then analyzed for mRNA expression (N = 5, upper panel). The expression in RNA sequencing indicates the relative values of the p16INK4A positive region compared with those of the p16INK4A negative region. D) CXCL12 expression in p16INK4A expressing senescent tumor cells. p16INK4A positive and negative CRC tissues were serially dissected and stained with p16INK4A and CXCL12 antibody, respectively. “1” and “2” indicate the high magnification views of the original figure. Results are presented as mean ± SD. The p value was calculated by the Mann–Whitney U test A) or Kruskall–Wallis test B) or χ 2 test D). N and n indicated the number of cases and independent experiments, respectively.
Figure 3
Figure 3
CXCL12 excludes CD8+ T cells. A) Isolated primary CD8+ T cells were cocultured with SW480 (control or CXCL12 overexpressed) for 3 h, and T cell migration was analyzed (lower right panel). B) The lower chambers of transwell were treated with 0, 50, and 1000 ng mL−1 rhCXCL12 and cultured with isolated primary naïve or CD3/CD28 activated CD8+ T cells for 3 h, T cell migration was subsequently analyzed. C) Jurkat T cells were cultured with the CM from SW480 cells (control or CXCL12 overexpressing cells) for 3 h and then T cell migration was analyzed. D) Isolated primary CD8+ T cells were cocultured with SW480 (control, ROS treated, CXCL12 overexpressing or ROS/shCXCL12) for 3 h and then T cell migration was analyzed. E) Ex vivo culture. p16INK4A positive CRC tissues were cocultured with GFP lentivirus infected isolated primary CD8+ T cells in media containing CXCL12 neutralizing antibody for 24 h and then stained for p16INK4A and GFP. The number of GFP positive cells was counted, and the results are presented as a bar graph. F and G) MC38 (control or mCXCL12 overexpressing) or CT26 (control or mCXCL12 overexpressing) mouse colon cancer cells were transplanted into 7 week old C57BL/6 or BALB/c mice, respectively. The mice were euthanized after 3 weeks, and the tumor size was analyzed. The tumor growth is presented as line graph. Results are presented as mean ± SD. Tumor tissues were stained with CXCL12 or CD8 antibodies. The arrow indicates the CD8+ cells. Mouse CD8 mRNA expression was analyzed and presented as dot graph. The infiltration of CD8+ T cells in tumors was analyzed (200×). Three randomly selected areas of the tumor tissue per animal were photographed and analyzed for CD8+ T cell infiltration; the results were averaged and then presented as a dot graph. In vitro cell proliferation assay. MC38 (control or mCXCL12 overexpressing) or CT26 (control or mCXCL12 overexpressing) cells were cultured, and the cell number was analyzed. Results are presented as mean ± SD. The p value was calculated by the Mann–Whitney U test (A, C, E, F, and G) or Kruskall–Wallis test (A, B, and D). N and n indicated the number of cases and independent experiments, respectively.
Figure 4
Figure 4
High concentrations of CXCL12 induce the loss of the plasma membrane CXCR4 in T cells. A) Schematic representation of CD8+ T cell migration in the presence of senescent tumor cells. B) CXCL12 chemogradient was developed using µ‐slide and then Jurkat T cell migration was analyzed. The migrated T cells were tracked, and the results are presented graphically (n = 75, each). The red and black lines indicate the tracks of the chemoattracted and chemorepulsed cells, respectively. C) The CXCL12 chemogradient was developed by CXCL12 overexpressing SW480 cells in µ‐slide, and T cell migration was analyzed. The migrated T cells were tracked, and the result is presented as a line graph (left panel). The migration distances were measured, and the result is presented graphically (lower right panel). The p value was calculated by one‐way ANOVA and post hoc analysis. D) Low and high concentrations of rhCXCL12 were treated with µ‐slide and lamellipodia formation was analyzed with SiR‐actin staining. The arrow indicates lamellipodia. E and F) CXCR4 expression in isolated primary CD8+ T cells E) and Jurkat T cells F). Isolated primary CD8+ T or Jurkat cells were treated with 50 or 1000 ng mL−1 of rhCXCL12 for 30 min and analyzed for CD45 by immunocytochemistry and CXCR4 expression by immunocytochemistry, real‐time PCR and western blot. G) Jurkat T cells were treated with rhCXCL12 (50 or 1000 ng mL−1) for 30 min and analyzed for CXCR4 expression in the plasma membrane by FACS. H) A high CXCL12 concentration induced CXCR4 lysosomal degradation. Jurkat T cells were treated with 50 or 1000 ng mL−1 rhCXCL12 for the indicated times and then analyzed for CXCR4 protein expression by western blotting. Jurkat T cells were treated with 1 µg mL−1 rhCXCL12 with or without 200 × 10−6 m hydroxychloroquine for 6 h and then analyzed for CXCR4 protein by western blotting. I) CXCR4 expression in CD8+ T cells in CRC. p16INK4A positive and negative CRC tissues were immunostained for CD8 (red) and CXCR4 (green). The indicated cells were counted and presented as a bar graph (lower panel). The p value was calculated using the χ 2 test. N indicated the number of cases. NS indicates no significant.
Figure 5
Figure 5
Senescent tumor cells inhibit CD8+ T cell activation via monocytes to M2 type macrophage differentiation. A) CD8+ T cells activation in p16INK4A positive and negative CRC. p16INK4A negative and positive CRC were dissected serially and immunostained with p16INK4A/CD8, Ki67/CD8 and Tim3, and the percentage of Ki67+/CD8+ cells was analyzed. Three randomly selected areas of the tumor tissue were photographed (200×) and then analyzed for Ki67+/CD8+ cell infiltration and Tim3+ cell number; the results were averaged and then presented as a dot graph. The p value was calculated by the Mann–Whitney U test. B) CD68 and SA‐β‐Gal staining analysis in CRC. C) Macrophage distribution analysis with CD206 in p16INK4A positive or negative CRC. The number of CD206 positive macrophages in CRC according to the grades of p16INK4A immunostaining was presented as a dot graph. D) T cell proliferation assay. Isolated primary monocytes were incubated with CM from SW480 or SW480/ROS for 7 days and then monocyte differentiation was analyzed (left lower panel). CFSE labeled CD8+ T activation by anti‐CD3/CD28 beads was performed under coculture with differentiated macrophages for 96 h, and suppression of T cell proliferation was measured by flow cytometry. The p value was calculated by one‐way ANOVA and post hoc analysis C,D). E) Microdissection analysis. The expression in RNA sequencing indicates the relative values of the p16INK4A positive region compared with the p16INK4A negative region. F) CRC tissues were serially sectioned for p16INK4A and CSF1 immunostaining. The p value was calculated using the χ 2 test. G) CSF1 polarized monocytes to M2 macrophages. Isolated primary monocytes were cocultured with SW480 (control, H2O2 treated, CSF1 overexpressing, and CXCL12 overexpressing) for 6 days and then analyzed for cell morphology (upper panel), and CD206 expression by FACS (lower panel), respectively. N and n indicated the number of cases and independent experiments, respectively.
Figure 6
Figure 6
CXCL12 inhibits the ICI efficacy. A) MC38 cells (control, mCXCL12 overexpressing) were transplanted into C57BL/6 mice. One week later, the mice were treated with isotype control IgG or anti‐PD1 antibody through intraperitoneal injection twice per week for 2 weeks. The mice were euthanized, and the tumor volume was analyzed. B) CD8+ and Granzyme B (GZMB)+/CD8+ T cell infiltration was analyzed in MC38 derived tumor tissue in mice. C) mCXCL12 overexpressing MC38 cells were transplanted into C57BL/6 mice. One week later, the mice were treated with isotype control IgG or anti‐PD1 antibody with or without mCXCL12/mCSF1 neutralizing antibody through intraperitoneal injection twice per week for 2 weeks. The mice were euthanized, and the tumor volume was analyzed. D) CD8+ and GZMB+/CD8+ T cell infiltration was analyzed in MC38 derived tumor tissues from mice (200×). Tumor volume was presented as mean ± SD with line graph, and the final tumor volume was presented as a Box‐and‐Whisker diagram. The line inside the box is median. The top and the bottom of the box are the 75% and 25% percentile, respectively. Error bars on the whiskers represent minimum to maximum. In the case of T cells number, three randomly selected areas of the tumor tissue per animal were photographed and then analyzed for CD8+ and GZMB+/CD8+ cell infiltration; the results were averaged and presented as a dot graph. The p value was calculated using one‐way ANOVA and post hoc analysis A–D). N indicated the number of cases.
Figure 7
Figure 7
Neutralization of CXCL12 inhibits progression of AOM/DSS‐induced CRC. A) SA‐β‐Gal staining in normal mouse colon epithelium and AOM/DSS‐induced CRC. B) CXCL12 expression in p16INK4A positive senescent tumor cells. AOM/DSS‐induced CRC tissues were serially dissected and stained with p16INK4, CXCL12 and CSF1 antibodies. “1” and “2” indicate the high‐magnification views of the original figure. C) Scheme of the AOM/DSS‐induced CRC and representative photograph of the colon tissues from each group. White circle indicates tumor nodules. D) Quantification of the number and size of tumors from each group. E) CD8+ T cell infiltration was analyzed in the AOM/DSS‐induced CRC tissues from each group (200×). Arrow indicates infiltrated CD8+ T cells. F) GZMB/CD8 double immunostaining was performed and the percentage of double positive cells were counted and presented as dot graph. Data are displayed as mean and the p value were calculated using one‐way ANOVA and post hoc analysis D–F).
Figure 8
Figure 8
Schematic representation of the role of senescent tumor cells in CRC on CD8+ T cell infiltration and macrophage differentiation.

References

    1. Braig M., Lee S., Loddenkemper C., Rudolph C., Peters A. H., Schlegelberger B., Stein H., Dorken B., Jenuwein T., Schmitt C. A., Nature 2005, 436, 660. - PubMed
    1. Michaloglou C., Vredeveld L. C., Soengas M. S., Denoyelle C., Kuilman T., van der Horst C. M., Majoor D. M., Shay J. W., Mooi W. J., Peeper D. S., Nature 2005, 436, 720. - PubMed
    1. Hernandez‐Segura A., Nehme J., Demaria M., Trends Cell Biol. 2018, 28, 436. - PubMed
    1. Haugstetter A. M., Loddenkemper C., Lenze D., Grone J., Standfuss C., Petersen I., Dorken B., Schmitt C. A., Br. J. Cancer 2010, 103, 505. - PMC - PubMed
    1. Ruhland M. K., Coussens L. M., Stewart S. A., Biochim. Biophys. Acta 2016, 1865, 14. - PMC - PubMed

LinkOut - more resources