Review
. 2021 Jan 4;8(4):2003129.
doi: 10.1002/advs.202003129. eCollection 2021 Feb.

Proteinaceous Hydrogels for Bioengineering Advanced 3D Tumor Models

Affiliations
Review

Proteinaceous Hydrogels for Bioengineering Advanced 3D Tumor Models

Barbara Blanco-Fernandez et al. Adv Sci (Weinh). .

Abstract

The establishment of tumor microenvironment using biomimetic in vitro models that recapitulate key tumor hallmarks including the tumor supporting extracellular matrix (ECM) is in high demand for accelerating the discovery and preclinical validation of more effective anticancer therapeutics. To date, ECM-mimetic hydrogels have been widely explored for 3D in vitro disease modeling owing to their bioactive properties that can be further adapted to the biochemical and biophysical properties of native tumors. Gathering on this momentum, herein the current landscape of intrinsically bioactive protein and peptide hydrogels that have been employed for 3D tumor modeling are discussed. Initially, the importance of recreating such microenvironment and the main considerations for generating ECM-mimetic 3D hydrogel in vitro tumor models are showcased. A comprehensive discussion focusing protein, peptide, or hybrid ECM-mimetic platforms employed for modeling cancer cells/stroma cross-talk and for the preclinical evaluation of candidate anticancer therapies is also provided. Further development of tumor-tunable, proteinaceous or peptide 3D microtesting platforms with microenvironment-specific biophysical and biomolecular cues will contribute to better mimic the in vivo scenario, and improve the predictability of preclinical screening of generalized or personalized therapeutics.

Keywords: 3D in vitro models; cancers; hydrogels; peptides; proteins.


Conflict of interest statement

The authors declare no conflict of interest.

Figures

Figure 1
Figure 1
Schematics of the TME and its key elements. Tumors are formed by a heterogeneous population of cancer cells, stromal cells, ECM, and soluble factors (e.g., cytokines, growth factors). The ECM is a complex 3D nanofibrous network of proteins that provides cell support and regulates several cellular functions.[ 26 , 27 ] As the 3D tumor mass progresses, there is an abnormal ECM production and remodeling, increasing the production and crosslinking of some types of collagen by lysyl oxidase (LOX), upregulation of matrix metalloproteinases (MMP), and subsequently, increasing the stiffness inside and around the tumor.[ 28 , 29 ] Stromal cell populations include fibroblasts, immune system cells, endothelial cells, mesenchymal/stromal stem cells (MSCs) and adipocytes. As the tumor grows, the impaired blood circulation generates and hypoxic environment, promoting the secretion of hypoxia‐inducible factors (HIFs), increasing cancer cells invasiveness and the formation of abnormal blood vessels.[ 15 ] Among stromal cells, tumor‐associated macrophages (TAMs) and cancer‐associated fibroblasts (CAFs) arise as one of the most important elements. TAMs are responsible for establishing an immunosuppressive TME[ 19 ] and CAFs crosstalk with the cancer cells promotes tumor progression, metastasis and drug resistance.[ 15 , 17 , 18 , 30 ] The dynamic exchange of cytokines/growth factors (GF) in the TME can also stimulate or inhibit several signaling pathways of cancer cells for survival, proliferation, migration, polarity, or differentiation.[ 15 , 31 , 32 ]
Figure 2
Figure 2
ECM‐mimetic hydrogel‐based platforms for establishing physiomimetic 3D in vitro tumor models.
Figure 3
Figure 3
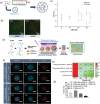
Collagen hydrogels used for cancer mechanotransduction and in vitro cancer modeling. a–e) Effect of interstitial flow fluid stress in MDA‐MB‐231 cancer cells laden in a collagen I hydrogel. a) Simulation of flow (velocity 4.6 µm s−1) across the cell. Pressure heat map. Orange coding represents the maximum and blue the minimum, and black arrows the local fluid velocity vectors. b) Micrograph of the reaction forces. Red arrows represent the tensile forces. White arrows represent compressive forces. Green channel represents vinculin distribution in collagen hydrogel laden cells subjected to interstitial flow fluid stress. These forces are required to maintain the static condition. A clear vinculin positive staining is observed in the area of cell/hydrogel tension. c) Scheme showing that integrin activation by interstitial flow fluid stress induces the localization of vinculin, FAK, paxillin, and actin at the upstream, and the formation of a protrusion in this direction. d) Vinculin, actin, paxillin, FAK, and FAKPY397 localization in a cell subjected, and not subjected to interstitial flow fluid stress. The flow promotes the polarization of the proteins upstream (scale bar: 10 µm). e) Evaluation of vinculin, paxillin, FAK, and FAKPY397 polarization at 4.6 µm s−1 for 4 h relative to upstream fluorescence intensity (+2 represents the maximum upstream polarization, and −2 represents the maximum downstream polarization). (*** p < 0.001, ** p < 0.01, and *p < 0.05). Reproduced with permission.[ 140 ] Copyright 2014, National Academy of Sciences. f–j) ECM influence in osteoblast and osteosarcoma cells. f) Scheme of the tested platforms. g) Osteosarcoma and h) osteoblast cell proliferation Col I, agarose, Matrigel, and alginate hydrogels (*p < 0.05, *** p < 0.001). i) mRNA expression of HIFA, VEGF, MMP2, and MMP9 of osteosarcoma MG‐63. j) mRNA expression of ALP, COL1, BMP2, and RUNX2 of osteoblast hFOB1.19 (*p < 0.05, ** p < 0.01, *** p < 0.001). Reproduced with permission.[ 154 ] Copyright 2019, Wiley‐VCH GmbH & Co.
Figure 4
Figure 4
Microtumor and microfluidic device comprising Col I hydrogels for 3D in vitro cancer modeling. a–g) Use of Col I and alginate for the preparation of tumor MTs for drug screening. a,b) Schematic representation of the microcapsules used to create the tumor MT, microcapsules are formed by a shell of alginate and a nucleus of Col I encapsulating MCF‐7 cancer cells. The produced microcapsules are then self‐assembled in the presence of human umbilical vein endothelial cells and human adipose‐derived mesenchymal/stromal stem cells in Col I hydrogel in the microfluidic perfusion device. c) Vessel structure staining in the MTs (green channel: actin, red channel: CD31, and blue channel: cell nuclei) and the cross‐sectional images (i–iii) showing the vessels lumen (scale bar: 50 µm, for cross‐sections 20 µm). d) Viability and e) IC50 of cells cultured in 2D, 3D avascular, and 3D vascular MTs after 4 days of treatment with free doxorubicin. f) Cell viability of vascular MT after 4 days of treatment with NPs encapsulating doxorubicin. g) IC50 of free and nanoencapsulated doxorubicin in vascular MT after 4 days of treatment. Reproduced with permission.[ 166 ] Copyright 2017, American Chemical Society. h–j) Simulation of oxygen and nutrients gradients in a colorectal microfluidic model. h) Scheme of the microdevice containing HCT‐116 cell‐laden collagen I hydrogels. The cell density seeded in the hydrogel modulates the necrotic region (green: life cells, red: death cells). i,j) Gene expression changes at different hydrogel locations. i) Hydrogel punches were isolated from different zones of the hydrogel for studying the gene profile. j) Gene expression profile indicating that cells express different genes in the first 5 mm of the hydrogel, than those located at 10 and 15 mm. Reproduced with permission.[ 171 ] Copyright 2001, Royal Society of Chemistry.
Figure 5
Figure 5
Hybrid collagen‐based hydrogels for 3D in vitro tumor modeling. a–f) Collagen remodeling by mamospheres comprising MDA‐MB‐231 and mammary fibroblasts in hydrogels of Col I/alginate containing different polyhedral oligomeric silsesquioxanes (POSS) (trisilanolisobutyl‐POSS (TSB POSS) or PEGylated‐POSS (PEG POSS). a,b) Collagen microstructure in 1% TSB POSS, 1% PEG POSS, or CaCl2 crosslinked (control) hydrogels. a) Collagen fiber diameter and b) volume, being *p > 0.05 in comparison with the PEG POSS and # p > 0.05 in comparison with the TSB POSS. c) Mamospheres embedded in hydrogels on day 0 showing no cell protrusions in the spheroids and d) after 2 days, where cells exhibited an elongated morphology and migration. 3D Spheroids are represented as a green/red overlay, individual MDA‐MB‐231 cells in green color, and a second harmonic imaging of fibrillar collagen in purple color. e,f) MDA‐MB‐231 invasion and fibers remodeling. Collagen fibers alignment perpendicular to spheroid on days e) 0 and 2 and f) invasion distances of cells on day 2 , being *p > 0.05 in comparison with the PEG POSS and # p > 0.05 in comparison with the control. Reproduced with permission.[ 176 ] Copyright 2019, Elsevier. g) Fabrication of organoid spheroidal constructs made of collagen I methacrylate and thiolated‐HA by 3D‐printing technology in a gelatin bath compatible with HTS. Gelatin can be afterward removed to have the organoids. Reproduced with permission.[ 179 ] Copyright 2020, by the authors. h) CAD design of a tumor model for 3D printing and its final result after printing. The hydrogel was produced by using agarose and collagen I and mixed with different food colorants. Reproduced under the terms of the Creative Commons Attribution license CC‐BY 4.0.[ 147 ] Copyright 2019,The Authors, published by MDPI. i,j) Effect of the stiffness on HepG2 cells. Stiffness increase in the hydrogels was achieved by adding rising amounts of PEG‐diNHS (PEG‐COL). i) Morphology of the spheroids and effects of stiffness on detoxification activity. HepG2 spheroids formed in collagen hydrogels (E 0 = 0.7 kPa, first row) and in collagen‐PEG gels (E 0 = 4.0 kPa, second row). The first column depicts 3D spheroids morphology. Green channel represents phalloidin‐Alexa 488 labeled actin and red channel represents nuclei staining with DAPI. In the right column, 3D spheroids live imaging of the activity of P450. The fluorescent images were processed to have 256 pseudocolors representing its activity. Lower stiffness promoted the formation of larger, more disorganized spheroids than higher stiffness substrates. 3D spheroids cultured in collagen hydrogels of 0.7 kPa exhibited a lower cytochrome P450 detoxification activity and generated larger and more disorganized 3D spheroids than in collagen‐PEG hydrogel of 4 kPa (scale bar: 50 µm). j) Effects of hydrogel stiffness in proangiogenic activity. Size and number of blood vessels formed in chicken CAM after the implantation of hydrogel embedded HepG2 3D spheroids. Purple channel represents pure collagen hydrogels (0.7 kPa) laden with spheroids, blue channel represents collagen‐PEG hydrogels (4.0 kPa) laden with 3D spheroids and gray channel represents, acellular pure collagen hydrogels (0.7 kPa). Reproduced with permission.[ 150 ] Copyright 2011, Elsevier.
Figure 6
Figure 6
Gelatin‐based hydrogels for 3D in vitro tumor modeling. a–c) Hydrogels of GelMA for the fabrication of tumor models of ovarian cancer. a) Fabrication of GelMA hydrogels. Gelatin is functionalized with methacrylic anhydride to form GelMA. Then, the polymer is dissolved in PBS in the presence of a photoinitiator and cells at 37 °C, and photo crosslinked with ultraviolet light. b,c) Morphology and cellular proliferation of OV‐MZ‐6 spheroids in GelMA hydrogels of 2.5% (0.7 kPa), 5% (3.4 kPa), 7% (7.3 kPa), and 10% (16.5 kPa). b) Confocal images showing the nuclei in blue and in red the cytoskeleton (scale bar: 100 µm). c) DNA content at days 1,7, and 21 days normalized to day 1. The cellular morphology depends on hydrogel stiffness, at lower concentrations cells form lose aggregates and at higher concentrations cells form small 3D spheroids. Moreover, cells proliferate faster at lower concentrations. Reproduced with permission.[ 199 ] Copyright 2014, Elsevier. d–m) Model of sarcoma cells invasion in hypoxic hydrogels of FA‐Gel. d) Dissolved O2 in murine sarcoma cells from murine tumors. e,f) Hematoxylin and eosin (e) and HIF‐1 (f) stainings in small and large tumors (scale bars: 200 µm, 4× and 20 µm, 40×). g) Expression of HIF‐1 in tumors. h) Scheme of the encapsulation of the tumor biopsy in the FA‐Gel hydrogels. i) Dissolved O2 in hydrogels in hypoxic and nonhypoxic conditions over time. j) Sarcoma tumors in the hydrogels under light microscopy and fluorescence microscopy. Actin in green and nuclei in blue (scale bars: 100 µm.). k) Tumor invasion within the hydrogel under hypoxic and nonhypoxic conditions. l,m) Collagen deposition in tumor after 7 days in culture. l) Immunofluorescence images. Collagen in red, nuclei in blue (scale bars: 25 µm). m) Quantification of the collagen (** p < 0.01, *** p < 0.001). Reproduced with permission.[ 209 ] Copyright 2014, National Academy of Sciences. n,o) Hydrogels of gelatin–phenol enzymatically crosslinked for the culture of colorectal organoids. n) Organoids after 15 days of culture, sowing basolateral expression of ITGA6 and CK20 and apical F‐actin expression, maintaining the epithelial polarity, in the hydrogel and Geltrex (scale bars: 50 µm). o) Profiles of mutations in organoids grown in the hydrogels or Geltrex for 9 days or the tumor xenograft after 9 days. Reproduced with permission.[ 207 ] Copyright 2019, Elsevier.
Figure 7
Figure 7
Hybrid gelatin hydrogels formulated by combination with collagen and PEG to generate bioactive platforms for in vitro cancer modeling. a–c) Microwell platform to study the effect of the stiffness in the cross‐talk of adipocytes and breast cancer cells. Microwells were produced in GelMA and 4‐arm polyethylene glycol acrylate‐RGD hydrogels with stiffness ranging from 200 Pa (healthy tissue) or 3 kPa (tumor tissue). Mouse embryo fibroblasts (3T3‐L1) differentiated to adipocytes were dispersed in the hydrogel and breast cancer cells (HCC1806 cells and MDA‐MB‐231) into the microwells. a) Scheme of the fabrication of the microwell system. b) Stromal cell‐laden hydrogel‐based microwell arrays for culturing human breast cancer cell line HCC1806. Brightfield and immunofluorescence in the microwells (blue nuclei, red adipocytes, and green E‐cadherin) (scale bars: 500 µm, 4‐well arrays, and 100 µm, single well). c) Adipocyte differentiation efficiency in cocultures with HCC1806 spheroids or MDA‐MB‐231 spheroids. *** p < 0.0001, N.S.: no significant differences. Reproduced with permission.[ 214 ] Copyright 2018, Elsevier. d–f) Cell microstructures made of HepG2, HUVECs, NIH3T3 cell sheet and collagen beads. d to Wrapped microstructures at day 1. White arrows show the different components. e) CD31 staining (green) at day 7 showing HUVEC connected between themselves (scale bars: 500 µm). f) Scheme of the cellular microstructures fabrication. NIH3T3 were seeded on top of a stimuli‐sensitive hydrogel. Then, cells and collagen beads were placed on the cell sheet. After the hydrogel degradation, the microstructures are formed. Reproduced with permission.[ 215 ] Copyright 2020, Springer Nature. g–j) Cell invasion of MDA‐MB‐231 in GelMA and Col I hydrogels. g) MDA‐MD‐231 invasion in hydrogels of 2 and 12 kPa. Marked with white arrow elongated cells and with red arrow the ameboid cells (scale bar = 50 µm, left and 25 µm, right). h,i) Cell invasion of MDA‐MB‐231 in presence of a pan‐MMP inhibitor (GM6001), which had no effect in 2 kPA hydrogels, but eliminated the actin‐enriched protrusions in hydrogels with higher stiffness (scale bar = 50 µm). Green channel: cytoskeleton and blue channel: nuclei. j) Immunofluorescence micrographs of 3D spheroids showing the upregulation of MENA (scale bar = 150 µm) in low and high stiffness hydrogels. Reproduced with permission.[ 216 ] Copyright 2020, Elsevier.
Figure 8
Figure 8
Gelatin hydrogels combined with hyaluronic acid or alginate for the fabrication of in vitro cancer models. a–c) Glioblastoma model in a hydrogel of GelMA and HA‐MA. a) Scheme of the coculture in perivascular cells and U87‐MC cells in hydrogels. b) Immunofluorescence of the hydrogel, in green U87‐MG cancer cells and in red CD31+ endothelial cells, being both in proximity (scale bar: 200 µm). c) Growth rate of inhibition (GR) at different concentrations of TM of the triculture model or only GBM cells (*p < 0.05). Reproduced with permission.[ 219 ] Copyright 2019, Elsevier. d–g) Model of prostate cancer metastasis to bone using HAMA and GelMA beads. d) Scheme of the tumor model fabrication using superhydrophobic surfaces and its use. e) Fluorescence micrographs of hydrogel beads with different HAMA content containing prostate cancer cells (PC‐3) labeled with DiO (blue) and human osteoblasts labeled with DiD (red) (scale bar: 200 µm). f,g) Assessment of the cytotoxicity of cisplatin in microgel beads with different HA‐MA content and spheroids formed under low attachment conditions. f) Heat map representing the cell viability at increasing drug concentrations. g) Cell viability of each model incubated with 250 × 10−6 m of cisplatin. Reproduced with permission.[ 220 ] Copyright 2019, Elsevier.
Figure 9
Figure 9
Fibrin hydrogels used for 3D in vitro cancer modeling. a–e) Microfluidic device to recapitulate the bone metastasis from colorectal cancer and gastric cancer and study angiogenesis. The bone TME was recapitulated with the combination of fibrin hydrogels and hydroxyapatite and colon/gastric cancer cells and fibroblasts. a) Schemes of the microfluidic device. b,c) Confocal images of the blood vessels sprouting for b) MKN74 and c) SW620 in hydrogels containing 0.2% and 0.4% of hydroxyapatite (scale bar: 100 µm). Analysis of the sprouting length blood vessels for d) MKN74 and e) SW620 in hydrogels containing 0.2% and 0.4% of hydroxyapatite. Reproduced under the terms of the Creative Commons Attribution license CC‐BY 4.0.[ 245 ] Copyright 2019, The Authors. f–i) Microtumors of MCF‐7 cells in microspheres of PEG–fibrinogen assembled through a water–oil emulsification. (f‐A to D) Cell viability of a MCF‐7 spheroid and a microtumor. Hydrogels were labeled with calcein AM (green) and ethidium homodimer (red), white lines represents the microparticle (scale bar: 100 µm). g–i) Improved tumorigenicity in microtumor. g) Confocal micrograph of g‐A) tumor spheroids, g‐B) microtumor, and g‐C) PEGDA microspheres (nuclei: blue, actin: red, scale bar: 50 µm). h) reduction in polarity (n > 20, p < 0.05). i) Reduction in nuclear area (n > 100 cells, p < 0.05). Blue diamonds, mean; rectangular boxes, lower, medians, and upper quartiles. Cells growing in these microtumors lose the apicobasal polarity, indicating a more malignant phenotype, in comparison to spheroids obtained by a scaffold free approach. Reproduced with permission.[ 246 ] Copyright 2017, Elsevier.
Figure 10
Figure 10
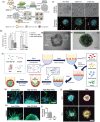
Peptide hydrogels as bioengineered platforms for 3D in vitro cancer modeling. a–e) Fmoc‐dipeptide hydrogels were employed for the fabrication of HepaRG hepatoma 3D spheroids. a) Scheme of fabrication of an Fmoc‐dipeptide hydrogel bioink, bioprinting, and culture of cancer cells to generate 3D spheroids in the macropores of the bioprinted construct. b) Atomic force microscopy micrographs of Fmoc‐YD, Fmoc‐YK, and Fmoc‐YD/YK nanofibers. c) HepaRG hepatoma 3D spheroids growth in Fmoc‐YD/YK hydrogels (** p < 0.01 and *** p < 0.001. d) Optical photographs of spheroids over time (scale bar: 150 µm). e) Fluoresce microscopy micrographs of 3D spheroids cultured at day 14 (scale bar: 100 µm). First row, live cells (green channel) and dead cells (red channel). Second row, nuclei (blue channel) and F‐actin (green channel) staining. Third row, nuclei (blue channel) and E‐cadherin (green channel) staining. Reproduced with permission.[ 275 ] Copyright 2019, American Chemical Society. f–i) Use of bQ13 and RADA16‐I for prostate adenocarcinoma cells (LNCaP) 3D spheroids formation. TEM micrographs of negative stained hydrogels of f) bQ13, g) RADA16‐I, and h) Q11 (scale bar = 100 nm). i) Immunofluorescence micrographs of LNCaP spheroids cultured in bQ13, Matrigel, and RADA16‐I. E‐cadherin (red channel), laminin‐332 (secreted ECM, green channel), and cell nuclei (blue channel) (scale bar = 100 µm). Reproduced with permission.[ 283 ] Copyright 2018, John Wiley and Sons.

References

    1. Wong C., Siah K., Lo A., Biostatistics 2019, 20, 366. - PMC - PubMed
    1. Toniatti C., Jones P., Graham H., Pagliara B., Draetta G., Cancer Discovery 2014, 4, 397. - PubMed
    1. Kamb A., Nat. Rev. Drug Discovery 2005, 4, 161. - PubMed
    1. Ireson C. R., Alavijeh M. S., Palmer A. M., Fowler E. R., Jones H. J., Br. J. Cancer 2019, 121, 101. - PMC - PubMed
    1. Mak I., Evaniew N., Ghert M., Am. J. Transl. Res. 2014, 6, 114. - PMC - PubMed